

Technical efficiency of national HIV/AIDS spending in 78 countries between 2010 and 2018: A data envelopment analysis
- PMID: 36962380
- PMCID: PMC10022340
- DOI: 10.1371/journal.pgph.0000463
Technical efficiency of national HIV/AIDS spending in 78 countries between 2010 and 2018: A data envelopment analysis
Abstract
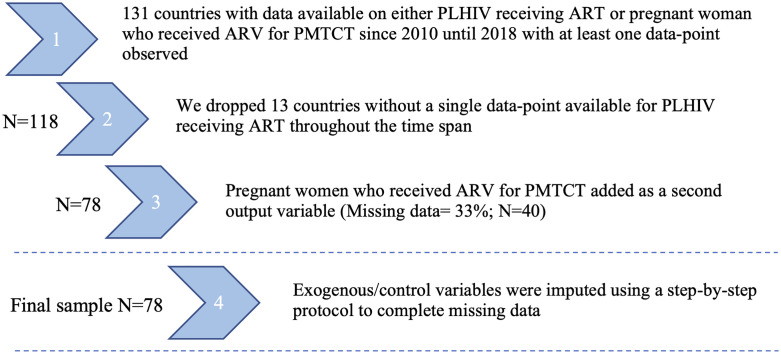
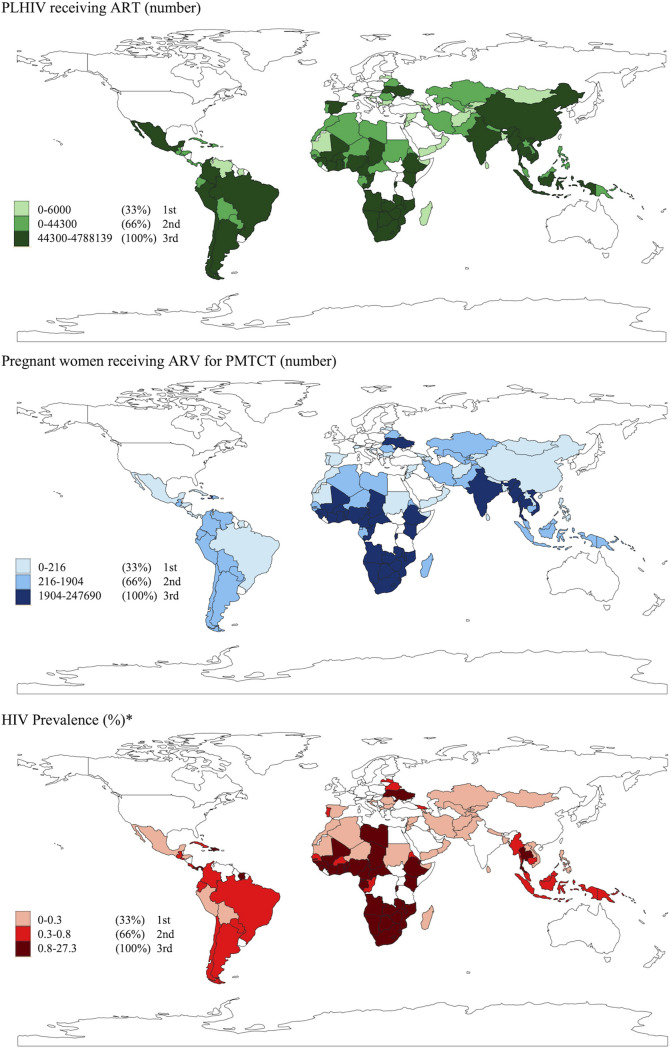
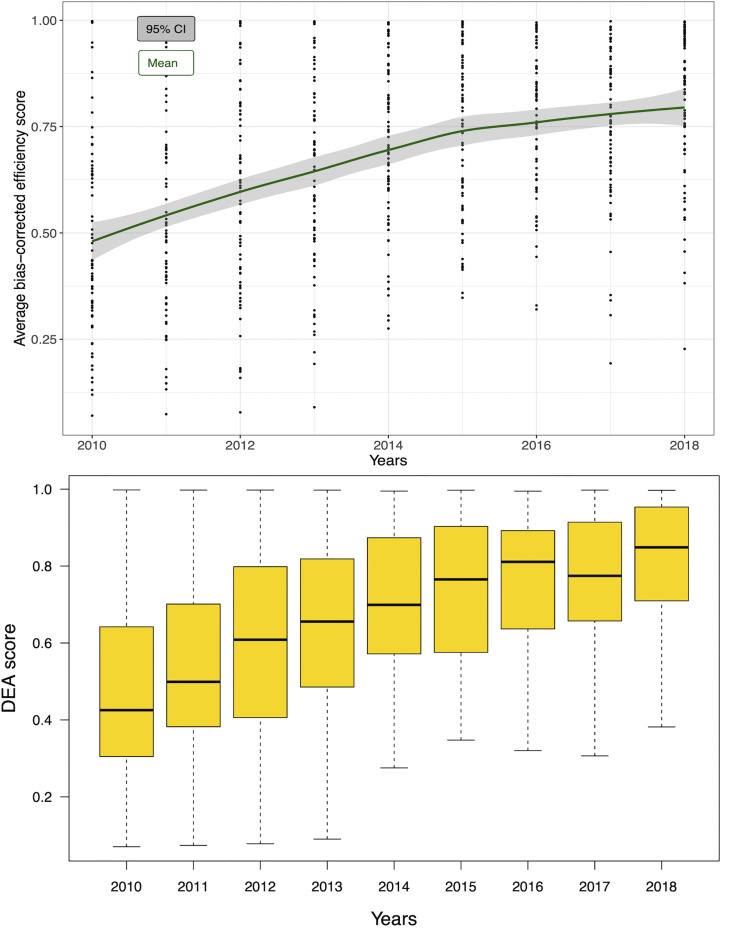
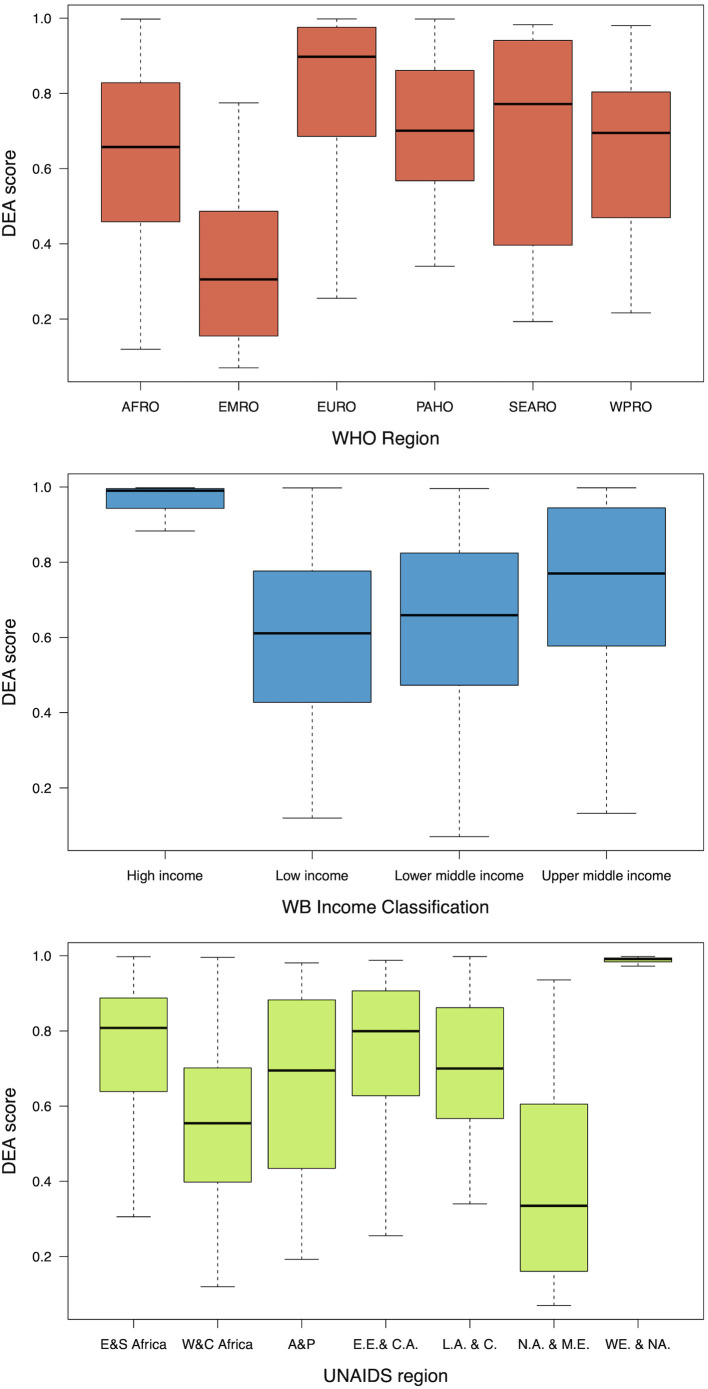
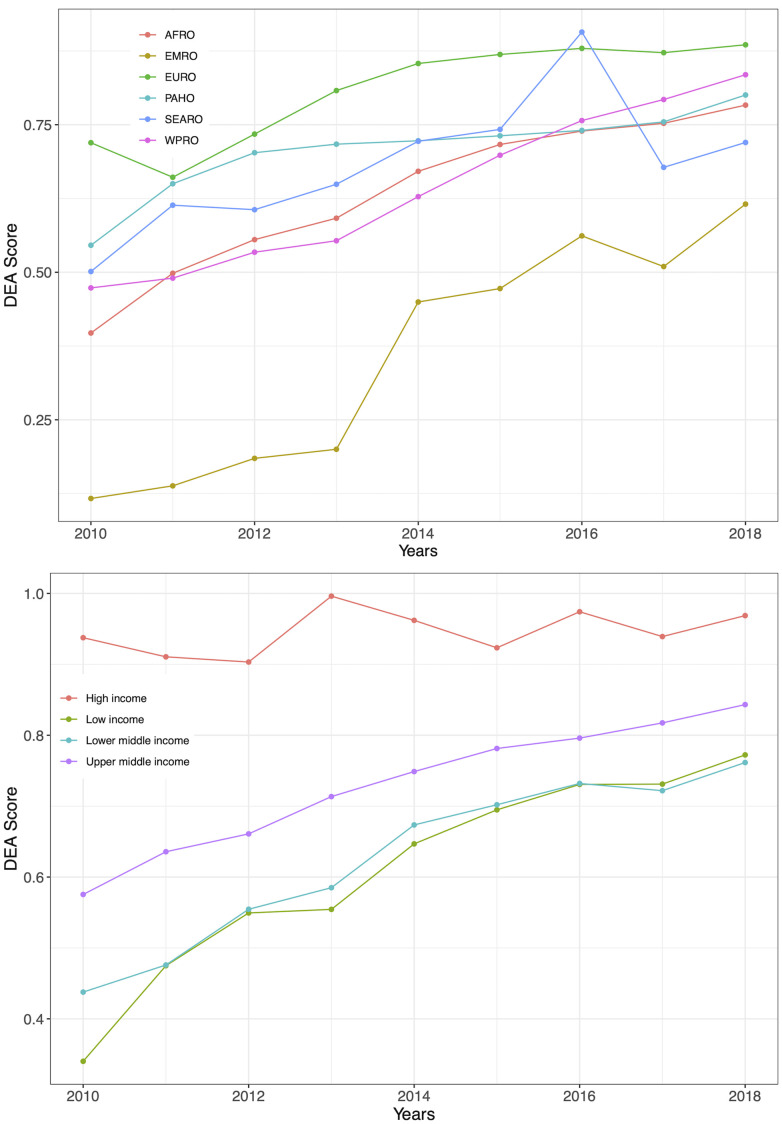
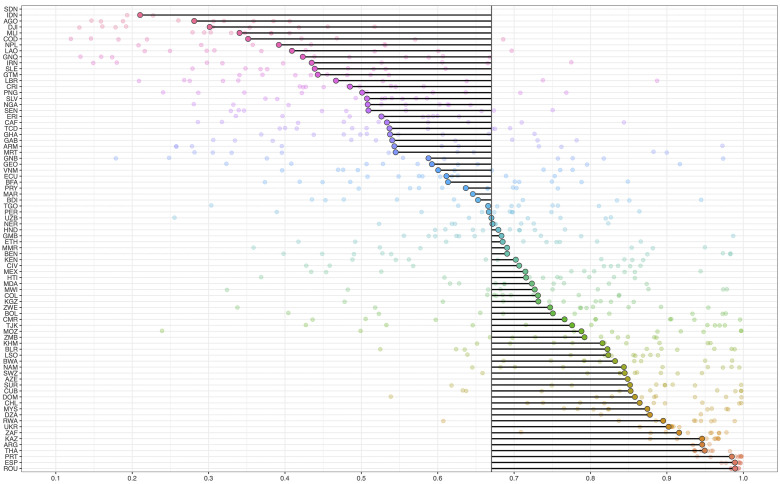
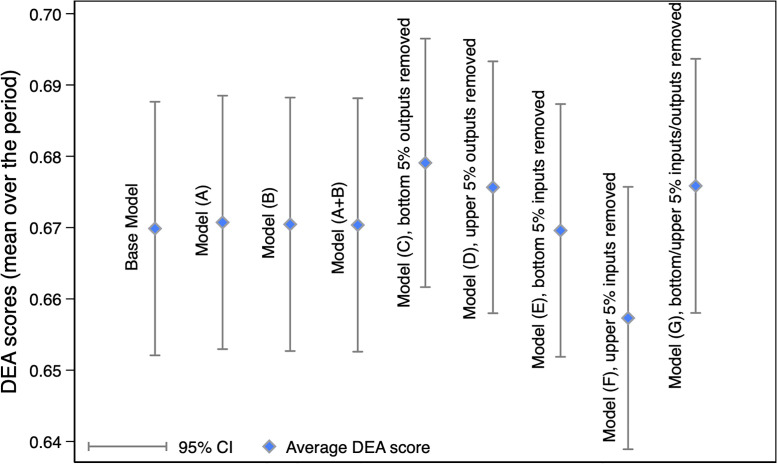
HIV/AIDS remains a leading global cause of disease burden, especially in low- and middle-income countries (LMICs). In 2020, more than 80% of all people living with HIV (PLHIV) lived in LMICs. While progress has been made in extending coverage of HIV/AIDS services, only 66% of all PLHIV were virally suppressed at the end of 2020. In addition to more resources, the efficiency of spending is key to accelerating progress towards global 2030 targets for HIV/AIDs, including viral load suppression. This study aims to estimate the efficiency of HIV/AIDS spending across 78 countries. We employed a data envelopment analysis (DEA) and a truncated regression to estimate the technical efficiency of 78 countries, mostly low- and middle-income, in delivering HIV/AIDS services from 2010 to 2018. Publicly available data informed the model. We considered national HIV/AIDS spending as the DEA input, and prevention of mother to child transmission (PMTCT) and antiretroviral treatment (ART) as outputs. The model was adjusted by independent variables to account for country characteristics and investigate associations with technical efficiency. On average, there has been substantial improvement in technical efficiency over time. Spending was converted into outputs almost twice as efficiently in 2018 (81.8%; 95% CI = 77.64, 85.99) compared with 2010 (47.5%; 95% CI = 43.4, 51.6). Average technical efficiency was 66.9% between 2010 and 2018, in other words 33.1% more outputs could have been produced relative to existing levels for the same amount of spending. There is also some variation between WHO/UNAIDS regions. European and Eastern and Southern Africa regions converted spending into outputs most efficiently between 2010 and 2018. Rule of Law, Gross National Income, Human Development Index, HIV prevalence and out-of-pocket expenditures were all significantly associated with efficiency scores. The technical efficiency of HIV investments has improved over time. However, there remains scope to substantially increase HIV/AIDS spending efficiency and improve progress towards 2030 global targets for HIV/AIDS. Given that many of the most efficient countries did not meet 2020 global HIV targets, our study supports the WHO call for additional investment in HIV/AIDS prevention and control to meet the 2030 HIV/AIDS and eradication of the AIDS epidemic.
Copyright: © 2022 Allel et al. This is an open access article distributed under the terms of the Creative Commons Attribution License, which permits unrestricted use, distribution, and reproduction in any medium, provided the original author and source are credited.
Conflict of interest statement
The authors have declared that no competing interests exist.
Figures
Similar articles
-
Resource needs and gap analysis in achieving universal access to HIV/AIDS services: a data envelopment analysis of 45 countries.Health Policy Plan. 2016 Jun;31(5):624-33. doi: 10.1093/heapol/czv109. Epub 2015 Nov 9. Health Policy Plan. 2016. PMID: 26552409
-
National tuberculosis spending efficiency and its associated factors in 121 low-income and middle-income countries, 2010-19: a data envelopment and stochastic frontier analysis.Lancet Glob Health. 2022 May;10(5):e649-e660. doi: 10.1016/S2214-109X(22)00085-7. Lancet Glob Health. 2022. PMID: 35427522 Free PMC article.
-
Potential for additional government spending on HIV/AIDS in 137 low-income and middle-income countries: an economic modelling study.Lancet HIV. 2019 Jun;6(6):e382-e395. doi: 10.1016/S2352-3018(19)30038-4. Epub 2019 Apr 26. Lancet HIV. 2019. PMID: 31036482 Free PMC article.
-
How should HIV resources be allocated? Lessons learnt from applying Optima HIV in 23 countries.J Int AIDS Soc. 2018 Apr;21(4):e25097. doi: 10.1002/jia2.25097. J Int AIDS Soc. 2018. PMID: 29652100 Free PMC article. Review.
-
Viral load monitoring for people living with HIV in the era of test and treat: progress made and challenges ahead - a systematic review.BMC Public Health. 2022 Jun 16;22(1):1203. doi: 10.1186/s12889-022-13504-2. BMC Public Health. 2022. PMID: 35710413 Free PMC article.
Cited by
-
Performance evaluation of national healthcare systems in the prevention and treatment of non-communicable diseases in sub-Saharan Africa.PLoS One. 2023 Nov 16;18(11):e0294653. doi: 10.1371/journal.pone.0294653. eCollection 2023. PLoS One. 2023. PMID: 37972071 Free PMC article.
-
Assessing the efficiency of health systems in achieving the universal health coverage goal: evidence from Sub-Saharan Africa.Health Econ Rev. 2023 May 2;13(1):25. doi: 10.1186/s13561-023-00433-y. Health Econ Rev. 2023. PMID: 37129773 Free PMC article.
-
Cost-effectiveness of health insurance among women engaged in transactional sex and impacts on HIV transmission in Cameroon: a mathematical model.BMJ Glob Health. 2025 Feb 18;10(2):e017870. doi: 10.1136/bmjgh-2024-017870. BMJ Glob Health. 2025. PMID: 39965863 Free PMC article.
References
-
- UNAIDS. FACT SHEET–World AIDS Day, 2019 2021 https://www.unaids.org/sites/default/files/media_asset/2021-global-aids-....
-
- Frank TD, Carter A, Jahagirdar D, Biehl MH, Douwes-Schultz D, Larson SL, et al.. Global, regional, and national incidence, prevalence, and mortality of HIV, 1980–2017, and forecasts to 2030, for 195 countries and territories: a systematic analysis for the Global Burden of Diseases, Injuries, and Risk Factors Study 2017. The lancet HIV. 2019;6(12):e831–e59. - PMC - PubMed
-
- Global A. Update. Seizing the moment, tackling entrenched inequalities to end epidemics. 2020.
-
- UNAIDS. Understanding fast-track: Accelerating action to end the AIDS epidemic by 2030. UNAIDS Geneva; 2015.
LinkOut - more resources
Full Text Sources
Miscellaneous