. 2022 Nov 2;2(11):e0000603.
doi: 10.1371/journal.pgph.0000603. eCollection 2022.

Direct estimates of absolute ventilation and estimated Mycobacterium tuberculosis transmission risk in clinics in South Africa

Affiliations

Direct estimates of absolute ventilation and estimated Mycobacterium tuberculosis transmission risk in clinics in South Africa

Peter G Beckwith et al. PLOS Glob Public Health. .

Abstract

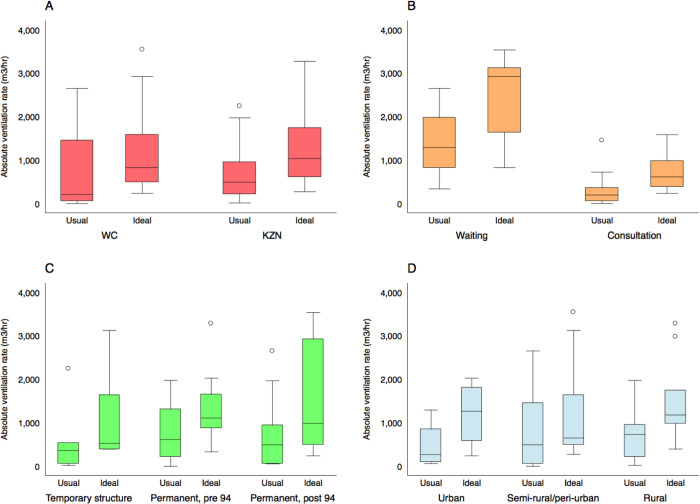
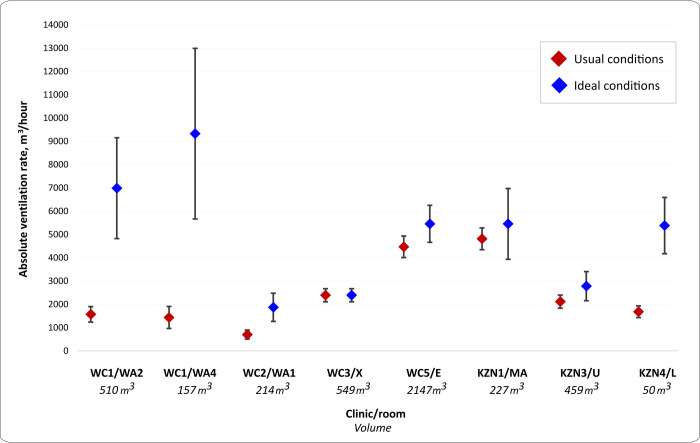
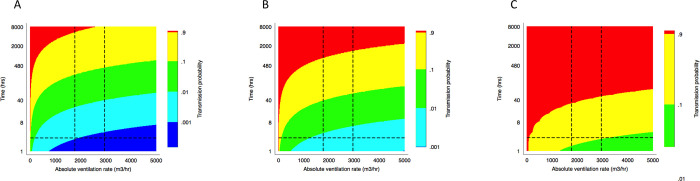
Healthcare facilities are important sites for the transmission of pathogens spread via bioaerosols, such as Mycobacterium tuberculosis. Natural ventilation can play an important role in reducing this transmission. We aimed to measure rates of natural ventilation in clinics in KwaZulu-Natal and Western Cape provinces, South Africa, then use these measurements to estimate Mycobacterium tuberculosis transmission risk. We measured ventilation in clinic spaces using a tracer-gas release method. In spaces where this was not possible, we estimated ventilation using data on indoor and outdoor carbon dioxide levels. Ventilation was measured i) under usual conditions and ii) with all windows and doors fully open. Under various assumptions about infectiousness and duration of exposure, measured absolute ventilation rates were related to risk of Mycobacterium tuberculosis transmission using the Wells-Riley Equation. In 2019, we obtained ventilation measurements in 33 clinical spaces in 10 clinics: 13 consultation rooms, 16 waiting areas and 4 other clinical spaces. Under usual conditions, the absolute ventilation rate was much higher in waiting rooms (median 1769 m3/hr, range 338-4815 m3/hr) than in consultation rooms (median 197 m3/hr, range 0-1451 m3/hr). When compared with usual conditions, fully opening existing doors and windows resulted in a median two-fold increase in ventilation. Using standard assumptions about infectiousness, we estimated that a health worker would have a 24.8% annual risk of becoming infected with Mycobacterium tuberculosis, and that a patient would have an 0.1% risk of becoming infected per visit. Opening existing doors and windows and rearranging patient pathways to preferentially use better ventilated clinic spaces result in important reductions in Mycobacterium tuberculosis transmission risk. However, unless combined with other tuberculosis infection prevention and control interventions, these changes are insufficient to reduce risk to health workers, and other highly exposed individuals, to acceptable levels.


Conflict of interest statement

The authors have declared that no competing interests exist.

Figures

Fig 1
Fig 1. Histograms showing the distribution of temperatures and wind speeds in KwaZulu-Natal and Western Cape during working hours from January 2018–December 2020.
Vertical lines show the mean temperatures and wind speeds on the 12 days when tracer gas release experiments were conducted. A: Temperatures in KwaZulu-Natal; B: Temperatures in Western Cape; C: Wind speeds in KwaZulu-Natal; D: Wind speeds in Western Cape. Vertical lines indicate mean temperature or wind speed at the weather station closest to each clinic during working hours on the day the data were collected. Colour of histograms and vertical lines corresponds to specific weather stations in each province. C: Centigrade; km/h: Kilometres per hour; KZN: KwaZulu-Natal; WC: Western Cape.
Fig 2
Fig 2
Histograms describing the distribution of room volumes (Fig 2A), the number of air changes per hour (Fig 2B) and the absolute ventilation rate (Fig 2C) in the 26 clinical spaces where we conducted tracer gas release experiments. Ventilation rates are described under usual conditions and ideal conditions (all doors and windows fully open).
Fig 3
Fig 3. Box and whisker plots describing the distribution of room volumes in the clinical spaces where we conducted tracer gas release experiments.
Results are disaggregated by province (Fig 3A), room type (Fig 3B), the age of the building (Fig 3C), and clinic location (Fig 3D). Here, the boxes mark the 25th percentile, the 50th percentile (median) and the 75th percentile, with the whiskers marking the upper and lower adjacent values.
Fig 4
Fig 4. Box and whisker plots describing the distribution of the number of air changes per hour in the 26 clinical spaces where we conducted tracer gas release experiments.
Ventilation rates are described under usual conditions and with all doors and windows fully open. Results are disaggregated by province (Fig 4A), room type (Fig 4B), the age of the building (Fig 4C), and clinic location (Fig 4D). Here, the boxes mark the 25th percentile, the 50th percentile (median) and the 75th percentile, with the whiskers marking the upper and lower adjacent values.
Fig 5
Fig 5. Box and whisker plots describing the distribution of the absolute ventilation rate in the 26 clinical spaces where we conducted tracer gas release experiments.
Ventilation rates are described under usual conditions and with all doors and windows fully open. Results are disaggregated by province (Fig 5A), room type (Fig 5B), the age of the building (Fig 5C), and clinic location (Fig 5D). Here, the boxes mark the 25th percentile, the 50th percentile (median) and the 75th percentile, with the whiskers marking the upper and lower adjacent values.
Fig 6
Fig 6. Absolute ventilation rates of eight clinic waiting rooms under usual and ideal conditions, estimated by the rebreathed fraction approach.
Usual conditions = configuration of windows and doors observed when the room was in routine use. Ideal conditions = all windows and doors maximally open. Clinic WC3, room X: Usual conditions the same as ideal conditions. Vertical bars indicate upper and lower estimates of 95% confidence intervals WC: Western Cape; KZN: KwaZulu-Natal; WA2, WA4, WA1, X, E, MA, U, L are the codes for the specific waiting rooms where experiments were performed.
Fig 7
Fig 7
A set of heat maps translating ventilation rate into transmission risk, as estimated using the Wells-Riley equation at 1.25 (A), 8.2 (B) and 226 (C) quanta/hr. The horizontal lines show the median clinic visit duration. The vertical lines show the median absolute ventilation rate in clinic waiting rooms under both usual and ideal conditions.

Similar articles

Cited by

References

    1. Gandhi NR, Moll A, Sturm AW, Pawinski R, Govender T, Lalloo U, et al.. Extensively drug-resistant tuberculosis as a cause of death in patients co-infected with tuberculosis and HIV in a rural area of South Africa. Lancet (London, England). 2006;368: 1575–1580. doi: 10.1016/S0140-6736(06)69573-1 - DOI - PubMed
    1. Bock NN, Jensen PA, Miller B, Nardell E. Tuberculosis Infection Control in Resource‐Limited Settings in the Era of Expanding HIV Care and Treatment. J Infect Dis. 2007;196: S108–S113. doi: 10.1086/518661 - DOI - PubMed
    1. McCreesh N, Grant AD, Yates TA, Karat AS, White RG. Tuberculosis from transmission in clinics in high HIV settings may be far higher than contact data suggest. Int J Tuberc lung Dis. 2020;24: 403–408. doi: 10.5588/ijtld.19.0410 - DOI - PubMed
    1. Mzembe T, Mclean E, Khan PY, Koole O, Sichali L, Mwinuka V, et al.. Risk of Mycobacterium tuberculosis transmission in an antiretroviral therapy clinic. AIDS. 2018;32: 2417–2421. doi: 10.1097/QAD.0000000000002006 - DOI - PMC - PubMed
    1. Bantubani N, Kabera G, Connolly C, Rustomjee R, Reddy T, Cohen T, et al.. High rates of potentially infectious tuberculosis and multidrug-resistant tuberculosis (MDR-TB) among hospital inpatients in KwaZulu Natal, South Africa indicate risk of nosocomial transmission. PLoS One. 2014;9: 1–7. doi: 10.1371/journal.pone.0090868 - DOI - PMC - PubMed

LinkOut - more resources