

Measuring the impact of nonpharmaceutical interventions on the SARS-CoV-2 pandemic at a city level: An agent-based computational modelling study of the City of Natal
- PMID: 36962551
- PMCID: PMC10021960
- DOI: 10.1371/journal.pgph.0000540
Measuring the impact of nonpharmaceutical interventions on the SARS-CoV-2 pandemic at a city level: An agent-based computational modelling study of the City of Natal
Abstract
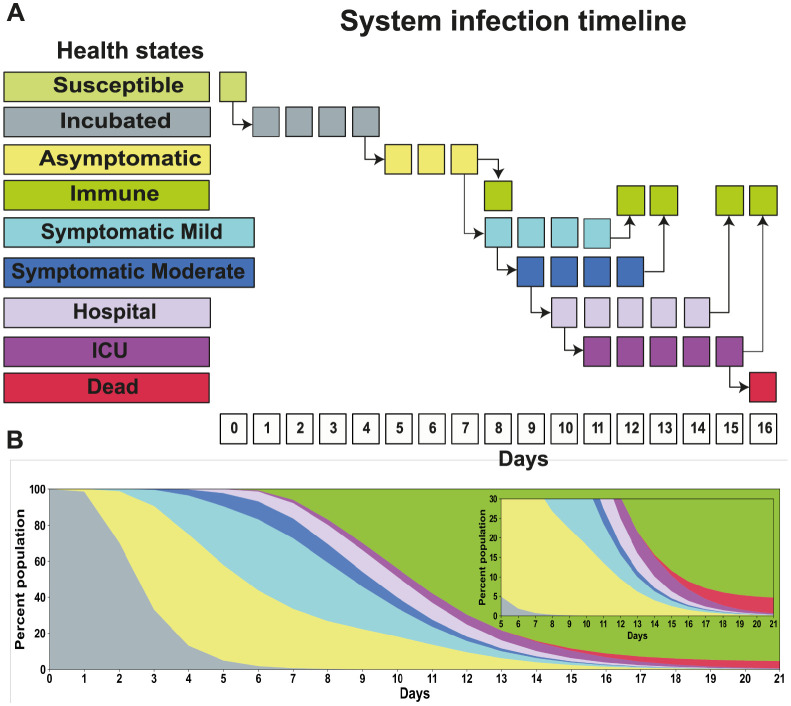
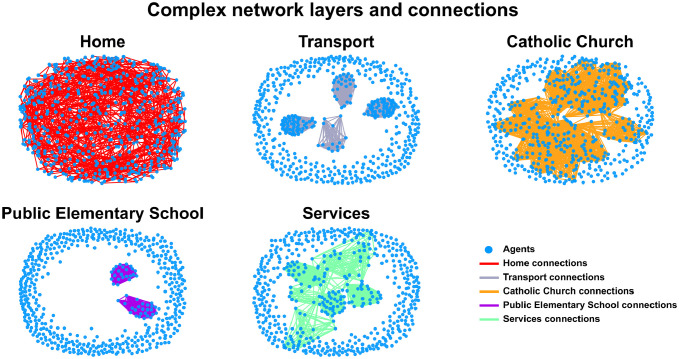
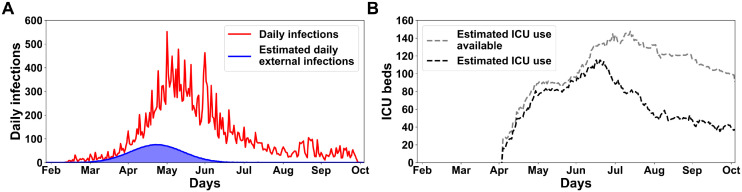
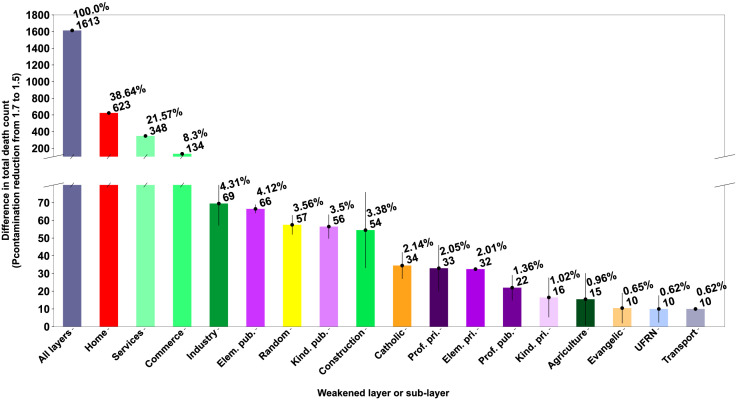
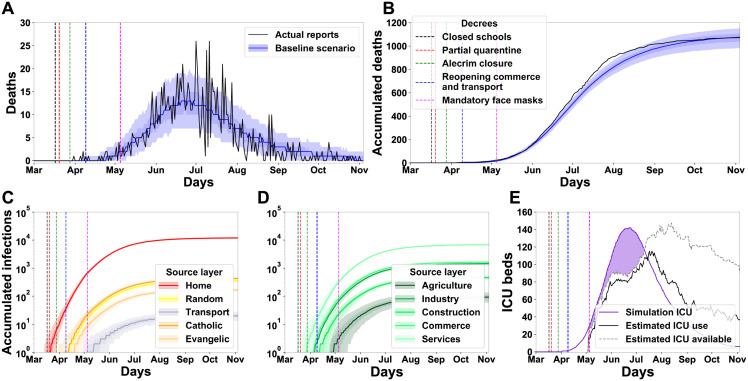
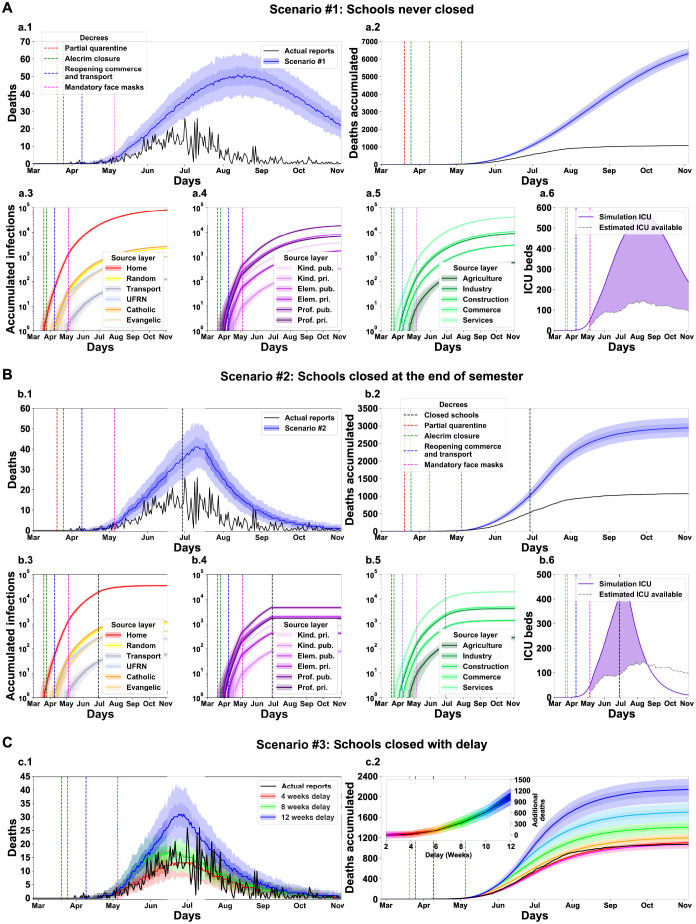
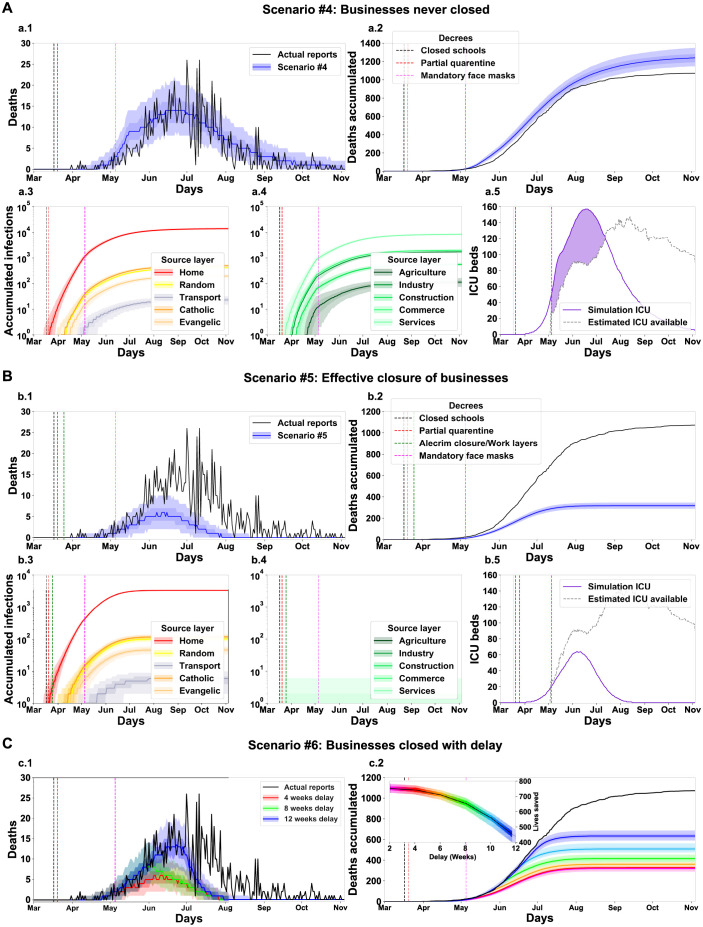
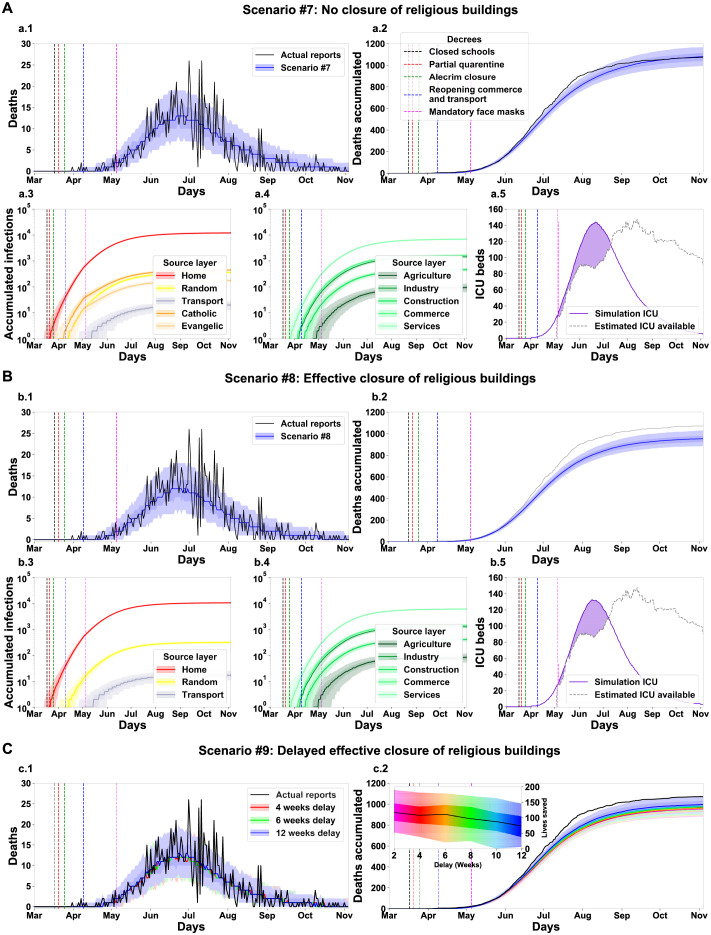
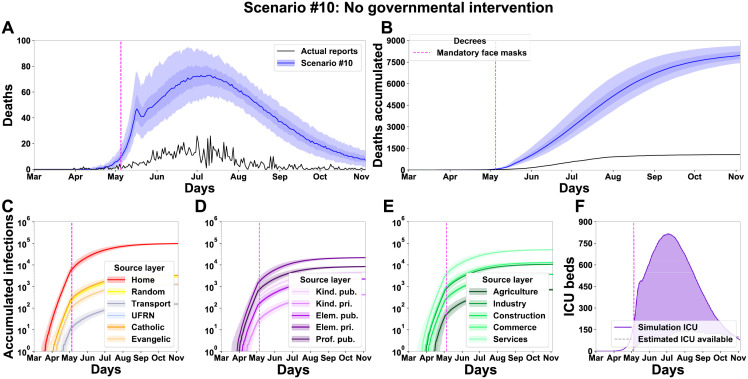
The severe acute respiratory syndrome coronavirus 2 (SARS-CoV-2) pandemic hit almost all cities in Brazil in early 2020 and lasted for several months. Despite the effort of local state and municipal governments, an inhomogeneous nationwide response resulted in a death toll amongst the highest recorded globally. To evaluate the impact of the nonpharmaceutical governmental interventions applied by different cities-such as the closure of schools and businesses in general-in the evolution and epidemic spread of SARS-CoV-2, we constructed a full-sized agent-based epidemiological model adjusted to the singularities of particular cities. The model incorporates detailed demographic information, mobility networks segregated by economic segments, and restricting bills enacted during the pandemic period. As a case study, we analyzed the early response of the City of Natal-a midsized state capital-to the pandemic. Although our results indicate that the government response could be improved, the restrictive mobility acts saved many lives. The simulations show that a detailed analysis of alternative scenarios can inform policymakers about the most relevant measures for similar pandemic surges and help develop future response protocols.
Copyright: © 2022 Lopes et al. This is an open access article distributed under the terms of the Creative Commons Attribution License, which permits unrestricted use, distribution, and reproduction in any medium, provided the original author and source are credited.
Conflict of interest statement
The authors have declared that no competing interests exist.
Figures
Similar articles
-
Nonpharmaceutical interventions implemented by US cities during the 1918-1919 influenza pandemic.JAMA. 2007 Aug 8;298(6):644-54. doi: 10.1001/jama.298.6.644. JAMA. 2007. PMID: 17684187
-
PaCAR: COVID-19 Pandemic Control Decision Making via Large-Scale Agent-Based Modeling and Deep Reinforcement Learning.Med Decis Making. 2022 Nov;42(8):1064-1077. doi: 10.1177/0272989X221107902. Epub 2022 Jul 1. Med Decis Making. 2022. PMID: 35775610
-
SARS-CoV-2 containment was achievable during the early stage of the pandemic: a retrospective modelling study of the Xinfadi outbreak in Beijing.medRxiv [Preprint]. 2022 Sep 14:2022.09.12.22279850. doi: 10.1101/2022.09.12.22279850. medRxiv. 2022. PMID: 36263065 Free PMC article. Preprint.
-
Airborne Transmission of SARS-CoV-2: Evidence and Implications for Engineering Controls.Annu Rev Chem Biomol Eng. 2022 Jun 10;13:123-140. doi: 10.1146/annurev-chembioeng-092220-111631. Epub 2022 Mar 17. Annu Rev Chem Biomol Eng. 2022. PMID: 35300517 Review.
-
City-Scale Agent-Based Simulators for the Study of Non-pharmaceutical Interventions in the Context of the COVID-19 Epidemic: IISc-TIFR COVID-19 City-Scale Simulation Team.J Indian Inst Sci. 2020;100(4):809-847. doi: 10.1007/s41745-020-00211-3. Epub 2020 Nov 12. J Indian Inst Sci. 2020. PMID: 33199946 Free PMC article. Review.
Cited by
-
Second booster dose improves antibody neutralization against BA.1, BA.5 and BQ.1.1 in individuals previously immunized with CoronaVac plus BNT162B2 booster protocol.Front Cell Infect Microbiol. 2024 Apr 4;14:1371695. doi: 10.3389/fcimb.2024.1371695. eCollection 2024. Front Cell Infect Microbiol. 2024. PMID: 38638823 Free PMC article.
-
Response Strategies for Emerging Infectious Diseases: More Efforts Are Needed.Trop Med Infect Dis. 2023 Aug 8;8(8):404. doi: 10.3390/tropicalmed8080404. Trop Med Infect Dis. 2023. PMID: 37624342 Free PMC article.
References
LinkOut - more resources
Full Text Sources
Research Materials
Miscellaneous