Variation in the incidence of type 1 diabetes mellitus in children and adolescents by world region and country income group: A scoping review
- PMID: 36962669
- PMCID: PMC10021400
- DOI: 10.1371/journal.pgph.0001099
Variation in the incidence of type 1 diabetes mellitus in children and adolescents by world region and country income group: A scoping review
Erratum in
-
Correction: Variation in the incidence of type 1 diabetes mellitus in children and adolescents by world region and country income group: A scoping review.PLOS Glob Public Health. 2024 Jun 14;4(6):e0003398. doi: 10.1371/journal.pgph.0003398. eCollection 2024. PLOS Glob Public Health. 2024. PMID: 38875271 Free PMC article.
Abstract
Introduction: Around 18.7 million of the 537 million people with diabetes worldwide live in low-income and middle-income countries (LMIC), where there is also an increase in the number of children, adolescents, and young adults diagnosed with type 1 diabetes (T1D). There are substantial gaps in data in the current understanding of the epidemiological patterns and trends in incidence rates of T1D at the global level.
Methods: We performed a scoping review of published studies that established the incidence of T1D in children, adolescents, and young adults aged 0-25 years at national and sub-national levels using PubMed, Embase and Global Health. Data was analyzed using R programming.
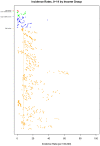
Results: The scoping review identified 237 studies which included T1D incidence estimates from 92 countries, revealing substantial variability in the annual incidence of T1D by age, geographic region, and country-income classification. Highest rates were reported in the 5-9 and 10-14 year age groups than in the 0-4 and 15-19 year age groups, respectively. In the 0-14 year age group, the highest incidence was reported in Northern Europe (23.96 per 100,000), Australia/New Zealand (22.8 per 100,000), and Northern America (18.02 per 100,000), while the lowest was observed in Melanesia, Western Africa, and South America (all < 1 per 100,000). For the 0-19 year age group, the highest incidence was reported in Northern Europe (39.0 per 100,000), Northern America (20.07 per 100,000), and Northern Africa (10.1 per 100,000), while the lowest was observed in Eastern and Western Africa (< 2 per 100,000). Higher incidence rates were observed in high-income countries compared to LMICs. There was a paucity of published studies focusing on determining the incidence of T1D in LMICs.
Conclusion: The review reveals substantial variability in incidence rates of T1D by geographic region, country income group, and age. There is a dearth of information on T1D in LMICs, particularly in sub-Saharan Africa, where incidence remains largely unknown. Investment in population-based registries and longitudinal cohort studies could help improve the current understanding of the epidemiological trends and help inform health policy, resource allocation, and targeted interventions to enhance access to effective, efficient, equitable, and responsive healthcare services.
Copyright: © 2022 Gomber et al. This is an open access article distributed under the terms of the Creative Commons Attribution License, which permits unrestricted use, distribution, and reproduction in any medium, provided the original author and source are credited.
Conflict of interest statement
The authors have declared that no competing interests exist.
Figures


Similar articles
-
Italian cancer figures, report 2012: Cancer in children and adolescents.Epidemiol Prev. 2013 Jan-Feb;37(1 Suppl 1):1-225. Epidemiol Prev. 2013. PMID: 23585445 English, Italian.
-
The Prevalence of Islet Autoantibodies in Children and Adolescents With Type 1 Diabetes Mellitus: A Global Scoping Review.Front Endocrinol (Lausanne). 2022 Feb 3;13:815703. doi: 10.3389/fendo.2022.815703. eCollection 2022. Front Endocrinol (Lausanne). 2022. PMID: 35185797 Free PMC article.
-
The epidemiological landscape of multiple myeloma: a global cancer registry estimate of disease burden, risk factors, and temporal trends.Lancet Haematol. 2022 Sep;9(9):e670-e677. doi: 10.1016/S2352-3026(22)00165-X. Epub 2022 Jul 14. Lancet Haematol. 2022. PMID: 35843248
-
Prevalence and number of children living in institutional care: global, regional, and country estimates.Lancet Child Adolesc Health. 2020 May;4(5):370-377. doi: 10.1016/S2352-4642(20)30022-5. Epub 2020 Mar 6. Lancet Child Adolesc Health. 2020. PMID: 32151317
-
Global, regional, and national burden of type 1 diabetes in adolescents and young adults.Pediatr Res. 2025 Feb;97(2):568-576. doi: 10.1038/s41390-024-03107-5. Epub 2024 Mar 5. Pediatr Res. 2025. PMID: 38443523 Free PMC article.
Cited by
-
Implementation factors of non-communicable disease policies and programmes for children and youth in low-income and middle-income countries: a systematic review.BMJ Paediatr Open. 2024 Jun 3;8(1):e002556. doi: 10.1136/bmjpo-2024-002556. BMJ Paediatr Open. 2024. PMID: 38830723 Free PMC article.
-
Living with and managing type 1 diabetes in humanitarian settings: A qualitative synthesis of lived experience and stakeholder tacit knowledge.PLOS Glob Public Health. 2024 Jun 21;4(6):e0003027. doi: 10.1371/journal.pgph.0003027. eCollection 2024. PLOS Glob Public Health. 2024. PMID: 38905318 Free PMC article.
-
Metabolic and Clinical Outcomes in Type 1 Diabetes in the COVID-19 Pre- and Post-Vaccination Periods in Spain: The COVID-SED1 Study.J Clin Med. 2024 Mar 26;13(7):1922. doi: 10.3390/jcm13071922. J Clin Med. 2024. PMID: 38610687 Free PMC article.
-
The Incidence Trend of Type 1 Diabetes among Children and Adolescents 0-14 Years of Age in the West, South, and Tripoli Regions of Libya (2009-2018).J Clin Res Pediatr Endocrinol. 2023 Nov 22;15(4):356-364. doi: 10.4274/jcrpe.galenos.2023.2023-1-17. Epub 2023 May 23. J Clin Res Pediatr Endocrinol. 2023. PMID: 37218134 Free PMC article.
-
Epidemiological assessment of diabetes mellitus in children of Ukraine during the last 20 years (2002-2021) of peacetime.SAGE Open Med. 2024 Oct 31;12:20503121241255213. doi: 10.1177/20503121241255213. eCollection 2024. SAGE Open Med. 2024. PMID: 39494160 Free PMC article.
References
-
- IDF Diabetes Atlas 2021 | IDF Diabetes Atlas. International Diabetes Federation. IDF Diabetes Atlas, 10th edn. Brussels, Belgium: 2021. https://www.diabetesatlas.org. Accessed January 3, 2022. https://diabetesatlas.org/atlas/tenth-edition/
-
- Saeedi P, Petersohn I, Salpea P, et al.. Global and regional diabetes prevalence estimates for 2019 and projections for 2030 and 2045: Results from the International Diabetes Federation Diabetes Atlas, 9th edition. Diabetes Res Clin Pract. 2019;157:107843. doi: 10.1016/j.diabres.2019.107843 - DOI - PubMed
-
- Global Economic Burden of Diabetes in Adults: Projections From 2015 to 2030 | Diabetes Care. Accessed August 26, 2021. https://care.diabetesjournals.org/content/41/5/963 - PubMed
Publication types
LinkOut - more resources
Full Text Sources
