

A systematic review of Hepatitis B virus (HBV) prevalence and genotypes in Kenya: Data to inform clinical care and health policy
- PMID: 36963057
- PMCID: PMC10022289
- DOI: 10.1371/journal.pgph.0001165
A systematic review of Hepatitis B virus (HBV) prevalence and genotypes in Kenya: Data to inform clinical care and health policy
Abstract
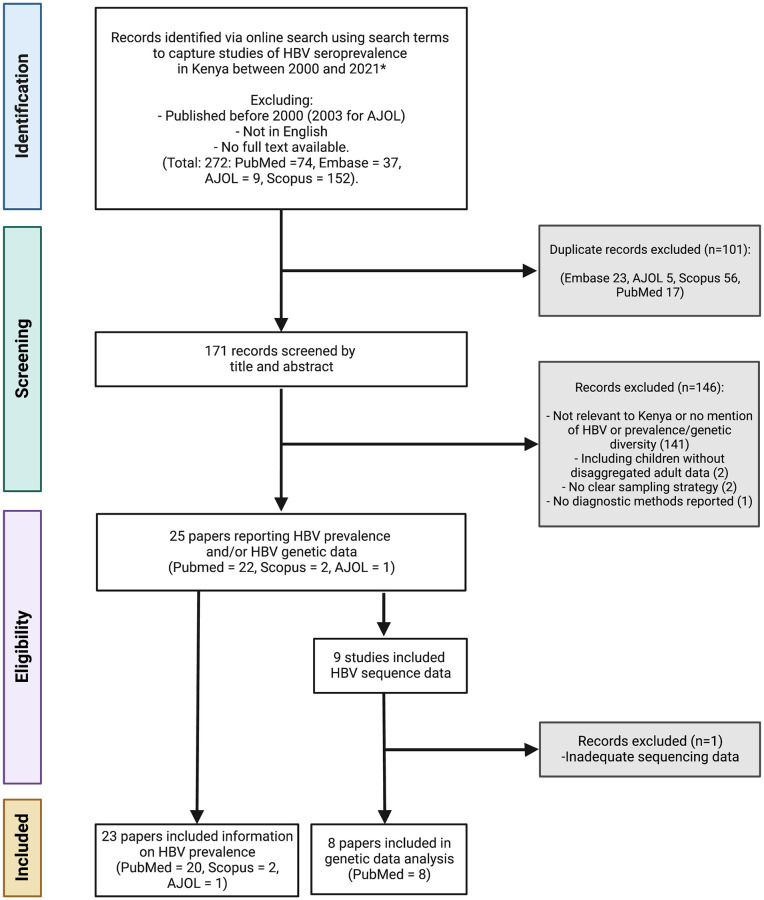
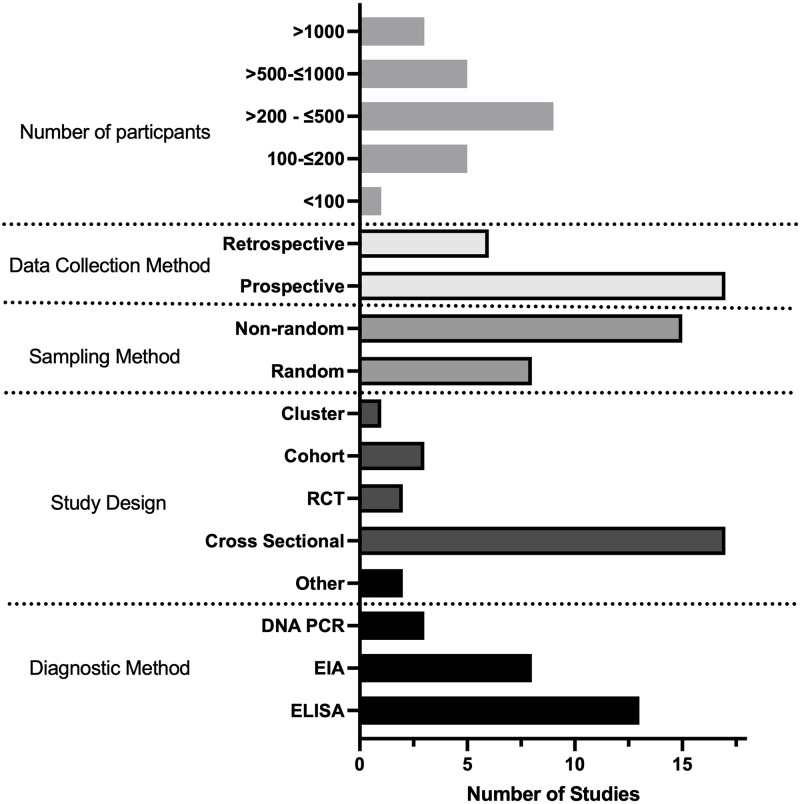
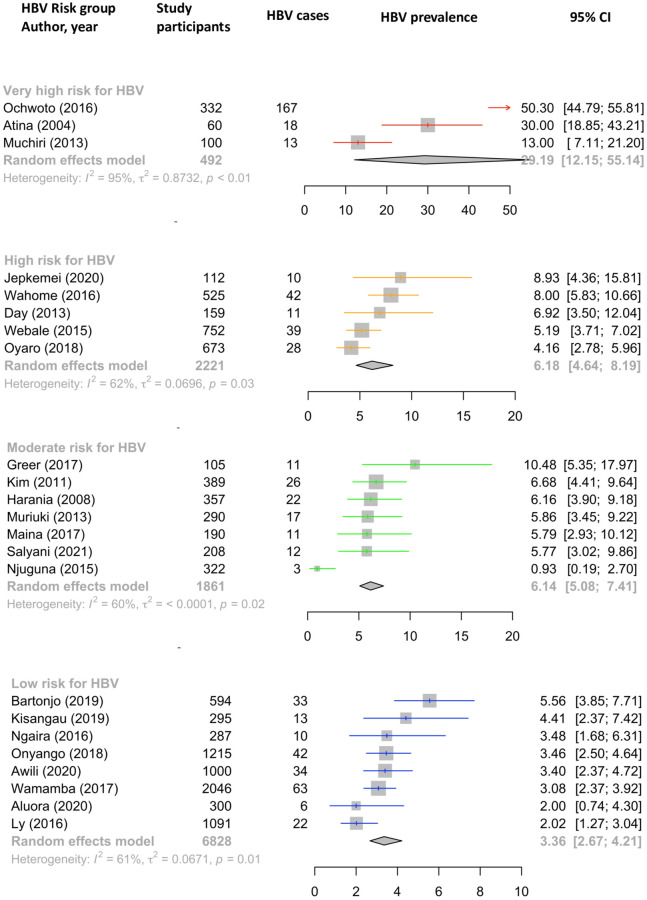
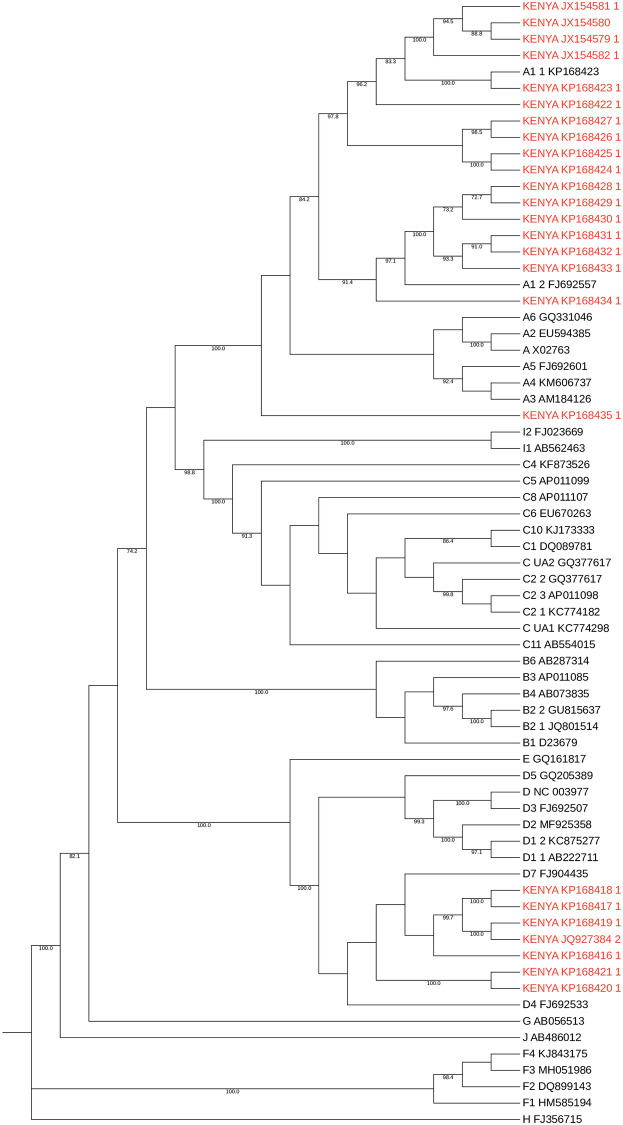
The aim of this systematic review and meta-analysis is to evaluate available prevalence and viral sequencing data representing chronic hepatitis B (CHB) infection in Kenya. More than 20% of the global disease burden from CHB is in Africa, however there is minimal high quality seroprevalence data from individual countries and little viral sequencing data available to represent the continent. We undertook a systematic review of the prevalence and genetic data available for hepatitis B virus (HBV) in Kenya using the Preferred Reporting Items for Systematic Review and Meta-analysis (PRISMA) 2020 checklist. We identified 23 studies reporting HBV prevalence and 8 studies that included HBV genetic data published in English between January 2000 and December 2021. We assessed study quality using the Joanna Briggs Institute critical appraisal checklist. Due to study heterogeneity, we divided the studies to represent low, moderate, high and very high-risk for HBV infection, identifying 8, 7, 5 and 3 studies in these groups, respectively. We calculated pooled HBV prevalence within each group and evaluated available sequencing data. Pooled HBV prevalence was 3.4% (95% CI 2.7-4.2%), 6.1% (95% CI 5.1-7.4%), 6.2% (95% CI 4.64-8.2) and 29.2% (95% CI 12.2-55.1), respectively. Study quality was overall low; only three studies detailed sample size calculation and 17/23 studies were cross sectional. Eight studies included genetic information on HBV, with two undertaking whole genome sequencing. Genotype A accounted for 92% of infections. Other genotypes included genotype D (6%), D/E recombinants (1%) or mixed populations (1%). Drug resistance mutations were reported by two studies. There is an urgent need for more high quality seroprevalence and genetic data to represent HBV in Kenya to underpin improved HBV screening, treatment and prevention in order to support progress towards elimination targets.
Copyright: © 2023 Downs et al. This is an open access article distributed under the terms of the Creative Commons Attribution License, which permits unrestricted use, distribution, and reproduction in any medium, provided the original author and source are credited.
Conflict of interest statement
I have read the journal’s policy and the authors of this manuscript have the following competing interests: CC is partially funded by GlaxoSmithKline. There are no patents, products in development or marketed products associated with this research to declare. This does not alter our adherence to PLOS ONE policies on sharing data and materials.
Figures
References
-
- World Health Organisation. Global hepatitis report, 2017 [Internet]. 2017 [cited 2021 Nov 10]. https://www.who.int/publications/i/item/global-hepatitis-report-2017
-
- WHO. Global health sector strategy on viral hepatitis 2016–2021. Global Hepatitis Programme Department of HIV/AIDS [Internet]. 2016 [cited 2021 Nov 9];(June):56. https://www.who.int/publications/i/item/WHO-HIV-2016.06
-
- Countries Dashboard–CDA Foundation [Internet]. [cited 2022 Feb 7]. https://cdafound.org/polaris-countries-dashboard/
-
- Bartonjo G, Oundo J, Ng’ang’a Z. Prevalence and associated risk factors of transfusion transmissible infections among blood donors at regional blood transfusion center nakuru and tenwek mission hospital, Kenya. Pan African Medical Journal. 2019;34. doi: 10.11604/pamj.2019.34.31.17885 - DOI - PMC - PubMed
LinkOut - more resources
Full Text Sources