. 2023 Apr 4;35(4):695-710.e6.
doi: 10.1016/j.cmet.2023.03.001. Epub 2023 Mar 23.

The Type 2 Diabetes Knowledge Portal: An open access genetic resource dedicated to type 2 diabetes and related traits

Collaborators, Affiliations

The Type 2 Diabetes Knowledge Portal: An open access genetic resource dedicated to type 2 diabetes and related traits

Maria C Costanzo et al. Cell Metab. .

Abstract

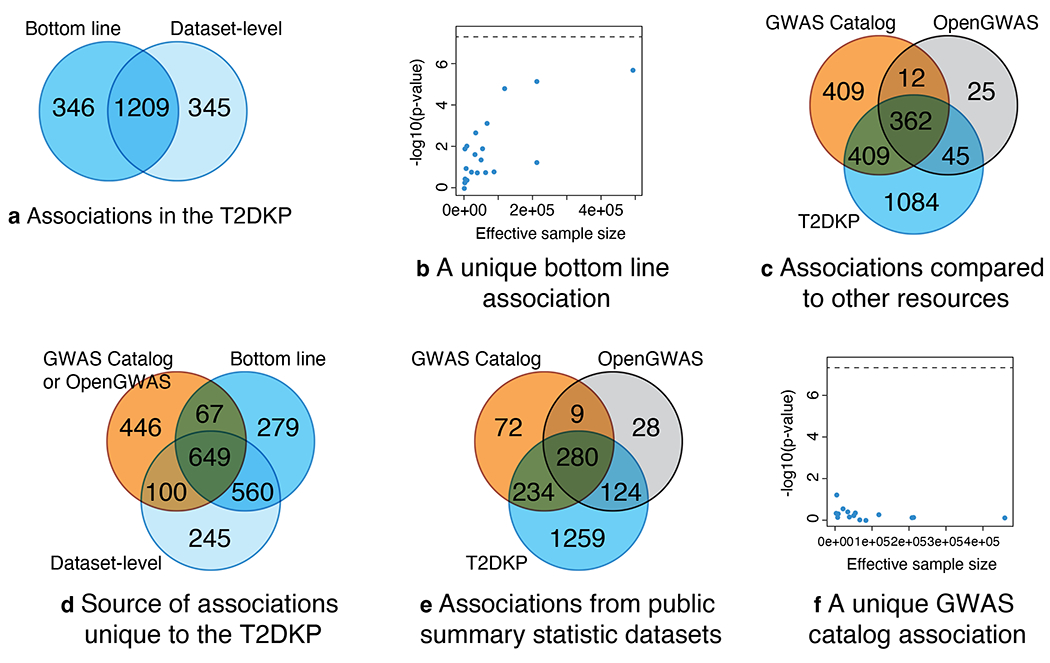
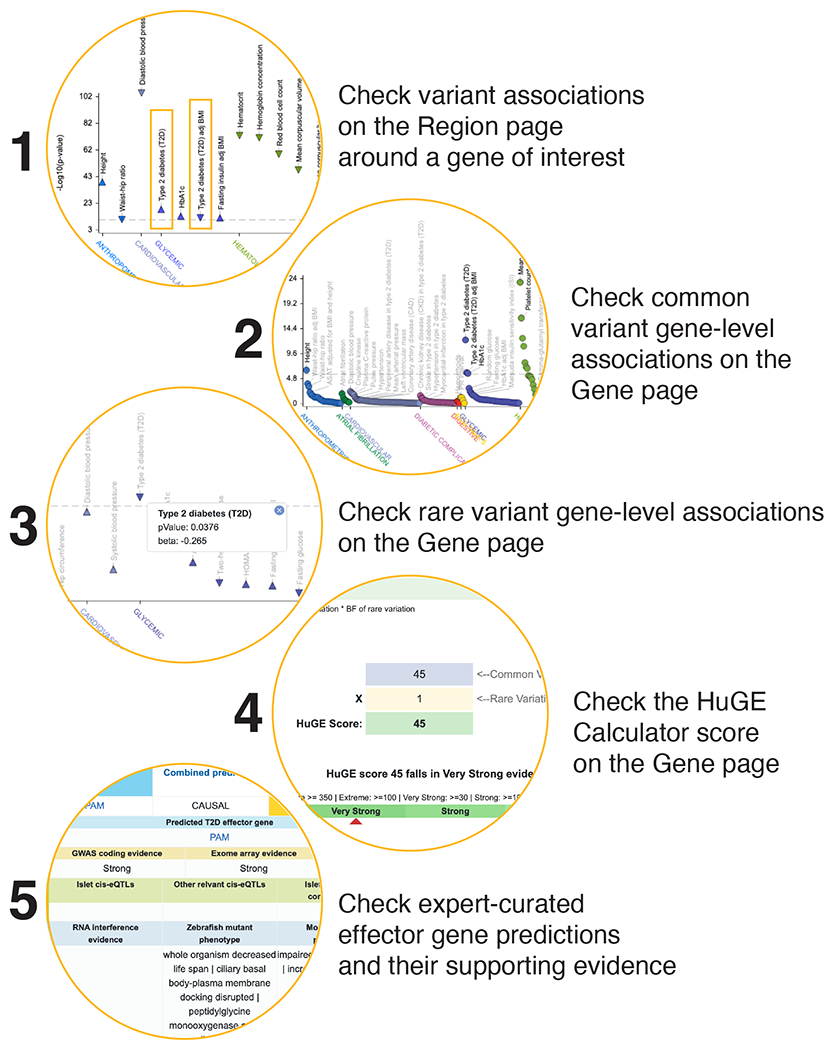
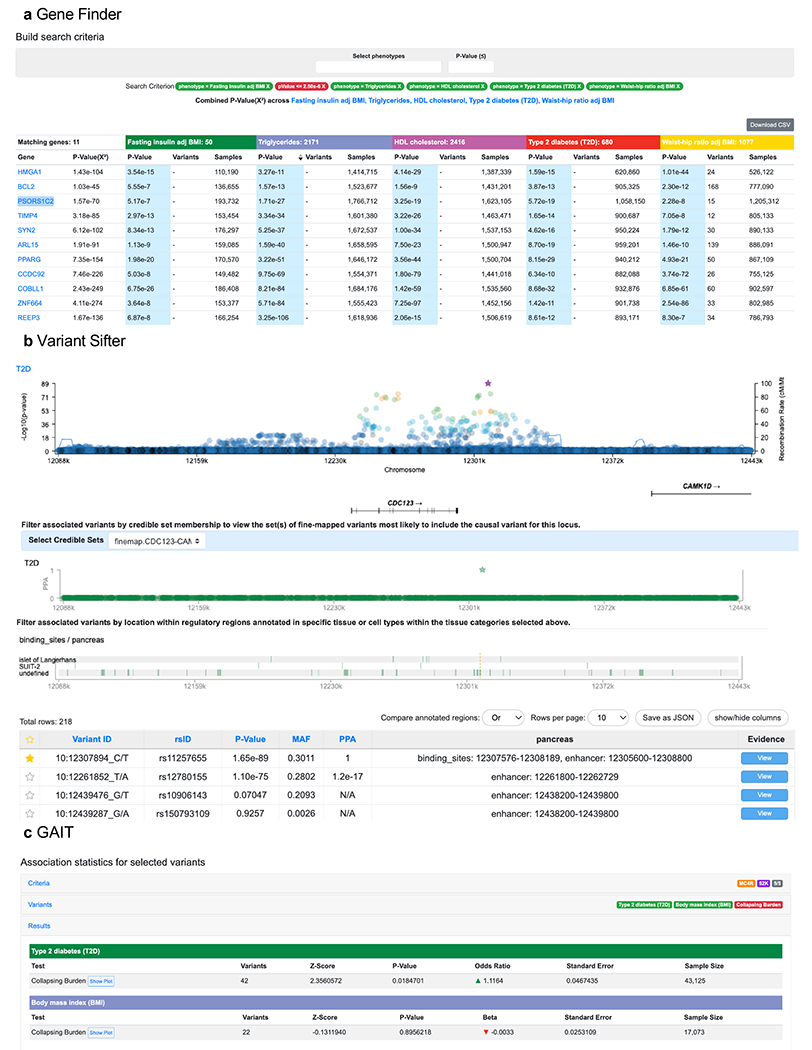
Associations between human genetic variation and clinical phenotypes have become a foundation of biomedical research. Most repositories of these data seek to be disease-agnostic and therefore lack disease-focused views. The Type 2 Diabetes Knowledge Portal (T2DKP) is a public resource of genetic datasets and genomic annotations dedicated to type 2 diabetes (T2D) and related traits. Here, we seek to make the T2DKP more accessible to prospective users and more useful to existing users. First, we evaluate the T2DKP's comprehensiveness by comparing its datasets with those of other repositories. Second, we describe how researchers unfamiliar with human genetic data can begin using and correctly interpreting them via the T2DKP. Third, we describe how existing users can extend their current workflows to use the full suite of tools offered by the T2DKP. We finally discuss the lessons offered by the T2DKP toward the goal of democratizing access to complex disease genetic results.

Keywords: CMDKP; GWAS; T2DKP; data sharing; diabetes; effector genes; genetic associations; genetic support; genomics; portal.


Conflict of interest statement

Declaration of interests A.C. is a Sanofi employee and holds shares and stock options in the company. M.I.M. has served on advisory panels for Pfizer, Novo Nordisk, and Zoe Global; has received honoraria from Merck, Pfizer, Novo Nordisk, and Eli Lilly; and received research funding from Abbvie, Astra Zeneca, Boehringer Ingelheim, Eli Lilly, Janssen, Merck, Novo Nordisk, Pfizer, Roche, Sanofi Aventis, Servier, and Takeda. As of June 2019, M.I.M. is an employee of Genentech and a holder of Roche stock. M.R.M. is a Pfizer employee and holds shares of stock in the company. M.K.T. is an employee and shareholder of Eli Lilly and Company. As of April 2022, P.D. is an employee and stockholder of Regeneron Pharmaceuticals.

Figures

Figure 1:
Figure 1:. Data are collected, processed by the T2DKP platform, and provided through the T2DKP web-interface via a multi-step process.
Data sources for the T2DKP are of varied origin and of multiple Data types. Summary-level genetic datasets are transferred to the Data Coordinating Center (DCC) at the Broad Institute, while genomic annotations are transferred to the Common Metabolic Diseases Genome Atlas (CMDGA). Individual-level genetic datasets are transferred to the DCC or European Bioinformatics Institute (EBI) depending on permissions, and the Analysis Engine processes them through a common analytical workflow to produce summary-level associations. The Data Aggregator then analyzes summary-level genetic datasets and genomic annotations with a series of bioinformatic methods, the results of which are stored in the BioIndex. The Knowledge portals access the data within the BioIndex and present them via a web-interface.
Figure 2:
Figure 2:. Overview of the T2DKP web-interface.
Users of the T2DKP can browse its data by searching for a phenotype, gene, variant, or region. A phenotype search allows views of all associations and datasets for a trait. A region or gene search directs users to a summary of associations within the region (or nearby the gene). Users can select a gene in the region to navigate to the gene page, which shows a summary of gene-level associations for the gene. The variant page shows a summary of associations for a selected variant. The T2DKP also contains a header menu with information about the data in the resource as well as a suite of tools and visualizations.
Figure 3:
Figure 3:. The T2DKP has added datasets and features over time.
On a regular basis, we update the T2DKP with new genetic association datasets (blue dots) for one or more traits (green dots), genomic annotation datasets (purple dots; represented as one-tenth of the actual number), and tools and visualizations (text on bottom of the plot). T2DKP citations (pink dots) have also increased over time. In 2020, the T2DKP received a major update (vertical dashed line) that significantly changed its user interface.
Figure 4:
Figure 4:. The T2DKP emphasizes genetic datasets for T2D and related traits.
We compared genetic datasets for glycemic traits (T2D, fasting glucose, fasting insulin, and HbA1C) in the T2DKP (blue) to those in the GWAS Catalog (orange), the GWAS Atlas (white), and the OpenGWAS project (gray), in October 2022 (Table S2). We conducted an analysis of all datasets and an analysis of datasets newer than 2015 and with >10K samples. a. Considering all datasets in each resource, including those without full summary statistics available, the GWAS Catalog contains the most glycemic trait genetic datasets. b. When only datasets with full summary statistics are considered, the T2DKP contains the most glycemic trait genetic datasets. c. Both the T2DKP and the GWAS Catalog contain datasets unavailable through other resources. d. When only genetic datasets with full summary statistics are considered, the T2DKP contains many more datasets unavailable through other resources. e. Most of the datasets unique to the GWAS Catalog are either from prior to 2015 or contain fewer than 10K samples. f. The T2DKP contains nearly all datasets newer than 2015 and with more than 10K samples. g. Datasets in the T2DKP are predominantly from analyses of European samples, but the ethnic diversity it captures has increased over time.
Figure 5:
Figure 5:. The T2DKP both adds and omits glycemic trait associations relative to the GWAS Catalog.
We evaluated the glycemic trait genetic associations (for T2D, fasting insulin, fasting glucose, and HbA1C) in the T2DKP. We compared genetic associations produced by the T2DKP’s overlap-aware meta-analysis (Bottom line, STAR Methods) to genetic associations reported by individual genetic datasets (Dataset-level). a. The bottom-line and dataset- level associations largely overlap, but the bottom-line analysis both adds and removes associations. b. Associations added by the bottom-line analysis have suggestive associations across many datasets. An example association unique to the bottom-line analysis (rs1000237) has moderate p-values (y-axis) in numerous datasets (points), including nominally significant but not genome-wide significant associations in the datasets with the largest effective sample sizes (x-axis). The horizontal line indicates genome-wide significance. c. Comparing the glycemic trait associations in the T2DKP to those in the GWAS Catalog and the OpenGWAS project, each resource contains unique associations. d. Associations unique to the T2DKP are a mixture of associations due to datasets unique to it (Dataset-level associations) and its bottom-line analysis (Bottom line). e. Most associations unique to the GWAS Catalog are due to studies without summary statistics publicly available. f. An example association unique to the GWAS Catalog (rs10932672) is unsupported by larger, more recent datasets in the T2DKP (points on the right side of the plot).
Figure 6:
Figure 6:. We recommend non-geneticists follow a “genetic support” workflow within the T2DKP.
To evaluate whether human genetic associations support the involvement of a gene of interest in human disease, users can first use the “region page” to see if the gene lies nearby associations (1), then use the “gene page” to view a distillation of these associations into a gene-level score (2) and also view complementary rare variant associations for the gene (3). The HuGE calculator, also on the gene page, summarizes these two gene-level associations into a single score for the gene (4). The T2DKP effector gene list contains a curated set of genes suggested from genome-wide analyses to be involved in disease (5). Table S4 contains information on these and other modules of the T2DKP.
Figure 7:
Figure 7:. The T2DKP enables exploratory and interactive analyses for the genetic expert user.
a. A Gene Finder search for genes associated with Fasting Insulin adjusted for BMI, Triglycerides, HDL cholesterol, T2D, and Waist-hip ratio adjusted for BMI returns 11 genes that have MAGMA p<2.5×10⁻⁶ for each trait. These genes were significantly enriched for adipose tissue-specific expression (Figure S2ef) b. A query of ‘CDC123’ on the Variant Sifter shows a regional plot of the T2D association. Tracks below the plot show the locations of variants in the credible set and genomic annotations for transcription factor binding sites within the pancreas. A table lists the variants within the credible set that overlap the displayed genomic annotations. The actual Variant Sifter page contains more visualizations than those shown in the figure; because of space limitations we have spliced the LocusZoom plot, credible sets plot, annotations plot, and variant table together. c. An association analysis in GAIT between rare MC4R variants (in the 5/5 mask) and T2D shows the impact of p.I269N on the association signal – after removing the variant from the analysis, the T2D association p-value is increased by nine orders of magnitude and the BMI association is ablated. Table S4 contains information on these and other modules of the T2DKP.

References

    1. Claussnitzer M, Cho JH, Collins R, Cox NJ, Dermitzakis ET, Hurles ME, Kathiresan S, Kenny EE, Lindgren CM, MacArthur DG, et al. (2020). A brief history of human disease genetics. Nature 577, 179–189. 10.1038/s41586-019-1879-7. - DOI - PMC - PubMed
    1. Zhang Y, Qi G, Park J-H, and Chatterjee N (2018). Estimation of complex effect-size distributions using summary-level statistics from genome-wide association studies across 32 complex traits. Nat. Genet 50, 1318–1326. 10.1038/s41588-018-0193-x. - DOI - PubMed
    1. Vilhjálmsson BJ, Yang J, Finucane HK, Gusev A, Lindström S, Ripke S, Genovese G, Loh P-R, Bhatia G, Do R, et al. (2015). Modeling Linkage Disequilibrium Increases Accuracy of Polygenic Risk Scores. Am. J. Hum. Genet 97, 576–592. 10.1016/j.ajhg.2015.09.001. - DOI - PMC - PubMed
    1. Davey Smith G, and Hemani G (2014). Mendelian randomization: genetic anchors for causal inference in epidemiological studies. Hum. Mol. Genet 23, R89–R98. 10.1093/hmg/ddu328. - DOI - PMC - PubMed
    1. King EA, Davis JW, and Degner JF (2019). Are drug targets with genetic support twice as likely to be approved? Revised estimates of the impact of genetic support for drug mechanisms on the probability of drug approval.: Supplementary Methods And Results (Genetics) 10.1101/513945. - DOI - PMC - PubMed

Publication types