. 2023 Apr 19;10(4):ENEURO.0240-22.2023.
doi: 10.1523/ENEURO.0240-22.2023. Print 2023 Apr.

Deciding While Acting-Mid-Movement Decisions Are More Strongly Affected by Action Probability than Reward Amount

Affiliations

Deciding While Acting-Mid-Movement Decisions Are More Strongly Affected by Action Probability than Reward Amount

Philipp Ulbrich et al. eNeuro. .

Abstract

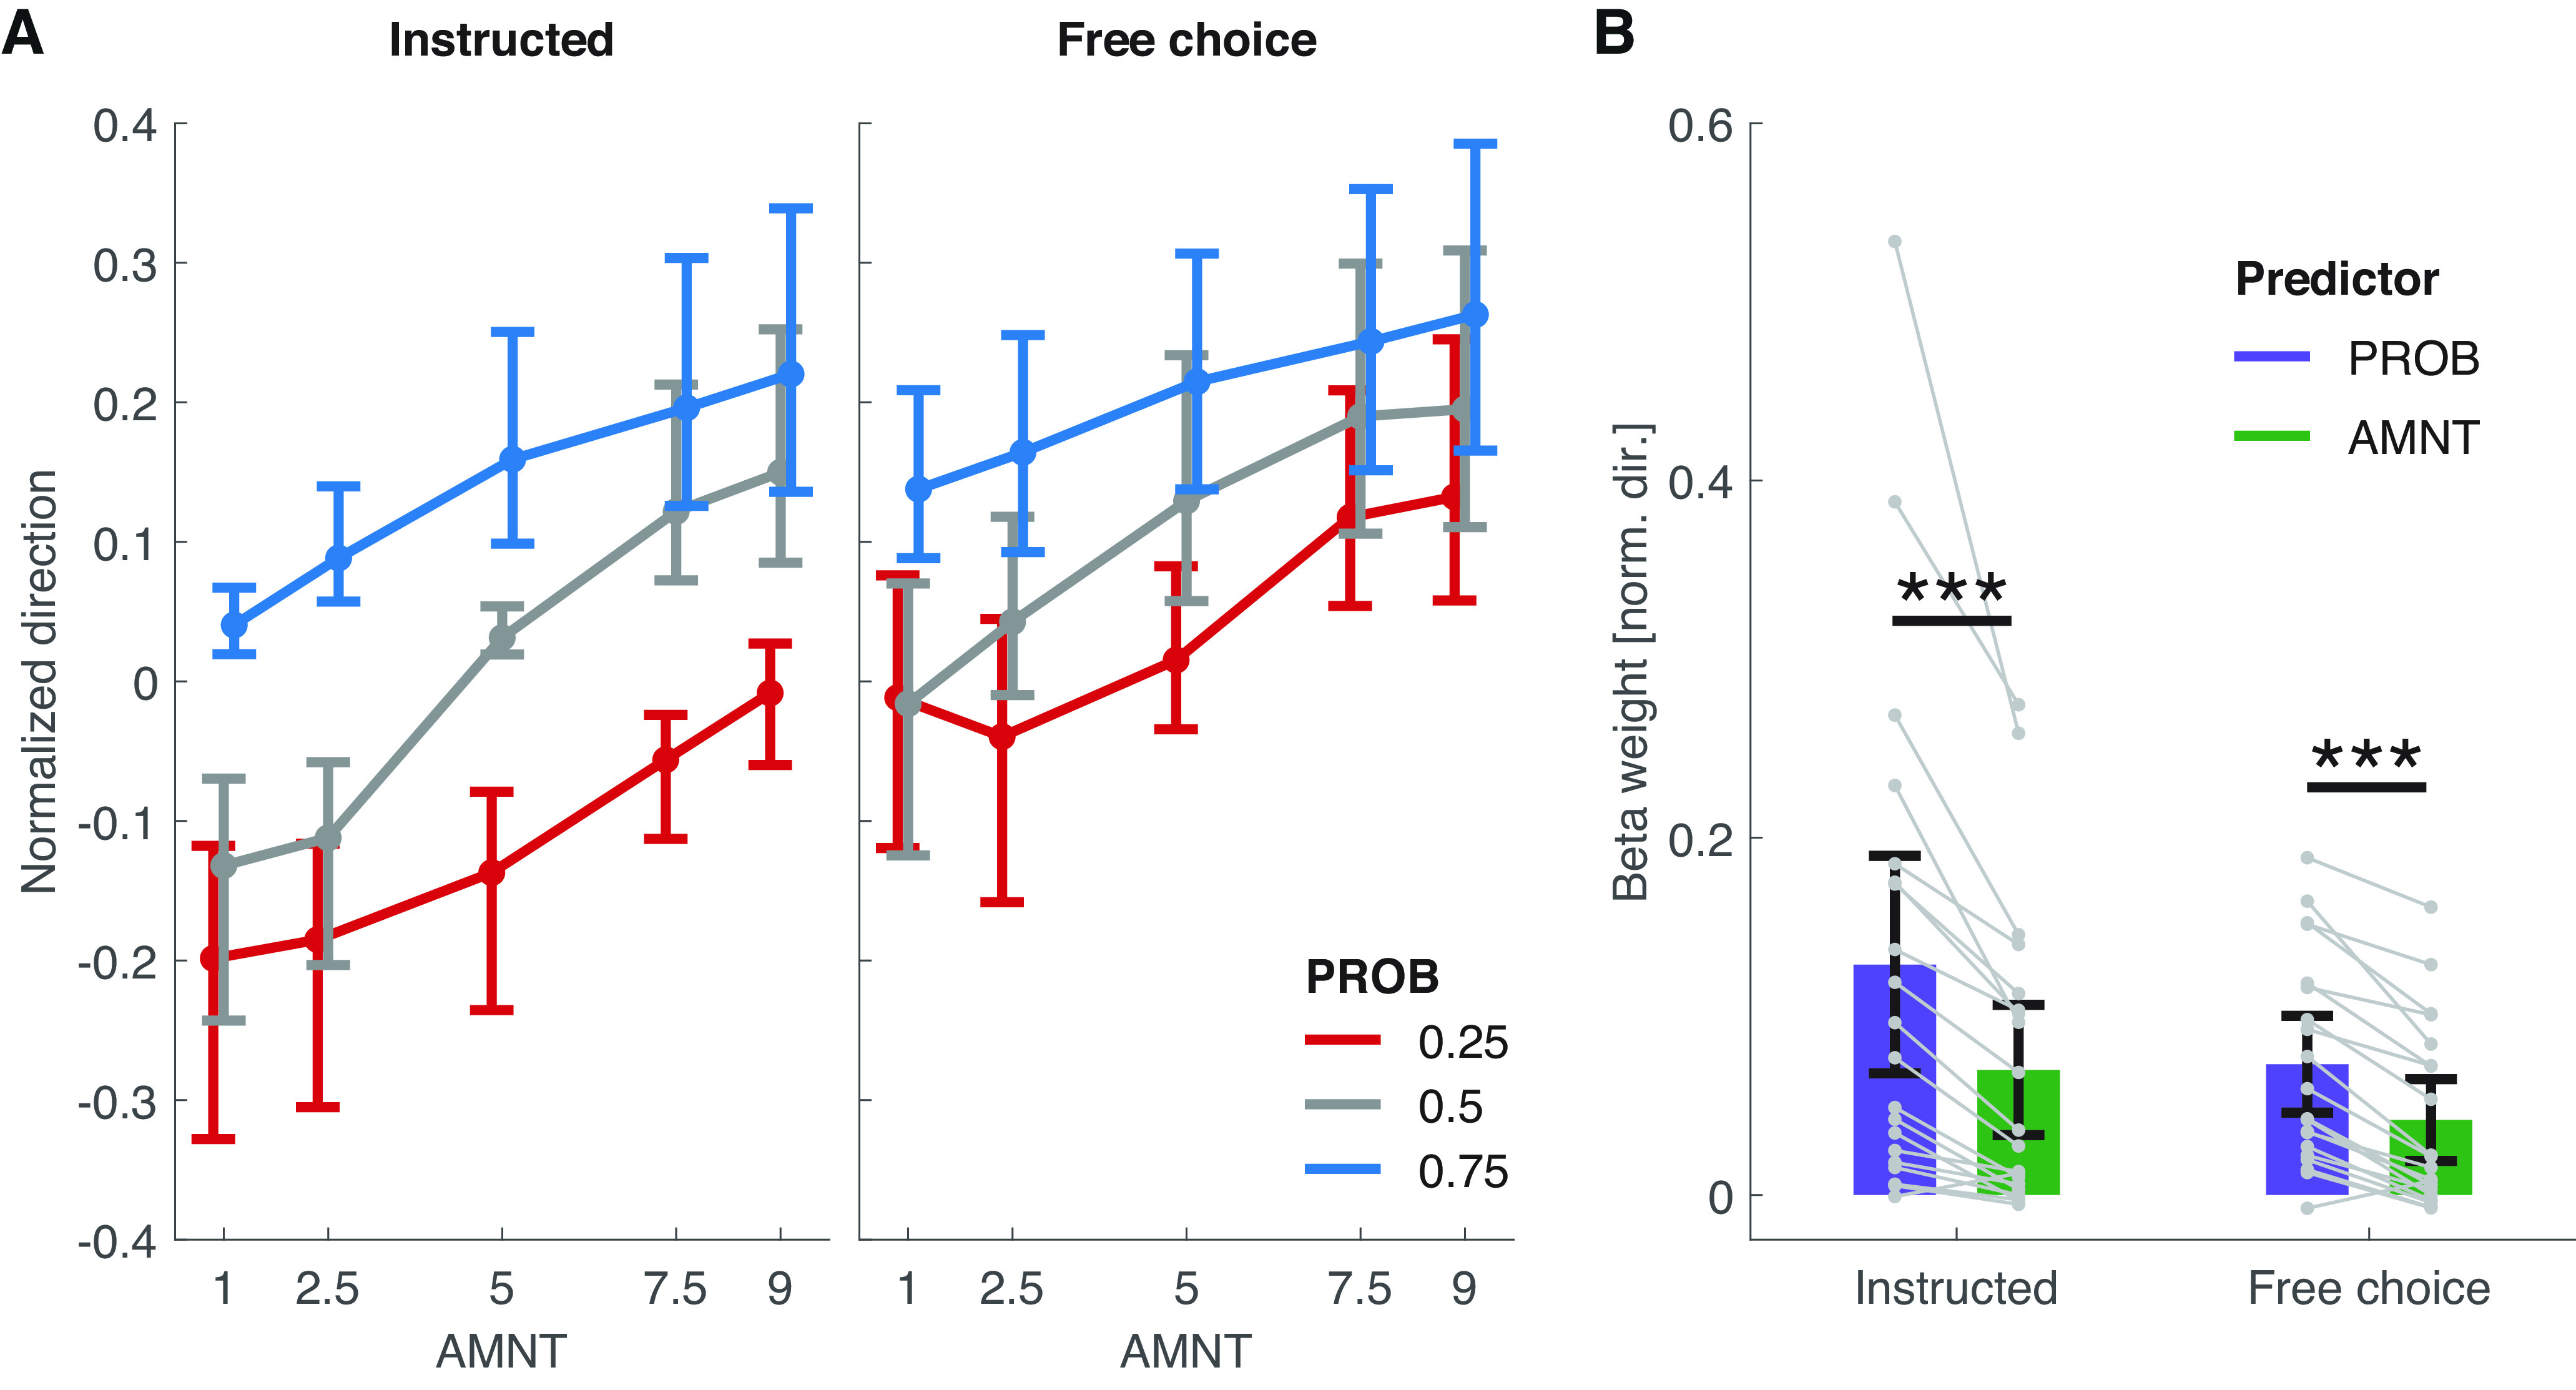
When deciding while acting, such as sequentially selecting targets during naturalistic foraging, movement trajectories reveal the dynamics of the unfolding decision process. Ongoing and planned actions may impact decisions in these situations in addition to expected reward outcomes. Here, we test how strongly humans weigh and how fast they integrate individual constituents of expected value, namely the prior probability (PROB) of an action and the prior expected reward amount (AMNT) associated with an action, when deciding based on the combination of both together during an ongoing movement. Unlike other decision-making studies, we focus on PROB and AMNT priors, and not final evidence, in that correct actions were either instructed or could be chosen freely. This means, there was no decision-making under risk. We show that both priors gradually influence movement trajectories already before mid-movement instructions of the correct target and bias free-choice behavior. These effects were consistently stronger for PROB compared with AMNT priors. Participants biased their movements toward a high-PROB target, committed to it faster when instructed or freely chosen, and chose it more frequently even when it was associated with a lower AMNT prior than the alternative option. Despite these differences in effect magnitude, the time course of the effect of both priors on movement direction was highly similar. We conclude that prior action probability, and hence the associated possibility to plan actions accordingly, has higher behavioral relevance than prior action value for decisions that are expressed by adjusting already ongoing movements.

Keywords: action; deciding while acting; decision-making; psychophysics; reaching.


Conflict of interest statement

The authors declare no competing financial interests.

Figures

Figure 1.
Figure 1.
Apparatus, stimuli, behavioral paradigm. A, Subjects performed reaching movements using a parallel haptic manipulator and perceived all visual stimuli as projected into the manipulator workspace via a stereoscopic 3D-AR setup. B, Visual stimuli (drawn to scale). The position of the starting (bottom) and target (top) spheres defined a stimulus plane, which we describe using the terms “lateral deviation” (corresponds to x-axis) and “distance to targets” (corresponds to y-axis). The PROB/AMNT pre-cues (colored bars) and the instruction cue (colored disk) were set on a parallel stimulus plane 20 mm behind the previously described plane. C, Viewing angle of the stimulus planes. The monitors and mirrors of the AR setup were angled by 30° relative to the vertical to lower the visual stimuli into the manipulator workspace. D, Example trial structure. Participants performed reaching movements toward two potential targets and were either instructed mid-movement to reach toward a specific target (instructed trial, two-thirds of all trials) or were allowed to freely choose between the targets (free-choice trial, one-third of all trials). Participants initiated a trial by moving the yellow cursor into the starting sphere and keeping it there for the duration of the then initiated Hold fixation period. Following this period, an auditory go-cue signaled the participants to quickly initiate their movement toward the array of targets (Leave fixation). Starting before the Hold fixation and from the start of the Leave fixation periods, respectively, two pre-cues were displayed. The PROB precue (here: precue A) informed participants about the relative probability with which either target was instructed in case of an instructed trial (here: left/right = 75%/25%). The AMNT precue (here: precue B) informed participants about the reward amount that was obtained on successfully following the instruction (here: left/right = 2.5/7.5 tokens). Starting the movement during the Leave fixation period initiates the Move/choose period. Throughout the study, movement times are defined relative to the start of the Move/choose period. During the Move/choose period, after moving away from the starting sphere by >70 mm, the instruction cue either instructed the participants to reach to either the left or right target (here: left) or to freely choose between the targets. Upon reaching the instructed target/freely chosen target, the participants received feedback with regard to the number of reward tokens they obtained (Target acquired). As free choices were value neutral, reaching a freely chosen target always yielded zero reward tokens regardless of the AMNT precue. In the actual experiment, the stimuli were presented on a black background, and the stimuli indicating the value cue type and the free-choice cue were white. See Extended Data Table 1-1 for all possible PROB and AMNT levels and their frequencies of occurrence per experimental session.
Figure 2.
Figure 2.
Time-continuous multiple regression results. A, Left, center, Grand average normalized direction (1 = aimed at chosen target) as a function of movement time (i.e., the time elapsed since movement initiation, colored top curves; Extended Data Fig. 2-1, per-participant data) and average per-subject percentage of trials for which there is data at each given movement time stamp (black curve at bottom). Right, Computation of the normalized movement direction from the trajectories (see also Materials and Methods). B, PROB and AMNT TCMR β weights. Horizontal bars represent movement time segments at which these β weights were significantly different from zero (determined via ClusP test; α = 0.05). C, Top, Mean per-participant difference between the PROB and AMNT β curves from B. Bottom, Same difference but after normalizing the per-participant curves to peak strength = 1. Horizontal bars represent a significant difference from zero as in B. Error bands in B and C represent the 95% confidence intervals of the mean (Extended Data Table 2-1, full ClusP test results for B and C). D, Mean ± bootstrapped (N = 2000) 95% confidence intervals of the per-subject TCMR β curve peak times (in terms of time elapsed since movement initiation) and peak strength. n.s., Not significant. *p < 0.05, **p < 0.01, ***p < 0.001 for paired t tests. Extended Data Figure 2-2, per-participant data underlying B–D, Exentended Data Figure 2-3, supplementary peak time and peak strength comparisons between PROB and AMNT, Extended Data Table 2-2, full peak time and peak strength comparison results for D and Extended Data Figure 2-3.
Figure 3
Figure 3
Early biases. A, Total mean ± bootstrapped (N = 2000) 95% confidence intervals of the per-participant mean values of the early biases (normalized movement direction 50 ms post-instruction/free-choice cue onset). Extended Data Figure 3-1, per-participant data. B, β weights resulting from fitting M2 to the data from A. Bars and error bars represent the fixed effects of PROB and AMNT and their 95% confidence intervals; gray points and lines represent the per-subject random effects of PROB and AMNT. Significance marker conventions are as in Figure 2D (Extended Data Table 3-1, full M2 results).
Figure 4.
Figure 4.
Time points of overt commitment. A, Total mean ± bootstrapped (N = 2000) 95% confidence intervals of the per-participant mean values of the TOCs (Extended Data Fig. 4-1, per-participant data). B, β weights resulting from fitting M2 to the data from A. Bars and error bars represent the fixed effects of PROB and AMNT and their 95% confidence intervals; gray points and lines represent the per-subject random effects of PROB and AMNT. Significance marker conventions are as in Figure 2D (Extended Data Table 4-1, full M2 results).
Figure 5.
Figure 5.
Choice preferences. A, Orange, mean per-participant proportions of choosing the high-PROB (0.75) target over the low-PROB (0.25) target separately for each possible AMNT level associated with the high-PROB target. Magenta, Proportions of choosing the high-AMNT (7.5 or 9) target over the low-AMNT (2.5 or 1) target at PROB = 0.5. Blue, Proportions of choosing the right target in the PROB/AMNT = 0.5:0.5/5:5 baseline condition. Note that the proportions of choosing a high-AMNT target associated with PROB = 0.25 or PROB = 0.75 are included as part of the high-PROB choice proportions. The PROB/AMNT 0.25/7.5 and 0.25/9 choice proportions equal 1 minus the 0.75/2.5 and 0.75/1 choice proportions, respectively. Error bars are bootstrapped (N = 2000) 95% confidence intervals of the mean. Gray points and lines represent single-participant (N = 20) choice proportions (Extended Data Table 5-1, M3 and M4 results on the choice proportions displayed here). B, Top, Proportions of choosing the high-PROB over the low-PROB target as a function of the normalized movement direction relative to the high/low-PROB target (1 = movement aimed at high-PROB target, −1 movement aimed at low-PROB target). Each panel represents one of the five possible AMNT values that were paired with the high-PROB target. The normalized direction was calculated 50 ms after the onset of the free-choice cue. Colored lines represent the marginal (i.e., fixed effects) M5 fits and their 95% confidence intervals. Gray lines represent the per-participant (N = 20) conditional (i.e., random effects) fits. Histograms represent the mean per-participant proportion of trials in each normalized direction bin (bin width, 0.2; for illustrative purpose only, M5 was fitted to the continuous normalized movement direction data). Bottom center, Proportion of right-hand choices as a function of the normalized movement direction (50 ms after instruction cue onset) relative to the right (normalized direction, 1) and left (normalized direction = −1) target in the PROB/AMNT = 0.5:0.5/5:5 baseline condition. Bottom right, Proportions of choosing the high-AMNT targets as a function of the normalized movement direction (50 ms after instruction cue onset) relative to the high-AMNT (normalized direction, 1) and low-AMNT (normalized direction, −1) targets (Extended Data Table 5-2, full M5 results).

References

    1. Alhussein L, Smith MA (2021) Motor planning under uncertainty. Elife 10:e67019. 10.7554/eLife.67019 - DOI - PMC - PubMed
    1. Atiya NAA, Zgonnikov A, Hora DO, Schoemann M, Scherbaum S, Wong-Lin K (2020) Changes-of-mind in the absence of new post- decision evidence. PLoS Comput Biol 16:e1007149. 10.1371/journal.pcbi.1007149 - DOI - PMC - PubMed
    1. Brenner E, Smeets JBJ (1997) Fast responses of the human hand to changes in target position. J Mot Behav 29:297–310. 10.1080/00222899709600017 - DOI - PubMed
    1. Burk D, Ingram JN, Franklin DW, Shadlen MN, Wolpert DM (2014) Motor effort alters changes of mind in sensorimotor decision making. PLoS One 9:e92681. 10.1371/journal.pone.0092681 - DOI - PMC - PubMed
    1. Carroll TJ, Mcnamee D, Ingram JN, Wolpert DM (2019) Rapid visuomotor responses reflect value-based decisions. J Neurosci 39:3906–3920. 10.1523/JNEUROSCI.1934-18.2019 - DOI - PMC - PubMed

Publication types

LinkOut - more resources