. 2023 Mar 24;14(1):1648.
doi: 10.1038/s41467-023-37165-w.

Alkalinity responses to climate warming destabilise the Earth's thermostat

Affiliations

Alkalinity responses to climate warming destabilise the Earth's thermostat

Nele Lehmann et al. Nat Commun. .

Abstract

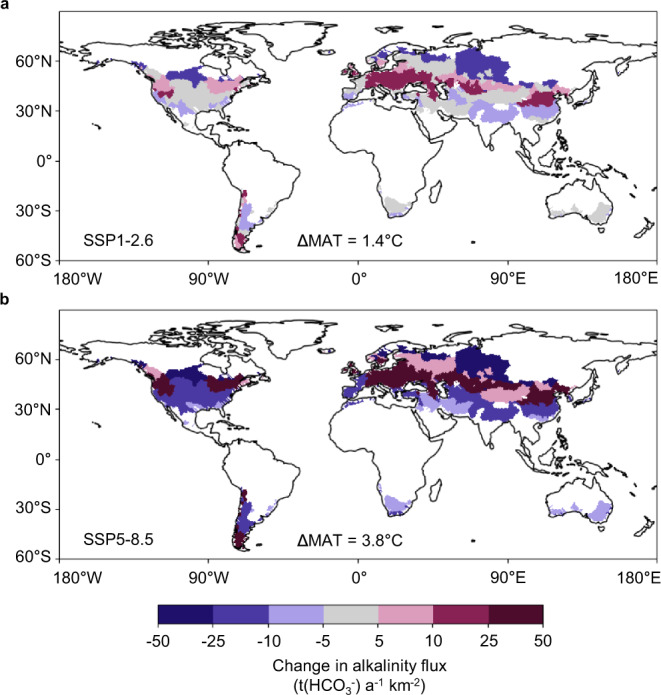
Alkalinity generation from rock weathering modulates Earth's climate at geological time scales. Although lithology is thought to dominantly control alkalinity generation globally, the role of other first-order controls appears elusive. Particularly challenging remains the discrimination of climatic and erosional influences. Based on global observations, here we uncover the role of erosion rate in governing riverine alkalinity, accompanied by areal proportion of carbonate, mean annual temperature, catchment area, and soil regolith thickness. We show that the weathering flux to the ocean will be significantly altered by climate warming as early as 2100, by up to 68% depending on the environmental conditions, constituting a sudden feedback of ocean CO2 sequestration to climate. Interestingly, warming under a low-emissions scenario will reduce terrestrial alkalinity flux from mid-latitudes (-1.6 t(bicarbonate) a-1 km-2) until the end of the century, resulting in a reduction in CO2 sequestration, but an increase (+0.5 t(bicarbonate) a-1 km-2) from mid-latitudes is likely under a high-emissions scenario, yielding an additional CO2 sink.


Conflict of interest statement

The authors declare no competing interests.

Figures

Fig. 1
Fig. 1. Erosion rate, areal carbonate proportion, and temperature are first-order controls on catchment-scale alkalinity concentrations.
a World map with sampling locations. Catchments within the limits of the efficient erosion rate regime, characterized by erosion rates of ~10–1000 mm ka−1 (see b), are highlighted. b High runoff-normalized alkalinity concentrations are found in the efficient erosion rate regime (gray-shaded box). A high proportion of areal carbonate and a temperate climate (MAT: 5–15 °C) promote high-alkalinity concentrations, as shown in the excerpts for selected European catchments: c Black Forest, Germany, where a high areal proportion of carbonate is associated with high riverine alkalinity; and d Switzerland and northern Italy, where catchments with MATs of 5–15 °C show high-alkalinity concentrations. MAT: mean annual temperature. The background map in (a) was created in ArcGIS Pro with data from Living Atlas, Natural Earth, and Esri’s country and water shapes. The background maps in (c) and (d) are from Esri, DeLorme, Natural Vue, and GEBCO.
Fig. 2
Fig. 2. Runoff-normalized alkalinity concentration in catchments with different MAT.
a The fitted line shows the model output as a function of MAT (mean annual temperature); the line is dotted for MAT <0 °C and 20 °C, indicating that these temperatures were not included into the quantitative interpretation of the influence of MAT on normalized alkalinity concentration. The other covariates are kept constant (mean global coverage by carbonates (sc + sm) = 22%, erosion rate = 100 mm ka−1, catchment area = 1000 km2, soil regolith thickness = 15 m). b MAT of catchments globally, derived from data provided by the ISIMIP project based on the GFDL-ESM4 Model. See also Supplementary Fig. 2b. The background map with the continent outlines in (b) is from naturalearthdata.com.
Fig. 3
Fig. 3. Alkalinity flux impacted by increased temperatures.
Simulated historical data (1980–2009) are contrasted with simulated future data affected by climate warming according to (a, c, e) a low (SSP1-2.6) emissions scenario and (b, d, f) a high (SSP5-8.5) emissions scenario (2070–2099). a, b Difference in MAT; c, d Relative change in alkalinity flux due to change in MAT. The schematic evolution of runoff normalized alkalinity concentration according to our model (from Fig. 2a) is shown for a better understanding. Thick arrows indicate that weathering responds more drastically to more rapidly rising temperatures than to less rapidly rising temperatures, indicated by the thin arrows; and e, f Absolute change in alkalinity flux due to change in MAT. For the calculation of the absolute alkalinity flux as specific mass flux, a molar mass of 61.02 g mol−1 for bicarbonate (HCO3) was used, as at pH 7–9, the alkalinity concentration is approximately equal to the bicarbonate concentration,. Boxes indicate 0.25 and 0.75 quantiles, and black diamonds show the arithmetic mean. Temperature projections are provided by the ISIMIP project based on the GFDL-ESM4 data. River discharge was simulated using the HydroPy global hydrology model. SSP shared socioeconomic pathway, MAT mean annual temperature.
Fig. 4
Fig. 4. Projected change in alkalinity flux due to climate warming.
Colors indicate the projected absolute change in alkalinity flux of catchments per temperature band for the historical temperature range of 0.0–20.0 °C, globally (corresponds to a land surface area of 44,506,993 km2), under scenarios a SSP1-2.6 and b SSP5-8.5. The mean change in mean annual temperature (ΔMAT) under SSP1-2.6 and SSP5-8.5 (SSP: shared socioeconomic pathway) until the year 2100 are projected to be 1.4 and 3.8 °C, respectively. Catchment areas in white were excluded from the analysis, since their historical MATs were lower or higher than the temperature range of 0.0–20.0 °C. For the calculation of the absolute alkalinity flux as specific mass flux, a molar mass of 61.02 g mol−1 for bicarbonate (HCO3) was used, as at pH 7–9, the alkalinity concentration is approximately equal to the bicarbonate concentration,. The background maps with the continent outlines in (a) and (b) are from naturalearthdata.com.

References

    1. Berner RA, Lasaga AC, Garrels RM. The carbonate-silicate geochemical cycle and its effect on atmospheric carbon dioxide over the past 100 million years. Am. J. Sci. 1983;283:641–683. doi: 10.2475/ajs.283.7.641. - DOI - PubMed
    1. Zeebe RE, Westbroek P. A simple model for the CaCO3 saturation state of the ocean. The “Strangelove,” the “Neritan,” and the “Cretan” Ocean. Geochem. Geophys. Geosyst. 2003;4:70. doi: 10.1029/2003GC000538. - DOI
    1. Stallard RF, Edmond JM. Geochemistry of the Amazon. 3. Weathering chemistry and limits to dissolved inputs. J. Geophys. Res. 1987;92:8293. doi: 10.1029/JC092iC08p08293. - DOI
    1. Erlanger ED, Rugenstein JKC, Bufe A, Picotti V, Willett SD. Controls on physical and chemical denudation in a mixed carbonate‐siliciclastic orogen. J. Geophys. Res. Earth Surf. 2021;126:73. doi: 10.1029/2021JF006064. - DOI
    1. Li S-L, Calmels D, Han G, Gaillardet J, Liu C-Q. Sulfuric acid as an agent of carbonate weathering constrained by δ13CDIC. Examples from Southwest China. Earth Planet. Sci. Lett. 2008;270:189–199. doi: 10.1016/j.epsl.2008.02.039. - DOI