. 2023 Mar 24;14(1):1636.
doi: 10.1038/s41467-023-37252-y.

The m6A reader PRRC2A is essential for meiosis I completion during spermatogenesis

Affiliations

The m6A reader PRRC2A is essential for meiosis I completion during spermatogenesis

Xinshui Tan et al. Nat Commun. .

Abstract

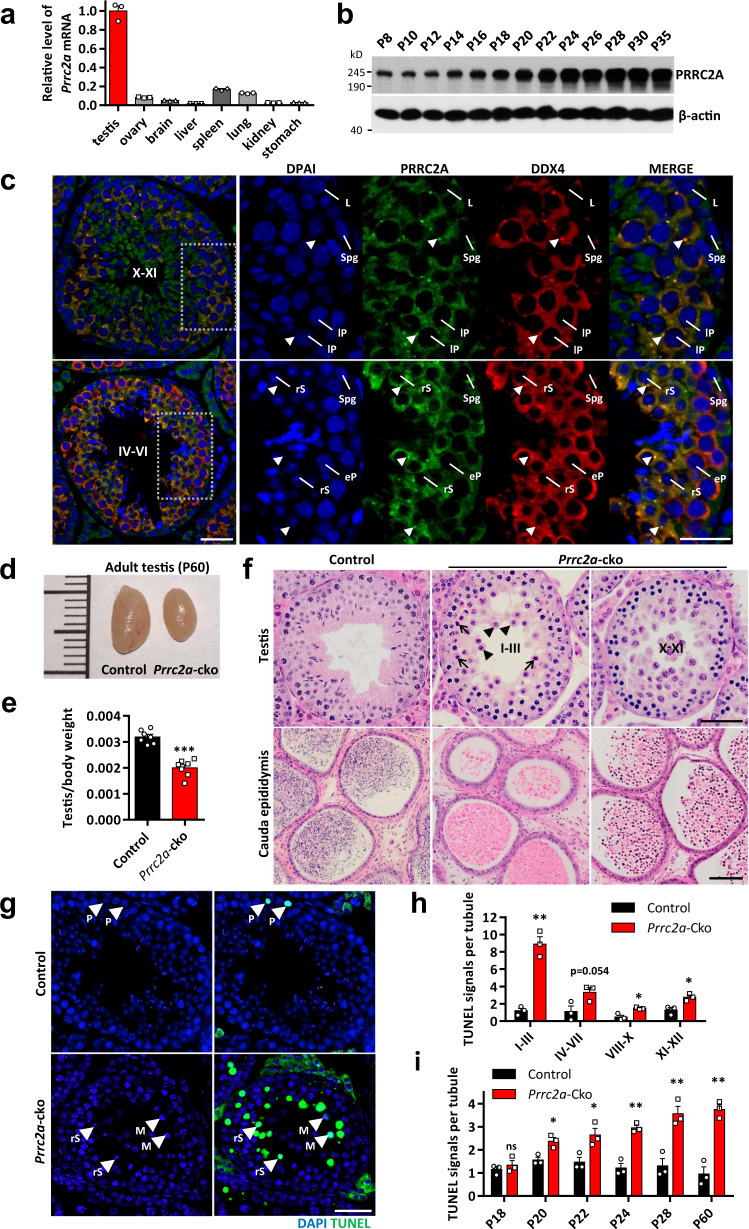
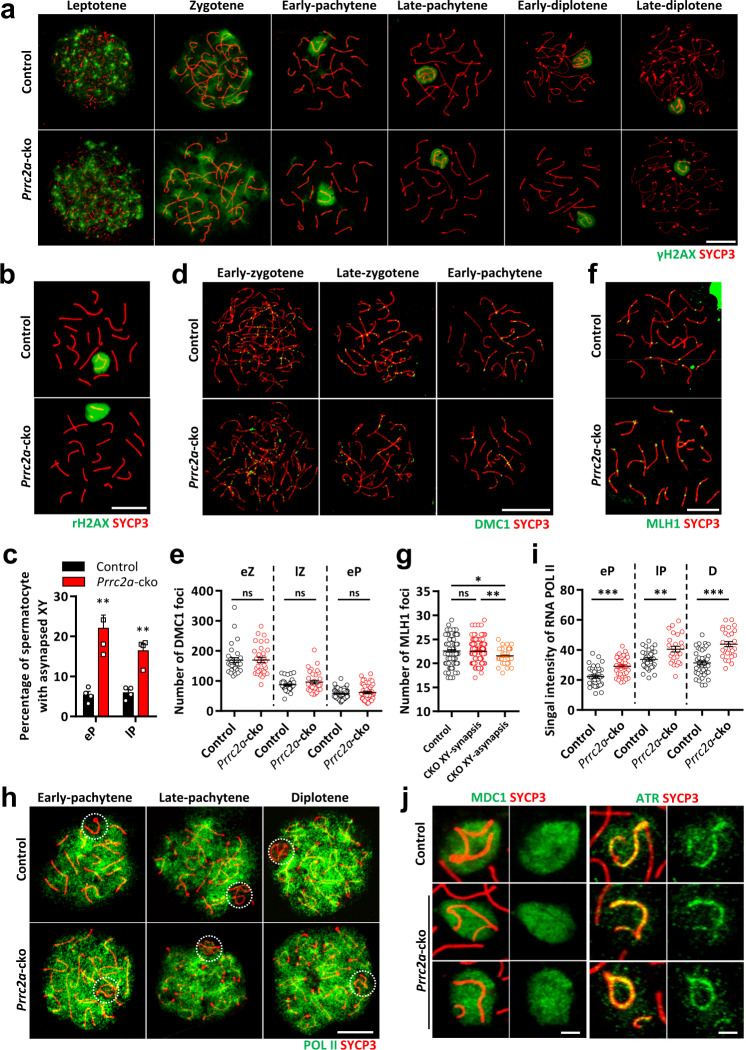
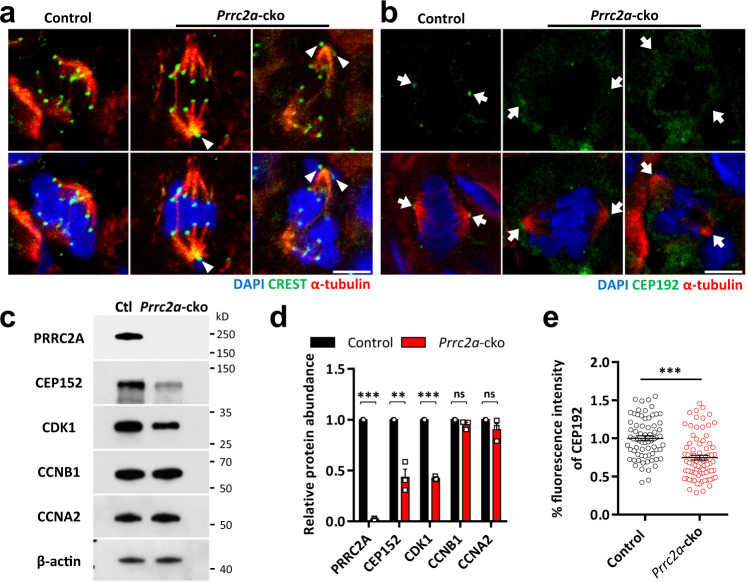
N6-methyladenosine (m6A) and its reader proteins YTHDC1, YTHDC2, and YTHDF2 have been shown to exert essential functions during spermatogenesis. However, much remains unknown about m6A regulation mechanisms and the functions of specific readers during the meiotic cell cycle. Here, we show that the m6A reader Proline rich coiled-coil 2A (PRRC2A) is essential for male fertility. Germ cell-specific knockout of Prrc2a causes XY asynapsis and impaired meiotic sex chromosome inactivation in late-prophase spermatocytes. Moreover, PRRC2A-null spermatocytes exhibit delayed metaphase entry, chromosome misalignment, and spindle disorganization at metaphase I and are finally arrested at this stage. Sequencing data reveal that PRRC2A decreases the RNA abundance or improves the translation efficiency of targeting transcripts. Specifically, PRRC2A recognizes spermatogonia-specific transcripts and downregulates their RNA abundance to maintain the spermatocyte expression pattern during the meiosis prophase. For genes involved in meiotic cell division, PRRC2A improves the translation efficiency of their transcripts. Further, co-immunoprecipitation data show that PRRC2A interacts with several proteins regulating mRNA metabolism or translation (YBX1, YBX2, PABPC1, FXR1, and EIF4G3). Our study reveals post-transcriptional functions of PRRC2A and demonstrates its critical role in the completion of meiosis I in spermatogenesis.


Conflict of interest statement

The authors declare no competing interests.

Figures

Fig. 1
Fig. 1. PRRC2A is highly expressed in testes and is essential for spermatogenesis.
a qPCR analysis of Prrc2a mRNA levels in various organs of adult mice. Two-sided student’s t-test. Error bars, n = 3 mice, mean ± SEM. Source data are provided as a Source Data file. b WB analysis of PRRC2A protein levels in mice testes of indicated ages. c Immunostaining of PRRC2A and DDX4 in P60 testis sections. The right panels show enlarged images of indicated areas. Spg spermatogonia, L leptotene spermatocyte, eP early pachytene spermatocyte, lP late-pachytene spermatocyte, rS round spermatid. Arrowheads indicate chromatoid bodies. Scale bar, 20 μm. d Morphology of representative testes from P60 control and Prrc2a-cko mice. e Ratios of testis weight to body weight of P60 control and Prrc2a-cko mice (n = 7). Two-sided student’s t-test. Error bars, mean ± SEM. p < 0.0001. Source data are provided as a Source Data file. f H&E staining in testis and epididymis sections of P60 control and Prrc2a-cko mice. Stages of the seminiferous epithelial cycle are indicated. Arrows indicate round spermatids with abnormal nuclear morphology. Arrowheads indicate detached round spermatids. Scale bar, 50 μm (up) and 100 μm (down). g TUNEL staining in P60 control and Prrc2a-cko testis sections. Arrowheads indicate germ cells with TUNEL signals. M, metaphase spermatocyte; rS, round spermatid. Scale bar, 50 μm. h Numbers of TUNEL-positive cells per tubule of the indicated stage in P60 control and Prrc2a-cko testes (n = 3). Two-sided student’s t-test. Error bars, mean ± SEM. p = 0.0010 (for I–III), 0.0539 (for IV–VII), 0.0103 (for VIII–X), 0.0161 (for XI–XII). Source data are provided as a Source Data file. i Numbers of TUNEL-positive cells per tubule in control and Prrc2a-cko testes (n = 3) of indicated ages. Two-sided student’s t-test. Error bars, mean ± SEM. p = 0.4448 (for P18), 0.0149 (for P20), 0.0308 (for P22), 0.0015 (for P24), 0.0071 (for P28), 0.0016 (for P60). Source data are provided as a Source Data file.
Fig. 2
Fig. 2. PRRC2A deficiency leads to XY asynapsis and impaired MSCI.
a, b Immunostaining of γH2AX and SYCP3 on chromosome spreads of control and PRRC2A-null spermatocytes. b Represent PRRC2A-null spermatocytes with XY asynapsis. Scale bar, 10 μm. c Percentage of early or late spermatocytes with XY asynapsis in total spermatocytes from P60 control and Prrc2a-cko testes. More than 500 chromosome spreads of spermatocytes from 4 mice were counted in each group of control and Prrc2a-cko. Two-sided student’s t-test. Error bars, mean ± SEM. p = 0.0028 (for eP), 0.0011 (for lP). Source data are provided as a Source Data file. d, e Immunostaining of DMC1 and SYCP3 on chromosome spreads and quantification of DMC1 foci distributed on chromosomes in control and Prrc2a-cko early-zygotene (Control, n = 31; Prrc2a-cko, n = 32), late-zygotene (Control, n = 38; Prrc2a-cko, n = 34), and early pachytene (Control, n = 57; Prrc2a-cko, n = 48) spermatocytes. Two-sided student’s t-test. Error bars, mean ± SEM. p = 0.9496 (for eZ), 0.1636 (for lZ), 0.4683 (for eP). Scale bar, 10 μm. Source data are provided as a Source Data file. f, g Immunostaining of MLH1 and SYCP3 on chromosome spreads and quantification of MLH1 foci distributed on chromosomes in control (n = 111 cells from three mice) and Prrc2a-cko pachytene spermatocytes with synapsed XY-synapsis (CKO XY-synapsis, n = 166 cells from three mice) or asynapsed XY (CKO XY-asynapsis, n = 41 cells from three mice). Two-sided student’s t-test. Error bars, mean ± SEM. ns p = 0.7998, *p = 0.0147, **p = 0.0065. Scale bar, 10 μm. Source data are provided as a Source Data file. h Immunostaining of POL II and SYCP3 on chromosome spreads of control and PRRC2A-null spermatocytes. Circles indicate XY bodies. Scale bar, 10 μm. i Quantification of signal intensity of POL II within XY body of control and PRRC2A-null spermatocytes. eP early pachytene spermatocyte (n = 39, 39); lP late-pachytene spermatocyte (n = 31, 26); D diplotene spermatocyte (n = 46, 28). Two-sided student’s t-test. Error bars, mean ± SEM. **p = 0.0021, ***p < 0.0001. Source data are provided as a Source Data file. j XY regions of control and Prrc2a-cko pachytene spermatocytes immunostained with silencing factors (MDC1 or ATR) and SYCP3. Scale bar, 2 μm.
Fig. 3
Fig. 3. PRRC2A deficiency leads to chromosome misalignment and spindle disorganization.
a Immunostaining of pH3 and γH2AX in P60 control and Prrc2a-cko testis sections. Seminiferous tubule stages are indicated. Arrowheads indicate metaphase spermatocytes. Scale bar, 50 μm. b The number of pH3+ spermatocytes per seminiferous tubule in control and Prrc2a-cko testes of indicated ages (n = 4 mice for P18, P20, P60; n = 3 mice for P22, P24, P28, P35). Two-sided student’s t-test. Error bars, mean ± SEM. p = 0.7785 (for P18), 0.0149 (for P20), 0.0334 (for P22), 0.0231 (for P24), 0.0250 (for P28), 0.6855 (for P35), 0.4705 (for P60). Source data are provided as a Source Data file. c The ratio of seminiferous tubules with pH3+ spermatocytes to total tubules in control and Prrc2a-cko testes of indicated ages (n = 4 mice for P18, P20, P60; n = 3 mice for P22, P24, P28, P35). Two-sided student’s t-test. Error bars, mean ± SEM. p = 0.7580 (for P18), 0.0014 (for P20), 0.1047 (for P22), 0.1941 (for P24), 0.0092 (for P28), 0.0456 (for P35), 0.0054 (for P60). Source data are provided as a Source Data file. d The number of pH3+ spermatocytes per seminiferous tubules of the indicated stage in P60 control and Prrc2a-cko testes. Two-sided student’s t-test. Error bars, n = 4 mice, mean ± SEM. p = 0.0014 (for I–III), 0.0591 (for IV–VII), 0.0242 (for VIII–X), 0.0176 (for XI–XII). Source data are provided as a Source Data file. e H&E staining in P60 control and Prrc2a-cko testes sections. Arrowheads indicate misaligned chromosomes in metaphase I spermatocytes. Scale bar, 20 μm. f Representative metaphase I spermatocytes in P60 control and Prrc2a-cko testis sections immunostained with α-tubulin and γ-tubulin. White arrowheads indicate misaligned chromosomes, yellow arrowheads indicate scattered γ-tubulin foci outside the spindle pole, yellow arrows indicate disintegrated MTOC at the spindle pole, white arrows indicate spindle poles. Scale bar, 5 μm. g Percentage of metaphase I spermatocytes with chromosomes misalignment (n = 4 biological independent mice), scattered γ-tubulin foci, disintegrated MTOC, and disorganized spindle (n = 3 biological independent mice) in P60 control and Prrc2a-cko testes. Two-sided student’s t-test. Error bars, mean ± SEM. p = 0.0007, 0.0018, 0.0423, 0.0057. Source data are provided as a Source Data file. h Fluorescence intensity of γ-tubulin at the spindle pole relative to that in control (n = 97, 100 cells). Two-sided student’s t-test. Error bars, mean ± SEM. ***p < 0.0001. Source data are provided as a Source Data file. i, j The average length and width of the alignment and spindles in control and Prrc2a-cko metaphase I spermatocytes immunostained with α-tubulin and γ-tubulin (n = 61 cells for control, n = 64 cells for Prrc2a-cko). Two-sided student’s t-test. Error bars, mean ± SEM. The value of each data is 10.21 ± 0.16, 10.07 ± 0.13, 6.07 ± 0.15, 7.55 ± 0.15, 9.05 ± 0.32, 10.25 ± 0.22, 7.25 ± 0.16, 7.38 ± 0.15 from left to right. p = 0.5051 (ns), <0.0001 (***), 0.0018 (**), 0.5759 (ns). Scale bar, 5 μm. Source data are provided as a Source Data file.
Fig. 4
Fig. 4. PRRC2A deficiency leads to impaired centrosome and downregulation of MPF.
a Representative metaphase I spermatocytes in P60 control and Prrc2a-cko testes sections immunostained with CREST and α-tubulin. Scale bar, 5 μm. b Representative metaphase I spermatocytes in P60 control and Prrc2a-cko testes sections immunostained with CEP192, α-tubulin. Arrows indicate spindle poles. Scale bar, 5 μm. c WB test of indicated proteins in control and PRRC2A-null spermatocytes from mice. d Quantification of the relative level of indicated proteins in control and PRRC2A-null spermatocytes. Two-sided student’s t-test. Error bars, n = 3 mice, mean ± SEM. ns p = 0.1088 (for CCNB1), 0.1735 (for CCNA2), **p = 0.0022, ***p < 0.0001. Source data are provided as a Source Data file. e Quantification of fluorescence intensity of CEP192 foci at spindle pole (n = 69, 79 cells). Two-sided student’s t-test. Error bars, mean ± SEM. ***p < 0.0001. Source data are provided as a Source Data file.
Fig. 5
Fig. 5. PRRC2A decreases the mRNA abundance and improves the translation efficiency of its targets.
a Scatter plots of Ribo-seq vs RNA-seq in control and PRRC2A-null spermatocytes. Genes were classified according to their regulation with the parameters indicated criteria. Gray dots (no sig) indicate genes with no significant change. Green dots (exclusive DTG) indicate genes with significant changes in RNA abundance (fold change (FC) > 1.5, p-adjusted < 0.05) and with no change in translation efficiency. Blue dots (exclusive DTEG) indicate genes with significant changes (FC > 1.5, p-value < 0.05) in translation efficiency and with no change in RNA abundance. Red dots (DTG&DTEG) indicate genes with significant changes in RNA abundance and translation efficiency. b, c Top GO terms in biological process categories of down and upregulated DTGs (b) and DTEGs (c). d The pie chart shows the distribution region of PRRC2A-binding peaks on transcripts in one of two repeats. e Distribution of PRRC2A-binding peaks along with transcripts. f Consensus binding motif of PRRC2A identified by HOMER (p = 1e−73). g Scatter plots of Ribo-seq vs RNA-seq in control and PRRC2A-null spermatocytes. Genes were classified into groups according to indicated criteria. Gray dots (non-target) indicate genes with no PRRC2A-binding sites. Orange dots indicate genes with PRRC2A-binding sites. Red dots indicate genes with overlapped PRRC2A-binding and m6A-modified sites. h, i Cumulative distribution of RNA abundance (left two panels) and translational efficiency (right two panels) changes between control and PRRC2A-null spermatocytes. Top two panels show non-targets (blue), PRRC2A-RIP targets (red) (H). Bottom two panels show targets with PRRC2A-binding m6A-not-modified sites (blue) and targets with one (green), two (orange), and more than three (red) PRRC2A-binding m6A-modified sites (I). p-values were calculated using two-sided Wilcoxon test.
Fig. 6
Fig. 6. PRRC2A deficiency causes defective transcriptome transition from spermatogonia to spermatocytes.
a Heatmap showing the changes of RNA abundance, TE, and RPF for genes with differentially RNA abundance (p-adjusted < 0.05 as cutoff) in PRRC2A-null spermatocytes versus control spermatocytes. Genes with PRRC2A-binding m6A-modified sites and their expression levels in different cell types were correspondingly shown. b, c Box plots show the RNA and RPF abundance of cell-type-specific genes from RNA-seq and Ribo-seq data (Prrc2a-cko versus control, two-sided Wilcox test) (n = 186, 395, 267, 125 genes). The box indicates the lower (25%) and upper (75%) quantile and the white line indicates the median. Whiskers extend from 2.5% to 97.5% percentile, non-outlier data points. d GSEA analysis of cell-type-specific gene sets in RNA-seq and Ribo-seq data (Prrc2a-cko versus control). e A heatmap showing the fold change of RNA and RPF abundance for representative cell-type-specific genes from RNA-seq and Ribo-seq data (Prrc2a-cko versus control). f Integrative Genomics Viewer shows the distribution of m6A-modified peaks and PRRC2A-binding peaks along with indicated transcripts in PRRC2A RIP-seq and MeRIP-seq data. Blue peaks and red peaks represent reads in the input and IP groups, respectively. Red boxes show the area containing both m6A-modified peaks and PRRC2A-binding peaks. g Relative abundance of indicated mRNAs in control and PRRC2A-null spermatocytes detected by qPCR. Two-sided student’s t-test. Error bars, n = 4 samples, mean ± SEM. ns p = 0.2311, ***p < 0.0001. Source data are provided as a Source Data file.
Fig. 7
Fig. 7. PRRC2A promotes the expression of genes involved in meiotic cell division.
a GSEA analysis of indicated gene sets in RNA-seq and Ribo-seq data (Prrc2a-cko versus control). b Integrative Genomics Viewer showed the distribution of m6A-modified peaks and PRRC2A-binding peaks along with indicated transcripts in PRRC2A RIP-seq and m6A-seq data. Blue peaks and red peaks represent reads in the input and IP groups, respectively. Red boxes show the area containing both m6A-modified peaks and PRRC2A-binding peaks. c, d MeRIP-qPCR and PRRC2A RIP-qPCR analysis of indicated transcripts in P20 testes. Two-sided student’s t-test. Error bars, n = 3 biological repeats, mean ± SEM. ns p > 0.05, **p < 0.01. Source data are provided as a Source Data file. e WB test of indicated protein in control and PRRC2A-null spermatocytes. f, g Quantification of the relative protein (f) and RNA (g) level of indicated genes in control and PRRC2A-null spermatocytes. Two-sided student’s t-test. Error bars, n = 3 biological repeats, mean ± SEM. ns p > 0.05, *p < 0.05, ***p < 0.001. Source data are provided as a Source Data file. h Testis lysates were subjected to IP with anti-Flag or IgG control antibodies. IP groups were treated with RNase inhibitor (RNasin) or RNaseA respectively. Indicated proteins were detected by WB. i WB test of indicated protein in control and PRRC2A-null spermatocytes. j Testis lysates were subjected to IP with anti-Flag or IgG control antibodies. Indicated proteins were detected by WB. CB chromatoid body, SG stress granule, PB processing body.

References

    1. Jiang X, et al. The role of m6A modification in the biological functions and diseases. Signal Transduct. Target. Ther. 2021;6:74. doi: 10.1038/s41392-020-00450-x. - DOI - PMC - PubMed
    1. Bokar JA, Rath-Shambaugh ME, Ludwiczak R, Narayan P, Rottman F. Characterization and partial purification of mRNA N6-adenosine methyltransferase from HeLa cell nuclei. Internal mRNA methylation requires a multisubunit complex. J. Biol. Chem. 1994;269:17697–17704. doi: 10.1016/S0021-9258(17)32497-3. - DOI - PubMed
    1. Liu J, et al. A METTL3-METTL14 complex mediates mammalian nuclear RNA N6-adenosine methylation. Nat. Chem. Biol. 2014;10:93–95. doi: 10.1038/nchembio.1432. - DOI - PMC - PubMed
    1. Jia G, et al. N6-methyladenosine in nuclear RNA is a major substrate of the obesity-associated FTO. Nat. Chem. Biol. 2011;7:885–887. doi: 10.1038/nchembio.687. - DOI - PMC - PubMed
    1. Zheng G, et al. ALKBH5 is a mammalian RNA demethylase that impacts RNA metabolism and mouse fertility. Mol. Cell. 2013;49:18–29. doi: 10.1016/j.molcel.2012.10.015. - DOI - PMC - PubMed

Publication types