. 2023 Mar 24;14(1):1634.
doi: 10.1038/s41467-023-36775-8.

The rhythmic coupling of Egr-1 and Cidea regulates age-related metabolic dysfunction in the liver of male mice

Affiliations

The rhythmic coupling of Egr-1 and Cidea regulates age-related metabolic dysfunction in the liver of male mice

Jing Wu et al. Nat Commun. .

Abstract

The liver lipid metabolism of older individuals canbecome impaired and the circadian rhythm of genes involved in lipid metabolism is also disturbed. Although the link between metabolism and circadian rhythms is already recognized, how these processes are decoupled in liver during aging is still largely unknown. Here, we show that the circadian rhythm for the transcription factor Egr-1 expression is shifted forward with age in male mice. Egr-1 deletion accelerates liver age-related metabolic dysfunction, which associates with increased triglyceride accumulation, disruption of the opposite rhythmic coupling of Egr-1 and Cidea (Cell Death Inducing DFFA Like Effector A) at the transcriptional level and large lipid droplet formation. Importantly, adjustment of the central clock with light via a 4-hour forward shift in 6-month-old mice, leads to recovery the rhythm shift of Egr-1 during aging and largely ameliorated liver metabolic dysfunction. All our collected data suggest that liver Egr-1 might integrate the central and peripheral rhythms and regulate metabolic homeostasis in the liver.


Conflict of interest statement

The authors declare no competing interests.

Figures
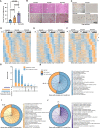
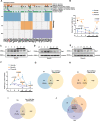
Fig. 1
Fig. 1. The rhythmic lipid metabolism was disordered with aging.
A Liver TG levels of C57BL/6 J mice at 2 months, 6 months, and 12 months (2 months: n = 6; 6 months: n = 5; 12 months: n = 5 biologically independent animals); B H&E and Oil Red O staining of liver tissues of C57BL/6 J mice at 2 months, 6 months, and 12 months; C β-Gal staining of liver tissues of C57BL/6 J mice at 2 months, 6 months, 12 months, and 21 months; DF Heatmap represents rhythmic genes exclusively in the livers of C57BL/6 J mice at 2 months, 6 months, and 12 months by using high-throughput RNA sequencing. The colors from blue to yellow indicate low to high gene expression levels, respectively; G Venn diagram displays the total number of rhythmic genes (left) and number of rhythmic non-metabolic or metabolic genes (right) in the liver; the black dots mean genes only in the indicated groups; a black line connecting black dots indicates that genes are in the connected group at the same time; HJ Pie charts indicate selected Top 20 biological process by using gene ontology (GO) analysis of genes circadian in 2 months, 6 months, and 12 months groups. The yellow of the outer circle means a lipid-related pathway, blue of the outer circle means a non-lipid-related pathway. Data were represented as mean ± SEM. Exact p values are depicted in the figure. Statistical analysis was performed using one-way ANOVA for A. Source data are provided as a Source Data file.
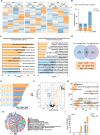
Fig. 2
Fig. 2. The phase of the Egr-1 circadian rhythm in the liver moves forward with aging.
A Heatmap represents rhythmic clock and clock-controlled genes exclusively in the livers of C57BL/6 mice at 2 months, 6 months, and 12 months; B mRNA expression of Egr-1 at the indicated time points in the livers of C57BL/6 J mice at 2 months, 6 months, and 12 months (2 month ZT1: n = 4, ZT5,9,21: n = 5, ZT13,17:n = 6; 6 month ZT1,9: n = 5, ZT5,13: n = 4, ZT17,21:n = 6; 12 month: n = 5 biologically independent animals), black dot means the peak expression of Egr-1 point at each group. CE Protein expression of Egr-1 at the indicated time points in the livers of C57BL/6 J mice at 2 months, 6 months, and 12 months (n = 5 biologically independent animals in 2 months; n = 3 biologically independent animals in 6 months; n = 4 biologically independent animals in 12 months). F Quantitative analysis of the Egr-1 protein levels in CE, n = 3 per group. GI Venn diagrams representing the overlap between WT group lipid-related genes and Egr-1 ChIP-Seq (GSM1037682) genes. J Venn diagrams displayed the overlap among intersecting genes in FH. Data were represented as mean ± SEM. Exact p values are depicted in the figure. Orange color p value means 6 months versus 2-month group; Purple color p value means 12 months versus 2-month group; Black color p value means 6 months versus 12-month group. Statistical analysis was performed using one-way ANOVA for B and F. Source data are provided as a Source Data file.
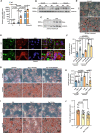
Fig. 3
Fig. 3. Egr-1 deficiency accelerates liver age-related metabolic dysfunction.
A Liver TG levels of WT and Egr-1-LKO mice at 2 months, 6 months, 12 months, and 21 months (WT: 2 months: n = 7; 6 months: n = 7; 12 months: n = 8; 21 months: n = 6; Egr-1 LKO: 2 months: n = 6; 6 months: n = 5; 12 months: n = 6; 21 months: n = 6 biologically independent animals). B, C H&E staining and Oil Red O staining of WT and Egr-1-LKO mice at 2 months, 6 months, and 21 months of age. D, E Liver and serum-free fatty acid levels of WT and Egr-1-LKO mice at 6 months (n = 6 or 7 biologically independent animals in WT group and n = 5 or 6 biologically independent animals in Egr-1 LKO group). F Sirius Red staining of 21-month-old WT and Egr-1-LKO mice. G mRNA levels of the liver fibrosis marker a-SMA (n = 9 biologically independent animals). H β-Galactosidase staining indicates the aging process. I Survival curves of WT and Egr-1-LKO mice. Each experiment was repeated three times independently (WT: n = 22; Egr-1 LKO: n = 23 biologically independent animals). Data were represented as mean ± SEM. Exact p values are depicted in the figure. Statistical analysis was performed using one-way ANOVA for A and unpaired two-tailed Student’s t-test for D, E, and G. Scale bar: 100 µm. Source data are provided as a Source Data file.
Fig. 4
Fig. 4. Transcriptomic analysis of the liver in Egr-1-deleted mice with age increased.
A Heatmap representation of the genes at Egr-1 highest and lowest zeitgeber time of mice aged 2 months, 6 months, and 12 months. The colors from blue to yellow indicate low to high gene expression levels, respectively. B Intersect gene counts statistics of Venn diagrams in Supplementary Fig. 4A. C Selected significantly enriched lipid-related GO terms of 2-month and 12-month intersect genes. The statistical test of data analysis was performed using a hypergeometric test, two-tailed, no adjustment (p < 0.05). D Venn diagrams representing the overlap between 2m_no_intersect_down and 12_intersect_down group. The lipid metabolism-related genes were labeled with red font. E Euclidean distance of each group difference at different ages. F Volcano plot displayed genes expressed in WT_H and KO_H groups in mice at the age of 6 months. The relative expression changes and significance levels are shown. The statistical test of data analysis was performed using two-tailed, no adjustment (p < 0.05) from the limma package in the R environment. G Selected significantly enriched GO terms. The x-axis and y-axis represent the enrichment and significance level, respectively, and the size of the circle represents the number of genes associated with the GO term. The statistical test of data analysis was performed using a hypergeometric test, two-tailed, no adjustment (p < 0.05). H Chord diagram revealing the enrichment levels of genes related to selected GO terms. I Relative FPKM values of Cidea in WT_H and KO_H group. We used four mice per group for the analysis. One-way ANOVA for A and unpaired two-tailed Student’s t-test for D, E, and G.
Fig. 5
Fig. 5. Egr-1 regulates liver metabolic aging in a Cidea-dependent manner.
A mRNA levels of Cidea in samples from RNA-seq (n = 3 biologically independent animals per group); B Protein levels of Cidea in samples from RNA-seq; C Protein levels of Cidea in primary hepatocytes of WT and Egr-1 LKO mice at 6 months of age; D Oil Red O staining of primary hepatocytes of WT and Egr-1 LKO mice at 6 months of age; E Immunofluorescence staining of primary hepatocytes of WT and Egr-1 LKO mice at 6 months of age; F TG levels in WT and Egr-1 LKO primary hepatocytes from 2-month-old and 6-month-old mice after infection with a ShCidea adenovirus (n = 4 biologically independent samples); G Oil Red O staining of WT and Egr-1 LKO primary hepatocytes from 2-month-old and 6-month-old mice after infection with a ShCidea adenovirus; H Hepatocyte TG levels after transfection with a Cidea overexpression plasmid or infection with an Egr-1 overexpression adenovirus (n = 4 biologically independent samples); I Oil Red O staining after transfection with a Cidea overexpression plasmid or infection with an Egr-1 overexpression adenovirus; J the fatty acid uptake ratio after transfection with a Cidea overexpression plasmid or infection with an Egr-1 overexpression adenovirus (n = 14 biologically independent samples). Data were represented as mean ± SEM. Exact p values are depicted in the figure. Statistical analysis was performed using one-way ANOVA. Source data are provided as a Source Data file.
Fig. 6
Fig. 6. Egr-1/BMAL1/CLOCK regulates the robustness and rhythm of Cidea by inhibiting its transcription.
A mRNA expression of Cidea at the indicated time points in livers from C57BL/6 J mice at 2 months, 6 months, and 12 months of age (2 months ZT1: n = 6, ZT5: n = 5, ZT9,13,17,21:n = 4; 6 months ZT1: n = 4, ZT5,13: n = 6, ZT9:n = 5, ZT17,21: n = 4; 12 months: n = 4 biologically independent animals); B Protein levels of Cidea at the indicated time points in livers from B6 mice at 2 months, 6 months, and 12 months of age that were entrained to a 12-h light/dark cycle. C Quantitative analysis of Cidea protein levels in Fig. 6B (n = 4 biologically independent animals per group). D Protein levels of Cidea in primary hepatocytes isolated from 6-month-old C57BL/6 J mice after deletion of Egr-1. E Protein levels of Cidea in primary hepatocytes isolated from 6-month-old C57BL/6 J mice overexpressing Egr-1. F ChIP assay (n = 3 or 4 biologically independent samples per group); G Luciferase assay (n = 5 biologically independent samples per group). H HEK293T cells were co-transfected with Myc-BMAL1, Egr-1, and CLOCK expression plasmids. Co-IP of Egr-1, Myc-BMAL1, and CLOCK was performed. E means Egr-1, B means BMAL1, and C means CLOCK. Each experiment was repeated three times independently. The data represent the mean ± SEM. Exact p values are depicted in the figure. Orange color p value means 6 months versus 2 month group; Purple color p value means 12 months versus 2 month group; Black color p value means 6 months versus 12 month group. Statistical analysis was performed using one-way ANOVA. Source data are provided as a Source Data file.
Fig. 7
Fig. 7. Egr-1 phase restoration via a light shift is able to rescue liver metabolic dysfunction.
A Design of experiments in which the phase of illumination was advanced 4 h. B, C Body weights and ratios of liver weight to body weight in the groups at ZT5 (2 months: n = 6; 6 months: n = 7; 6 months Trans: n = 5 biologically independent animals). D, E mRNA levels of Egr-1 and Cidea in the groups at ZT5 (2 months: n = 6; 6 months: n = 7; 6 months Trans: n = 5 biologically independent animals). F Protein levels of Egr-1 and Cidea in the groups at ZT5. G Tissue TG levels in the groups at ZT5 (2 months: n = 7; 6 months: n = 6; 6 months Trans: n = 5 biologically independent animals). H H&E staining and Oil Red O staining in the groups at ZT5. The data represent the mean ± SEM. Statistical analysis was performed using one-way ANOVA. Source data are provided as a Source Data file.
Fig. 8
Fig. 8. Schematic for the contribution of Egr-1 rhythm to the correlation between circadian rhythms and metabolic patterns with age increased.
At a young age, Egr-1 combines with circadian genes BMAL1/CLOCK to form a complex, then regulates the circadian expression of Cidea to maintain the balance of lipid metabolism. With age increased, Egr-1 rhythm alteration might result in uncoupling of Egr-1 with both circadian genes BMAL1/CLOCK and lipid metabolic genes Cidea, facilitating the CD36 expression to promote the fatty acid uptake, accelerating the amino acid uptake to form more fatty acid in hepatocytes, thus, leading to the decoupling of liver circadian and the lipid metabolic disorder in ageing mice. However, how the Egr-1 rhythm responds to the master clock remains to be explored. In the work model, the elements of young and old liver were bought from the website (https://www.dreamstime.com/illust ration-non-alcoholic-fatty-liver-disease-comparison-shows-healthy-diseased-image191689868).

References

    1. Cartee GD, Hepple RT, Bamman MM, Zierath JR. Exercise promotes healthy aging of skeletal muscle. Cell Metab. 2016;23:1034–1047. doi: 10.1016/j.cmet.2016.05.007. - DOI - PMC - PubMed
    1. Sato S, et al. Circadian reprogramming in the liver identifies metabolic pathways of aging. Cell. 2017;170:664–677.e611. doi: 10.1016/j.cell.2017.07.042. - DOI - PMC - PubMed
    1. Gong Z, Tas E, Yakar S, Muzumdar R. Hepatic lipid metabolism and non-alcoholic fatty liver disease in aging. Mol. Cell Endocrinol. 2017;455:115–130. doi: 10.1016/j.mce.2016.12.022. - DOI - PubMed
    1. Van Schaftingen E, Lederer B, Bartrons R, Hers HG. A kinetic study of pyrophosphate: fructose-6-phosphate phosphotransferase from potato tubers. Application to a microassay of fructose 2,6-bisphosphate. Eur. J. Biochem. 1982;129:191–195. doi: 10.1111/j.1432-1033.1982.tb07039.x. - DOI - PubMed
    1. Anantharaju A, Feller A, Chedid A. Aging liver. A review. Gerontology. 2002;48:343–353. doi: 10.1159/000065506. - DOI - PubMed

Publication types

Substances