. 2023 Mar 24;13(1):4866.
doi: 10.1038/s41598-023-31915-y.

RevGel-seq: instrument-free single-cell RNA sequencing using a reversible hydrogel for cell-specific barcoding

Affiliations

RevGel-seq: instrument-free single-cell RNA sequencing using a reversible hydrogel for cell-specific barcoding

Jun Komatsu et al. Sci Rep. .

Abstract

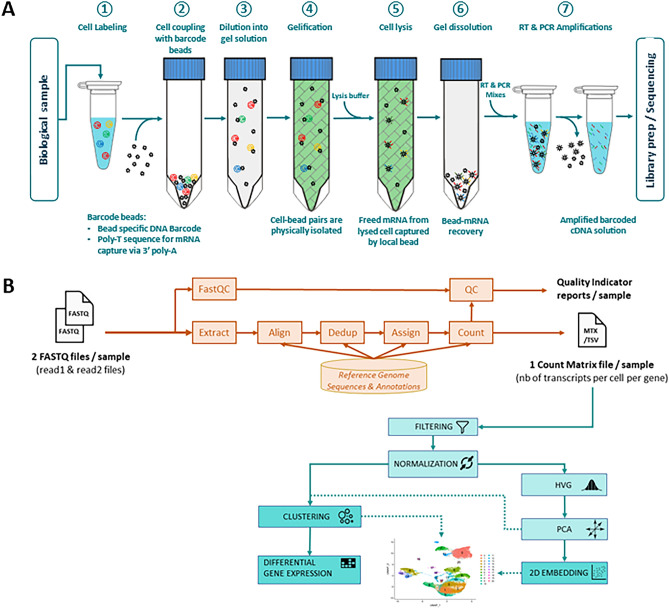
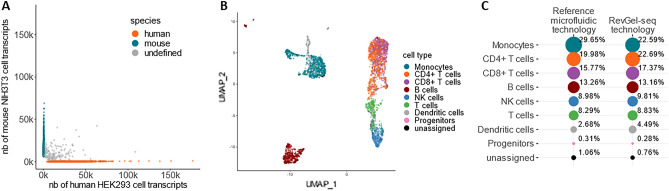
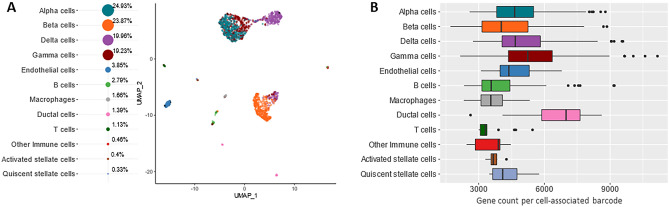
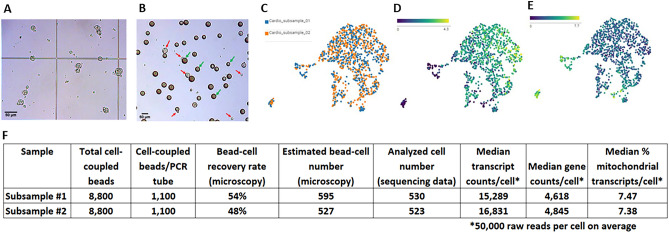
Progress in sample preparation for scRNA-seq is reported based on RevGel-seq, a reversible-hydrogel technology optimized for samples of fresh cells. Complexes of one cell paired with one barcoded bead are stabilized by a chemical linker and dispersed in a hydrogel in the liquid state. Upon gelation on ice the complexes are immobilized and physically separated without requiring nanowells or droplets. Cell lysis is triggered by detergent diffusion, and RNA molecules are captured on the adjacent barcoded beads for further processing with reverse transcription and preparation for cDNA sequencing. As a proof of concept, analysis of PBMC using RevGel-seq achieves results similar to microfluidic-based technologies when using the same original sample and the same data analysis software. In addition, a clinically relevant application of RevGel-seq is presented for pancreatic islet cells. Furthermore, characterizations carried out on cardiomyocytes demonstrate that the hydrogel technology readily accommodates very large cells. Standard analyses are in the 10,000-input cell range with the current gelation device, in order to satisfy common requirements for single-cell research. A convenient stopping point after two hours has been established by freezing at the cell lysis step, with full preservation of gene expression profiles. Overall, our results show that RevGel-seq represents an accessible and efficient instrument-free alternative, enabling flexibility in terms of experimental design and timing of sample processing, while providing broad coverage of cell types.


Conflict of interest statement

Authors P.W. and S.E. are founders, officers, and stockholders in Scipio bioscience, and J.K., R.P., J.M., S.L., A.G., and H.E. possess stock options. Other authors A.C., M.L.B., L.C., F.G., S.M., D.U., A.V., N.F., D.D., X.B., Y.F., P.C., B.A., E.B., U.G., M.G., V.M., J.I., O.C., N.R., C.B., A.L., G.G., and B.B. have no competing interests. Scipio bioscience owns several patent application families on the precepts (EP18733327.3), the protocol (EP 22 305 661.5) and the consumable (EP 22 305 661.5) of the RevGel-seq technology. These applications, of which the authors from Scipio bioscience are inventors, protect the inventions in numerous countries throughout the world. Subsequent patents have been filed by Scipio bioscience.

Figures

Figure 1
Figure 1
Sample preparation workflow and data analysis pipeline. (A) RevGel-seq workflow steps for sample preparation to characterize scRNA-seq. Barcoded beads and cells are attached via a bifunctional chemical linker. These complexes are dispersed in the hydrogel in the liquid state and immobilized upon gelation. Following cell lysis, RNA molecules are captured on the barcodes. After reverse transcription, barcoded cDNAs are PCR-amplified. Further details are presented in “Methods”. (B) Workflow of the end-to-end data processing pipeline integrated in the Cytonaut platform. The pre-processing phase inputs the raw sequencing data (FASTQ files) and outputs quality indicators and count matrices, followed by the post-processing phase that inputs the count matrices to perform 2D embedding, cell clustering and differential gene expression. The Cytonaut Rover module enables interactive data visualization. Additional details in “Methods”.
Figure 2
Figure 2
Benchmarking and applications. (A) Barnyard plot showing for each cell-associated barcode the number of detected mouse NIH3T3 transcripts and the number of detected human HEK293 transcripts, from 10,000 input cells prepared with RevGel-seq, with sequencing data downsampled by raw read subsampling at a depth of 50,000 raw reads per cell on average. The hetero-species cell multiplet rate is 3% (for details on criteria see “Methods”). (B) Cell classification and 2D embedding from a PBMC sample of 10,000 input cells prepared with RevGel-seq were downsampled by raw read subsampling at a depth of 20,000 raw reads per cell on average. Post-processing was performed using Seurat and automated cell classification was performed using the SingleR algorithm based on the reference dataset MonacoImmuneData. Unassigned cells had classification uncertainties that were considered too high according to the pruneScores method with default parameters. All relevant PBMC sub-types were identified. (C) Percentage of automatically classified cells for each cell type identified in the same PBMC sample prepared with a reference microfluidic technology (10x Chromium 3′ v3.1) and prepared with RevGel-seq, with 10,000 input cells and a sequencing depth of 20,000 raw reads per cell on average. For both methods, RevGel-seq and 10x Chromium 3′ v3.1, the same original sample was used and the same data analysis software (Cytonaut v1.2) was applied. The relative proportions of cell types are highly similar between RevGel-seq and the reference microfluidic technology.
Figure 3
Figure 3
Analysis of pancreatic islet cells. (A) Pancreatic islet cells (176,000 raw reads per cell) automatically classified into cell types (left) following the same methodology as in Fig. 2B except for the reference dataset BaronPancreasData. (B) Box plots showing the distribution of gene diversity per identified cell type for pancreatic islet cells classified in (A).
Figure 4
Figure 4
Evaluation of large cell processing with cardiomyocytes. (A) Microscopic observations of cardiomyocytes following trypsinization (cell diameter of 20–35 µm). (B) Microscopic observations of cardiomyocytes following coupling procedure (red arrows indicate cells, green arrows indicate beads). (C) 2D projections of data from two subsamples (PCR tubes) from the same cardiomyocyte sample preparation. (D) Gene expression of RYR2 (cardiomyocyte enriched gene) and (E) CALD1 gene expression (smooth muscle cell enriched gene). (F) Estimated cell quantities obtained from numbers of cell-bead complexes (for all 10,000 input cells), observed bead recovery rate (for each PCR tube, max 12.5% for each of 8 PCR tubes), and transcript/gene counts per analyzed cell at average 50,000 raw reads per cell. Sequencing data was processed according to Methods, section “RevGel-seq sample preparation workflow” by the pre-processing analysis pipeline of Cytonaut, which automatically detects the analyzed cells.
Figure 5
Figure 5
Freezing samples at an early stopping point during RevGel-seq protocol does not modify scRNA preparation performances. (A) Schematic representation of the timing differences between the “Control” and “Early stop” samples (see “Methods” for specific steps). “Control” samples were obtained by freezing the RT reaction mixture at − 20 °C overnight, while “Early stop 80 °C” and “Early stop dry ice” samples were obtained by freezing (either at − 80 °C or in dry ice, respectively) immediately after applying lysis buffer to the hydrogel. The RevGel-seq protocol was resumed on a subsequent day for all samples. (B) Comparison of performance indicators between the tested conditions (average of 3 PCR tubes for each condition). Gene and transcript counts per analyzed cell at 50,000 raw reads per cell with raw read downsampling. (C,D) Projection of scRNA-seq data on 2D (UMAP) of the pooled samples (pool of data from 1 PCR tube for all 3 conditions), shown per condition (C) and per determined cell species (D). (“undefined” corresponds to cells with a cell barcode purity lower than 95%; see Methods section “Pre-processing pipeline”, iii). With respect to cell capture yields, obtained cell species proportions were as follows: human 45.8%, mouse 49.9%, undefined 4.3% (Control sample); human 48.6%, mouse 52.5%, undefined 3.9% (Early stop dry ice); and human 46.2%, mouse 48.4%, undefined 5.4% (Early stop − 80 °C).

References

    1. Macosko EZ, et al. Highly parallel genome-wide expression profiling of individual cells using nanoliter droplets. Cell. 2015;161:1202–1214. doi: 10.1016/j.cell.2015.05.002. - DOI - PMC - PubMed
    1. Klein AM, Macosko E. InDrops and Drop-seq technologies for single-cell sequencing. Lab Chip. 2017;17:2540–2541. doi: 10.1039/C7LC90070H. - DOI - PubMed
    1. Quake SR. The cell as a bag of RNA. Trends Genet. 2021;37:1064–1068. doi: 10.1016/j.tig.2021.08.003. - DOI - PubMed
    1. Cable J, et al. Single cell biology—A Keystone Symposia report. Ann. N. Y. Acad. Sci. 2021;1506:74–97. doi: 10.1111/nyas.14692. - DOI - PubMed
    1. Ke M, Elshenawy B, Sheldon H, Arora A, Buffa FM. Single cell RNA-sequencing: A powerful yet still challenging technology to study cellular heterogeneity. BioEssays. 2022;44:e2200084. doi: 10.1002/bies.202200084. - DOI - PubMed