

Development of parallel forms of a brief smell identification test useful for longitudinal testing
- PMID: 36964286
- PMCID: PMC10038376
- DOI: 10.3758/s13428-023-02102-8
Development of parallel forms of a brief smell identification test useful for longitudinal testing
Abstract
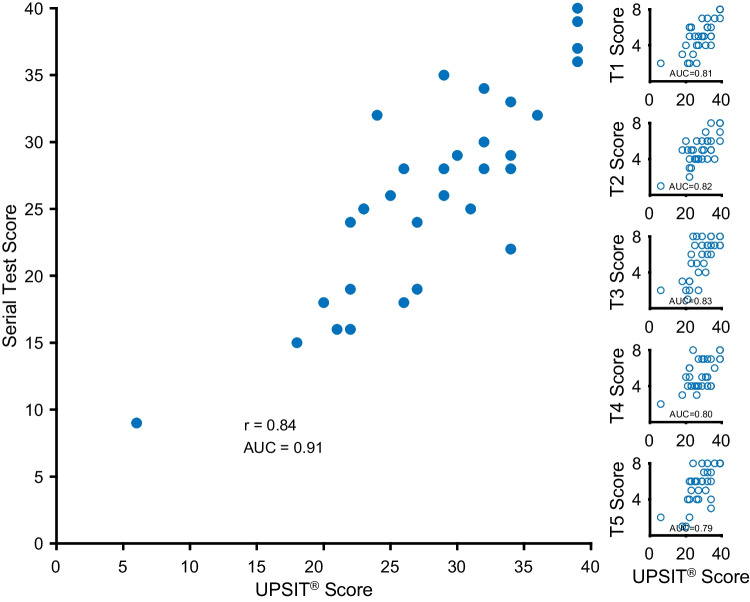
Although there are numerous brief odor identification tests available for quantifying the ability to smell, none are available in multiple parallel forms that can be longitudinally administered without potential confounding from knowledge of prior test items. Moreover, empirical algorithms for establishing optimal test lengths have not been generally applied. In this study, we employed and compared eight machine learning algorithms to develop a set of four brief parallel smell tests employing items from the University of Pennsylvania Smell Identification Test that optimally differentiated 100 COVID-19 patients from 132 healthy controls. Among the algorithms, linear discriminant analysis (LDA) achieved the best overall performance. The minimum number of odorant test items needed to differentiate smell loss accurately was identified as eight. We validated the sensitivity of the four developed tests, whose means and variances did not differ from one another (Bradley-Blackwood test), by sequential testing an independent group of 32 subjects that included persons with smell dysfunction not due to COVID-19. These eight-item tests clearly differentiated the olfactory compromised subjects from normosmics, with areas under the ROC curve ranging from 0.79 to 0.83. Each test was correlated with the overall UPSIT scores from which they were derived. These brief smell tests can be used separately or sequentially over multiple days in a variety of contexts where longitudinal olfactory testing is needed.
Keywords: Anosmia; Hyposmia; Longitudinal testing; Olfactory test; UPSIT.
© 2023. The Psychonomic Society, Inc.
Conflict of interest statement
RLD is a consultant to Destiny Pharma, Satsuma Pharmaceuticals, Merck Pharmaceuticals, and Johnson & Johnson. He receives royalties from Cambridge University Press, Johns Hopkins University Press, and John Wiley & Sons, Inc. and is president of, and a major shareholder in, Sensonics International, a manufacturer and distributor of smell and taste tests. STM is a physician scientist and RS is a research coordinator, both affiliated with Sensonics International. All other authors declare they have no relevant or financial competing interests.
Figures


References
-
- Bradley EL, Blackwood LG. Comparing paired data: A simultaneous test for means and variances. The American Statistician. 1989;43(4):234–235. doi: 10.1080/00031305.1989.10475665. - DOI
-
- Breiman L. Machine Learning. 2001;45(1):5–32. doi: 10.1023/a:1010933404324. - DOI
-
- Breiman L, Friedman JH, Olshen RA, Stone CJ. Classification And Regression Trees. 1. Routledge; 1984.
-
- Doty, R. L. (1995). The smell identification testTM administration manual. Haddon heights,NJ; Sensonics International.
