. 2023 Mar 24;6(1):256.
doi: 10.1038/s42003-023-04627-2.

Direct reprogramming of human fibroblasts into insulin-producing cells using transcription factors

Affiliations

Direct reprogramming of human fibroblasts into insulin-producing cells using transcription factors

Marta Fontcuberta-PiSunyer et al. Commun Biol. .

Abstract

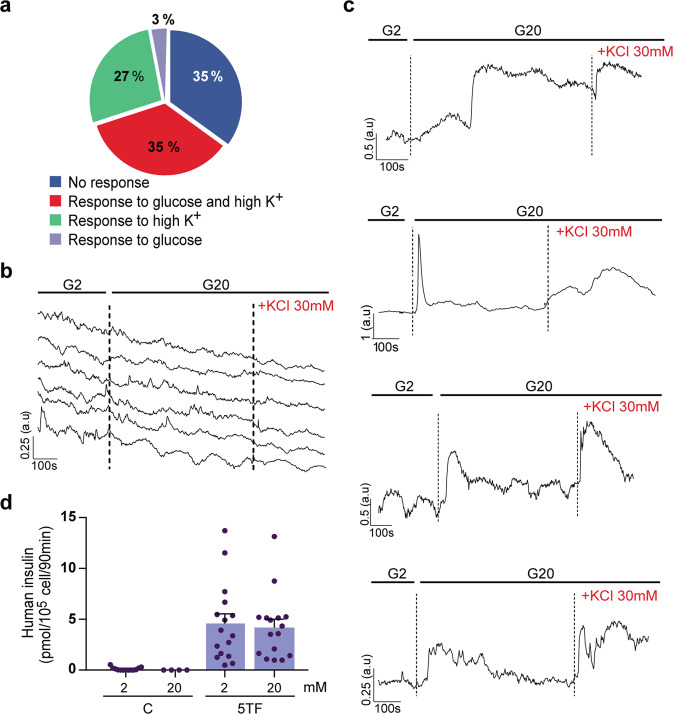
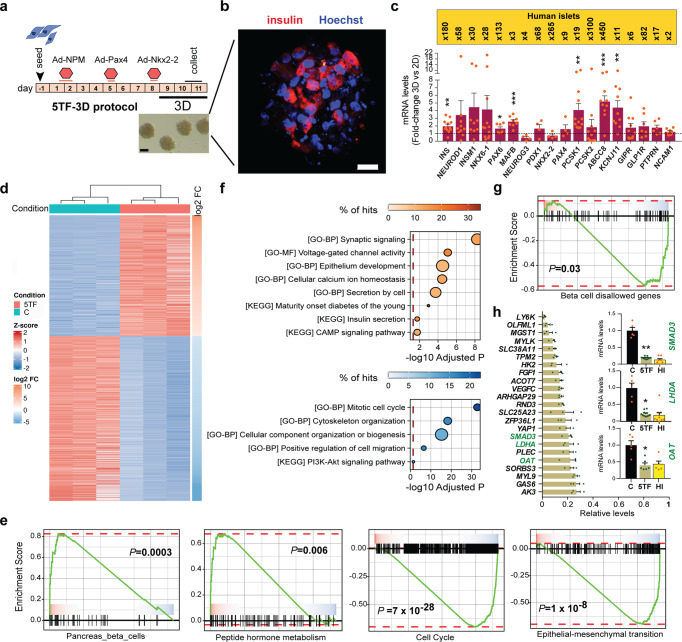
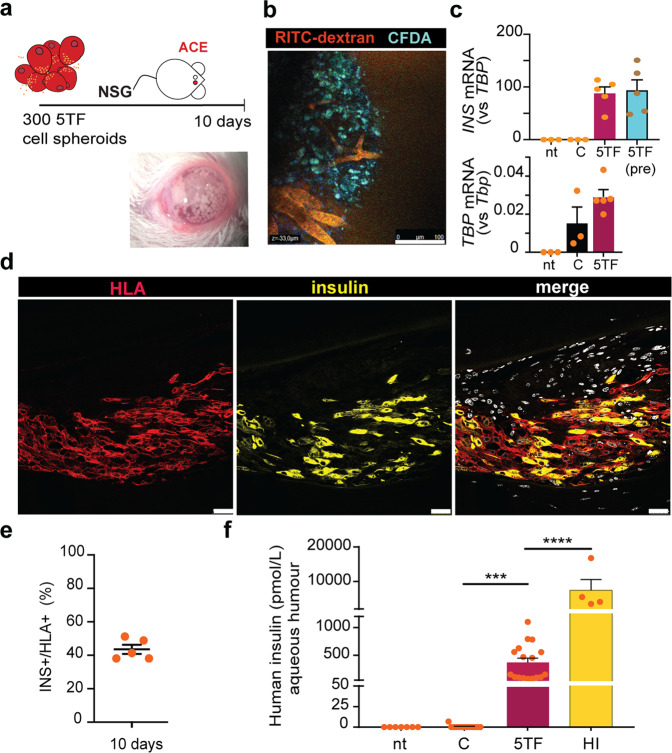
Direct lineage reprogramming of one somatic cell into another without transitioning through a progenitor stage has emerged as a strategy to generate clinically relevant cell types. One cell type of interest is the pancreatic insulin-producing β cell whose loss and/or dysfunction leads to diabetes. To date it has been possible to create β-like cells from related endodermal cell types by forcing the expression of developmental transcription factors, but not from more distant cell lineages like fibroblasts. In light of the therapeutic benefits of choosing an accessible cell type as the cell of origin, in this study we set out to analyze the feasibility of transforming human skin fibroblasts into β-like cells. We describe how the timed-introduction of five developmental transcription factors (Neurog3, Pdx1, MafA, Pax4, and Nkx2-2) promotes conversion of fibroblasts toward a β-cell fate. Reprogrammed cells exhibit β-cell features including β-cell gene expression and glucose-responsive intracellular calcium mobilization. Moreover, reprogrammed cells display glucose-induced insulin secretion in vitro and in vivo. This work provides proof-of-concept of the capacity to make insulin-producing cells from human fibroblasts via transcription factor-mediated direct reprogramming.


Conflict of interest statement

The authors declare no competing interests.

Figures

Fig. 1
Fig. 1. Introduction of the transcription factors Neurog3, Pdx1, and MafA activates pancreatic endocrine gene expression in human fibroblasts.
Human fibroblasts (HFF1) were infected with a polycistronic recombinant adenovirus encoding the transcription factors Neurog3, Pdx1, MafA, and the reporter protein Cherry (Ad-NPM). Untreated parental fibroblasts were used as controls (indicated as C in graphs). a Bright field images and Cherry immunofluorescence of control fibroblasts and fibroblasts infected with Ad-NPM at day 3 and 7 post-infection. Scale bar, 100 μm. b qPCR of transgenes at day 3 (n = 11) and 7 (n = 6) after infection with Ad-NPM. c qPCR of human INS at day 3 (n = 7) and 7 (n = 13) after infection with Ad-NPM. d qPCR of human INS in fibroblasts maintained in the indicated culture media (DM = DMEM; CM = CMRL; RP = RPMI) during 7 days after infection with Ad-NPM or with an adenovirus expressing B-galactosidase (B-gal) (n = 3–10). In yellow, INS mRNA levels in isolated human islets (n = 10). e, f qPCR of islet hormone genes (GCG, SST) and islet differentiation transcription factors (NEUROD1, INSM1, PAX4, NKX2-2, ARX) at day 7 post-NPM (n = 8–15). g qPCR of the indicated fibroblast markers at day 3 (n = 5–11) and day 7 post-NPM (n = 5–6). In bf, expression levels are expressed relative to TBP. In g, expression is expressed relative to control fibroblasts, given the value of 1 (dotted line). Data are presented as the mean ± SEM for the number of samples indicated in parentheses. *P < 0.05; **P < 0.01; ***P < 0.001, between indicated conditions using unpaired t-test (bf), or relative to control fibroblasts using one sample t-test (g).
Fig. 2
Fig. 2. Sequential addition of the transcription factors Pax4 and Nkx2-2 enhances β-cell fate in human fibroblasts expressing Neurog3, Pdx1, and MafA.
Human fibroblasts (HFF1) were infected with Ad-NPM alone or sequentially with Ad-NPM and adenoviruses encoding the transcription factors Pax4 and Nkx2-2. Ad-Pax4 and Ad-Nkx2-2 were added three days after NPM in the two-virus conditions. In the three-virus condition, Pax4 was added three days and Nkx2-2 and six days after NPM (condition called 5TF). All cells were collected ten days after infection with Ad-NPM. a qPCR of the indicated transgenes and endogenous genes. Expression levels are calculated relative to TBP. Values represent the mean ± SEM (n = 4–12). b Representative immunofluorescence images showing insulin staining (in red) using two different antibodies, one against C-PEP, in untreated fibroblasts and in fibroblasts infected with Ad-NPM alone or with 5TF. Nuclei were stained with Hoechst (in blue). Scale bar, 25 μm. *P < 0.05; ****P < 0.0001 relative to NPM in (b) using one-way ANOVA and Tukey’s multiple comparison test.
Fig. 3
Fig. 3. The 5TF protocol results in cell growth arrest and activation of endogenous β-cell differentiation transcription factors and β-cell marker genes in human fibroblasts.
a Scheme of the reprogramming protocol 5TF (NPM + Pax4 + Nkx2.2) showing the sequence of addition of adenoviruses encoding the indicated transcription factor/s. Duration of incubation with each adenovirus is represented with a line. Cells were studied at days 10-11 after initial addition of Ad-NPM. b Representative bright field image of parental fibroblasts and 5TF reprogrammed fibroblasts at day 10. Scale bar, 75 μm. c Cell proliferation measured by BrdU incorporation and d cell viability measured by MTT assay for n = 3 independent reprogramming experiments. Bars represent values relative to control fibroblasts (given the value of 1, represented by a dotted line). Note that day 4 values are before Pax4 introduction. e, f qPCR of islet/β-cell transcription factor and β-cell function genes in untreated control fibroblasts (C, n = 5–22), in fibroblasts infected with Ad-NPM alone (n = 3–22) or with 5TF (n = 5–22). Expression levels were calculated relative to TBP. qPCR of the indicated endogenous genes (g) and transgenes (h) at day 21 after initiation of reprogramming (n = 9–13, from 7 reprogramming experiments). Transcript levels are expressed relative to levels in cells at day 10 of the reprogramming protocol (given the value of 1, shown with a dotted line). Data are mean ± SEM for the number of n indicated in parentheses. *P < 0.05, **P < 0.01, ***P < 0.001 compared to control fibroblasts (c, d), or between indicated bars using unpaired t-test (e, f), or compared to day 10 5TF cells (g, h) using one-sample t-test.
Fig. 4
Fig. 4. 5TF cells increase intracellular calcium in response to glucose and KCl.
5TF cells were loaded with the calcium indicator Fluo-4-AM at day 10 of the reprogramming protocol. Single-cell imaging to detect cytosolic calcium was performed in the following sequence: low glucose (2 mM, G2), high glucose (20 mM, G20) and membrane depolarization with KCl (30 mM). a Quantification of the frequency of cells (n = 200, from six independent reprogramming experiments) that responded to glucose, membrane depolarization elicited by high potassium or both. Representative measurements of dynamic Fluo-4 fluorescence for (b) six fibroblasts and (c) four 5TF cells. d In vitro insulin secretion by 5TF cells. ELISA determination of secreted human insulin by control fibroblasts (n = 4–13) and 5TF cells (n = 16) under non-stimulatory conditions (glucose 2 mM) and under stimulatory conditions (glucose 20 mM). Data are mean ± SEM and correspond to six independent reprogramming experiments, 2–4 biological replicates per experiment.
Fig. 5
Fig. 5. Generation and transcriptomic characterization of 5TF cell spheroids.
a Schematic representation of the modified 5TF protocol (5TF-3D): cells were moved from 2D to 3D culture during the last three days (days 7–10) of the protocol. Representative bright field image of 5TF cell spheroids. Scale bar, 100 μm. b Representative immunofluorescence image showing insulin staining in red and nuclei in blue (marked with Hoechst) of a 5TF cell spheroid at the end of the reprogramming protocol. Scale bar is 50 μm. c qPCR of the indicated genes in 5TF cell spheroids. Transcript levels are expressed as fold relative to levels in 5TF cells maintained in 2D culture throughout the 10-day protocol (given the value of 1, dotted line). Data are mean ± SEM for n = 4–12. *P < 0.05, **P < 0.01, ***P < 0.001 relative to 2D culture using one-sample t-test. Fold-change differences in expression levels between human islets and 3D-5TF reprogrammed cells are shown in the upper yellow box. d Heat map of differentially expressed genes between parental fibroblasts (C) and 5TF cell spheroids (n = 3 reprogramming experiments). e GSEA plots on indicated gene sets and pathways. f Dot plots showing the enrichment analysis on Gene Ontology (GO) and KEGG categories of differentially expressed genes (gained in red, lost in blue) between fibroblasts (C) and 5TF cells. The X-axis represents the adjusted p value, the size of the dot represents the number of enriched genes (count) and the color intensity of the dots represents the percentage of hits in each category. g GSEA plot on β-cell disallowed genes. h Relative expression levels of β-cell disallowed genes repressed in 5TF cell spheroids as compared to fibroblasts (given the value of 1) based on RNA-seq data normalized expression values. Data are mean ± SEM (n = 3). Insets show mRNA expression of the indicated genes in untreated control fibroblasts (n = 5), 5TF cell spheroids (n = 6) and human islets (n = 5) as assessed by qPCR. Expression levels were calculated relative to TBP. Data are mean ± SEM. *P < 0.05, **P < 0.01 relative to control fibroblasts using unpaired t-test.
Fig. 6
Fig. 6. Insulin secretion by 5TF cell spheroids.
a Representative confocal images of 5TF cell spheroids immunostained with the indicated antibodies. Scale bar, 10 μm. b Conventional transmission electron microscopy showing a representative image of a 5TF cell spheroid. Prototypical electron dense secretory vesicles (asterisks) are observed dispersed in the cytoplasm. Well-preserved mitochondria (mit), endoplasmic reticulum (ER), Golgi membranes (G) and lipid droplets (LD) are also observed. Inset shows a detail of a secretory vesicle with an average diameter of 450 nm. N, nucleus. Scale bars are 200 nm (inset) and 500 nm. c In vitro glucose-induced insulin secretion by 5TF cell spheroids (n = 14, from 8 reprogramming experiments). Secretion by control spheroids composed of parental fibroblasts (n = 5) is also shown. d Glucose stimulation Index (ratio between insulin secreted at 20 mM glucose vs. 2 mM glucose) of 5TF cells maintained in 2D or in 3D (spheroid) cultures (n = 16–18, from 8 to 10 reprogramming experiments). e Glucose dose curve of insulin secretion by 5TF cell spheroids (n = 4–12, 5 reprogramming experiments). Data are presented as the mean ± SEM for the number of n indicated in parentheses. *P < 0.05; ***P < 0.001 between the indicated conditions using unpaired t-test (c), one sample t-test (d) or one-way ANOVA (e).
Fig. 7
Fig. 7. In vivo characterization of 5TF cell spheroids.
a Schematic illustration and image showing 5TF cell spheroids transplanted into the anterior chamber of the eye (ACE) of a normoglycemic NSG mouse. b Vascularization of 5TF cell grafts ten days following transplantation into the ACE. Representative in vivo image depicting functional vessels (RITC-dextran, red) and viable 5TF cells (CFDA, green). Scale bar, 100 μm. c qPCR of INS and TBP transcripts in eyes of non-transplanted mice (nt, n = 3) and mice transplanted with either control fibroblast spheroids (C, n = 3) or 5TF cell spheroids (n = 5) collected ten days post-transplantation. INS gene expression in 5TF cell spheroids prior to transplantation is depicted in the blue bar (n = 6). INS gene expression is calculated relative to TBP. Expression of TBP relative to mouse Tbp is shown to prove the presence of human cells in eyes receiving control and 5TF spheroids. Data are presented as mean ± SEM. d Representative immunofluorescence images showing HLA staining in red and insulin staining in green in 5TF cell grafts ten days post-transplantation. Scale bar, 25 μm. e Percentage of cells doubly positive for insulin and HLA (relative to total HLA + cells) in 5TF cell grafts at day 10 following transplantation. Each dot corresponds to one eye graft (n = 5). f ELISA determination of human insulin in the aqueous humor in un-transplanted mice (n = 7), in mice transplanted with either 300 fibroblast spheroids (n = 14) or 300 5TF cell spheroids (n = 17) at day 10 post-transplantation and in mice transplanted with 150–200 human islets (n = 4) at day 12–15 post-transplantation. Data are presented as mean ± SEM for the number of n indicated in parentheses. ***P < 0.001; ***P < 0.0001 between indicated samples using unpaired t-test.

References

    1. Graf T. Historical origins of transdifferentiation and reprogramming. Cell Stem Cell. 2011;9:504–516. doi: 10.1016/j.stem.2011.11.012. - DOI - PubMed
    1. Vierbuchen T, Wernig M. Molecular roadblocks for cellular reprogramming. Mol. Cell. 2012;47:827–838. doi: 10.1016/j.molcel.2012.09.008. - DOI - PMC - PubMed
    1. Xu J, Du Y, Deng H. Direct lineage reprogramming: strategies, mechanisms, and applications. Cell Stem Cell. 2015;16:119–134. doi: 10.1016/j.stem.2015.01.013. - DOI - PubMed
    1. Zhou Q, Brown J, Kanarek A, Rajagopal J, Melton DA. In vivo reprogramming of adult pancreatic exocrine cells to beta-cells. Nature. 2008;455:627–632. doi: 10.1038/nature07314. - DOI - PMC - PubMed
    1. Li W, et al. long-term persistence and development of induced pancreatic beta cells generated by lineage conversion of acinar cells. Nat. Biotechnol. 2014;32:1223–1232. doi: 10.1038/nbt.3082. - DOI - PubMed

Publication types

MeSH terms