

Reference values for wrist-worn accelerometer physical activity metrics in England children and adolescents
- PMID: 36964597
- PMCID: PMC10039565
- DOI: 10.1186/s12966-023-01435-z
Reference values for wrist-worn accelerometer physical activity metrics in England children and adolescents
Abstract
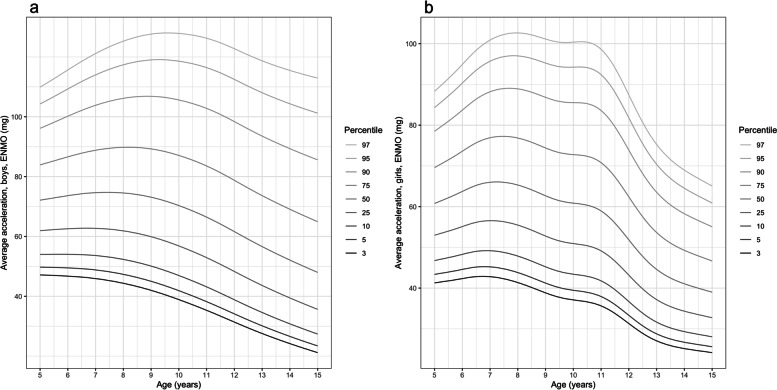
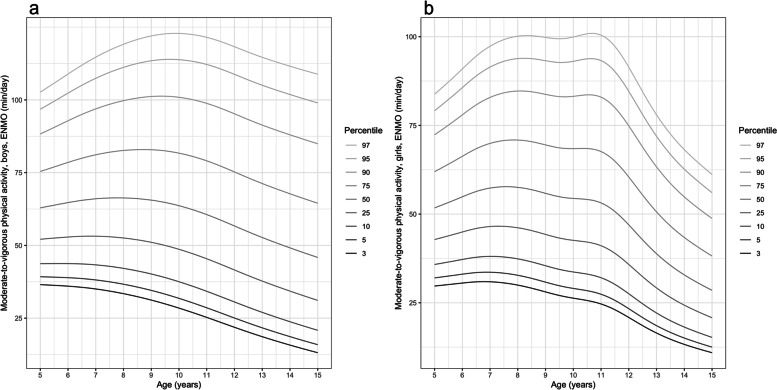
Background: Over the last decade use of raw acceleration metrics to assess physical activity has increased. Metrics such as Euclidean Norm Minus One (ENMO), and Mean Amplitude Deviation (MAD) can be used to generate metrics which describe physical activity volume (average acceleration), intensity distribution (intensity gradient), and intensity of the most active periods (MX metrics) of the day. Presently, relatively little comparative data for these metrics exists in youth. To address this need, this study presents age- and sex-specific reference percentile values in England youth and compares physical activity volume and intensity profiles by age and sex.
Methods: Wrist-worn accelerometer data from 10 studies involving youth aged 5 to 15 y were pooled. Weekday and weekend waking hours were first calculated for youth in school Years (Y) 1&2, Y4&5, Y6&7, and Y8&9 to determine waking hours durations by age-groups and day types. A valid waking hours day was defined as accelerometer wear for ≥ 600 min·d-1 and participants with ≥ 3 valid weekdays and ≥ 1 valid weekend day were included. Mean ENMO- and MAD-generated average acceleration, intensity gradient, and MX metrics were calculated and summarised as weighted week averages. Sex-specific smoothed percentile curves were generated for each metric using Generalized Additive Models for Location Scale and Shape. Linear mixed models examined age and sex differences.
Results: The analytical sample included 1250 participants. Physical activity peaked between ages 6.5-10.5 y, depending on metric. For all metrics the highest activity levels occurred in less active participants (3rd-50th percentile) and girls, 0.5 to 1.5 y earlier than more active peers, and boys, respectively. Irrespective of metric, boys were more active than girls (p < .001) and physical activity was lowest in the Y8&9 group, particularly when compared to the Y1&2 group (p < .001).
Conclusions: Percentile reference values for average acceleration, intensity gradient, and MX metrics have utility in describing age- and sex-specific values for physical activity volume and intensity in youth. There is a need to generate nationally-representative wrist-acceleration population-referenced norms for these metrics to further facilitate health-related physical activity research and promotion.
Keywords: Average acceleration; ENMO; Intensity gradient; MAD; MVPA; MX metrics; Raw data; Youth.
© 2023. The Author(s).
Conflict of interest statement
The authors declare that they have no competing interests.
Figures


References
-
- Ekelund U, Tarp J, Fagerland MW, Johannessen JS, Hansen BH, Jefferis BJ, et al. Joint associations of accelerometer measured physical activity and sedentary time with all-cause mortality: a harmonised meta-analysis in more than 44 000 middle-aged and older individuals. Br J Sports Med. 2020;54(24):1499–1506. doi: 10.1136/bjsports-2020-103270. - DOI - PMC - PubMed
-
- Tarp J, Bugge A, Andersen LB, Sardinha LB, Ekelund U, Brage S, et al. Does adiposity mediate the relationship between physical activity and biological risk factors in youth?: a cross-sectional study from the International Children’s Accelerometry Database (ICAD). Int J Obes. 2018;42:671–8. - PMC - PubMed
-
- Fairclough SJ, Hackett A, Davies I, Gobbi R, Mackintosh K, Warburton G, et al. Promoting healthy weight in primary school children through physical activity and nutrition education: a pragmatic evaluation of the CHANGE! randomised intervention study. BMC Pub Health. 2013;13(1):626. doi: 10.1186/1471-2458-13-626. - DOI - PMC - PubMed
Publication types
MeSH terms
Grants and funding
LinkOut - more resources
Full Text Sources
Research Materials
Miscellaneous
