

Unmixing biological fluorescence image data with sparse and low-rank Poisson regression
- PMID: 36964716
- PMCID: PMC10081874
- DOI: 10.1093/bioinformatics/btad159
Unmixing biological fluorescence image data with sparse and low-rank Poisson regression
Abstract
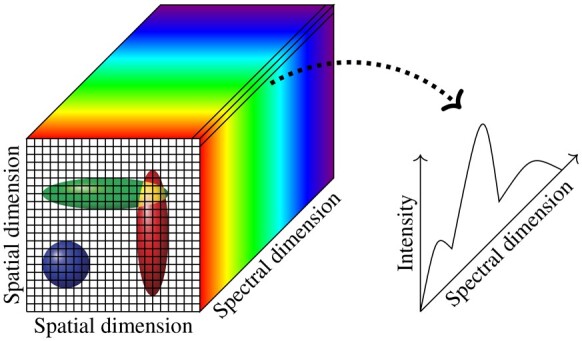
Motivation: Multispectral biological fluorescence microscopy has enabled the identification of multiple targets in complex samples. The accuracy in the unmixing result degrades (i) as the number of fluorophores used in any experiment increases and (ii) as the signal-to-noise ratio in the recorded images decreases. Further, the availability of prior knowledge regarding the expected spatial distributions of fluorophores in images of labeled cells provides an opportunity to improve the accuracy of fluorophore identification and abundance.
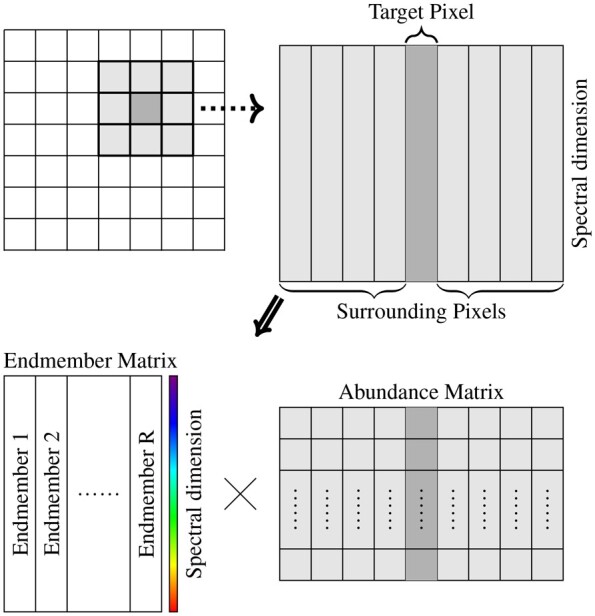
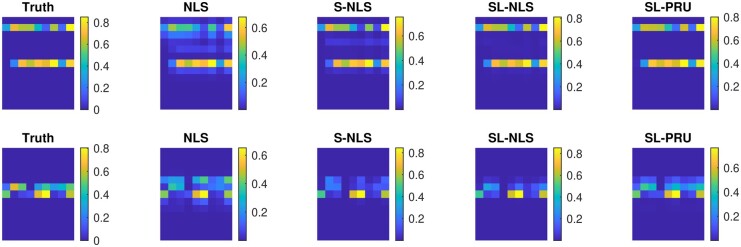
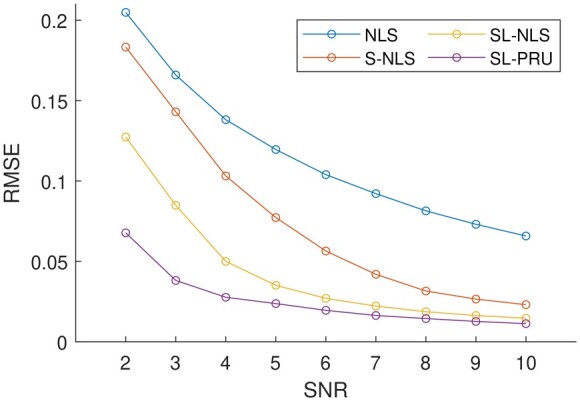
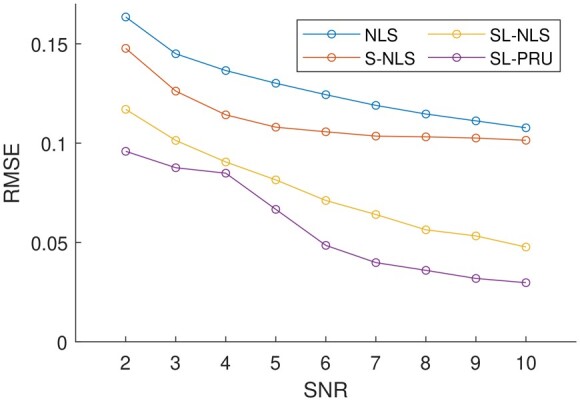
Results: We propose a regularized sparse and low-rank Poisson regression unmixing approach (SL-PRU) to deconvolve spectral images labeled with highly overlapping fluorophores which are recorded in low signal-to-noise regimes. First, SL-PRU implements multipenalty terms when pursuing sparseness and spatial correlation of the resulting abundances in small neighborhoods simultaneously. Second, SL-PRU makes use of Poisson regression for unmixing instead of least squares regression to better estimate photon abundance. Third, we propose a method to tune the SL-PRU parameters involved in the unmixing procedure in the absence of knowledge of the ground truth abundance information in a recorded image. By validating on simulated and real-world images, we show that our proposed method leads to improved accuracy in unmixing fluorophores with highly overlapping spectra.
Availability and implementation: The source code used for this article was written in MATLAB and is available with the test data at https://github.com/WANGRUOGU/SL-PRU.
© The Author(s) 2023. Published by Oxford University Press.
Figures
Update of
-
Unmixing Biological Fluorescence Image Data with Sparse and Low-Rank Poisson Regression.bioRxiv [Preprint]. 2023 Jan 18:2023.01.06.523044. doi: 10.1101/2023.01.06.523044. bioRxiv. 2023. Update in: Bioinformatics. 2023 Apr 3;39(4):btad159. doi: 10.1093/bioinformatics/btad159. PMID: 36711559 Free PMC article. Updated. Preprint.
References
-
- Bioucas-Dias JM, Figueiredo MA. Alternating direction algorithms for constrained sparse regression: Application to hyperspectral unmixing. In: 2010 2nd Workshop on Hyperspectral Image and Signal Processing: Evolution in Remote Sensing, Reykjavik, Iceland, 14-16 June 2010. IEEE. 2010, 1–4.
-
- Candes EJ, Wakin MB, Boyd SP. Enhancing sparsity by reweighted minimization. J Fourier Anal Appl 2008;14:877–905.
-
- Coates P. Photomultiplier noise statistics. J Phys D Appl Phys 1972;5:915–30.
-
- Giampouras PV, Themelis KE, Rontogiannis AA. et al. Simultaneously sparse and low-rank abundance matrix estimation for hyperspectral image unmixing. IEEE Trans Geosci Remote Sensing 2016;54:4775–89.
Publication types
MeSH terms
Substances
Grants and funding
LinkOut - more resources
Full Text Sources
Molecular Biology Databases
