. 2023 Oct;36(5):797-813.
doi: 10.1007/s10334-023-01076-0. Epub 2023 Mar 25.

Prediction of motion induced magnetic fields for human brain MRI at 3 T

Affiliations

Prediction of motion induced magnetic fields for human brain MRI at 3 T

Jiazheng Zhou et al. MAGMA. 2023 Oct.

Abstract

Objective: Maps of B0 field inhomogeneities are often used to improve MRI image quality, even in a retrospective fashion. These field inhomogeneities depend on the exact head position within the static field but acquiring field maps (FM) at every position is time consuming. Here we propose a forward simulation strategy to obtain B0 predictions at different head-positions.

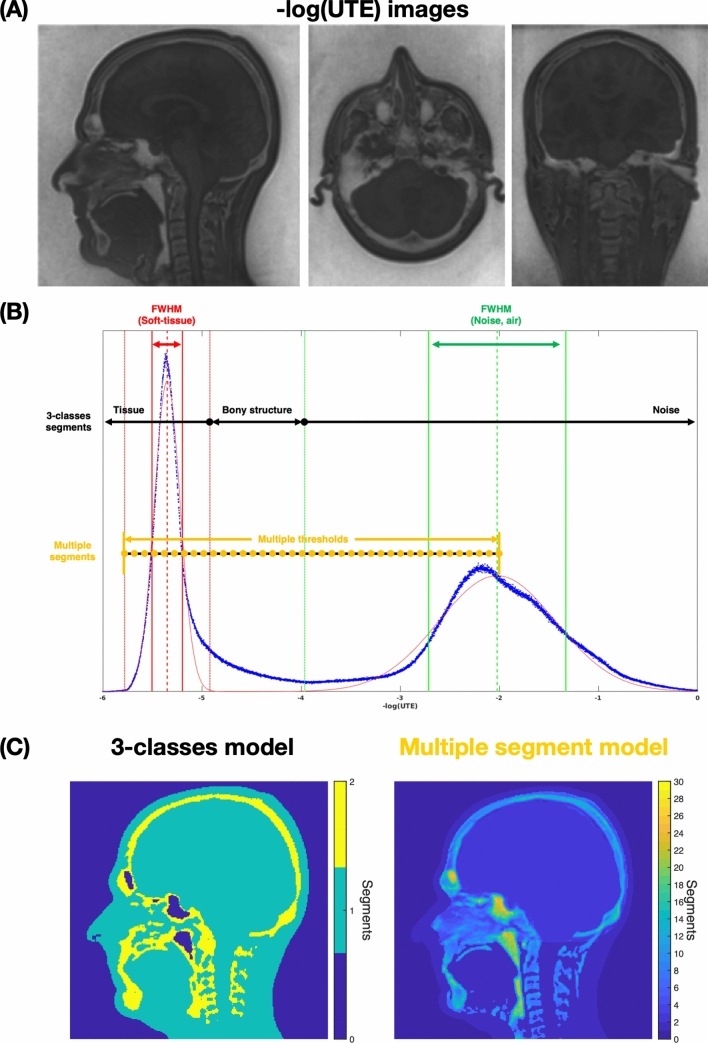
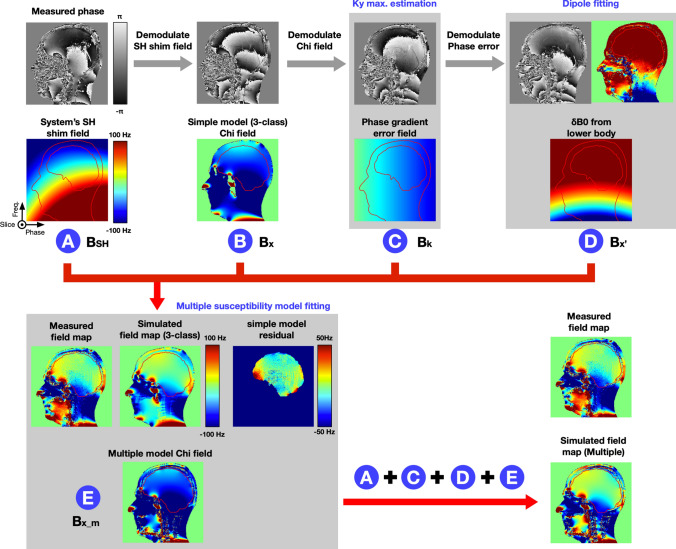
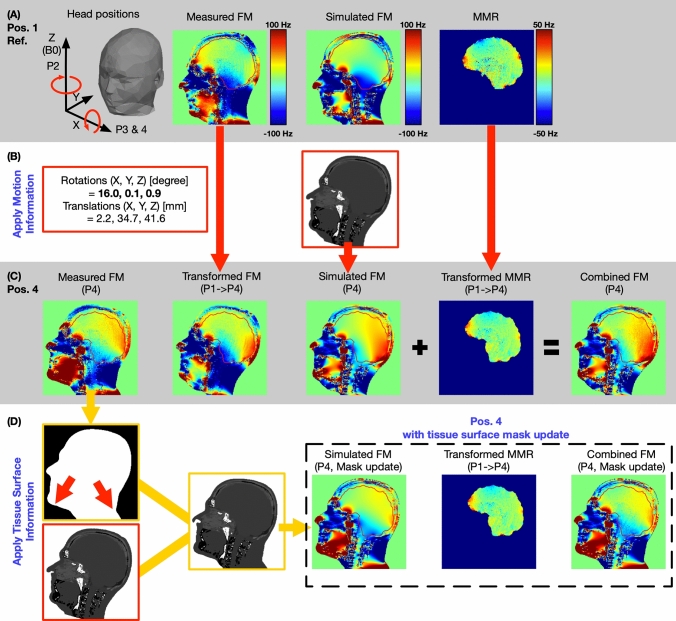
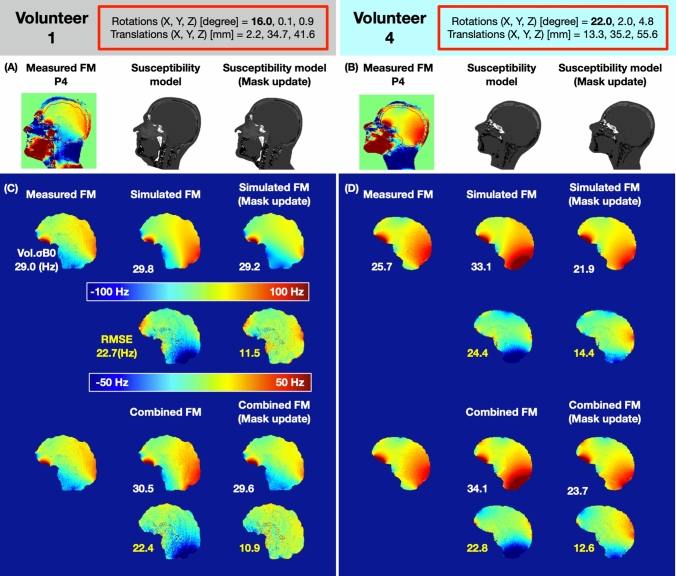
Methods: FM were predicted by combining (1) a multi-class tissue model for estimation of tissue-induced fields, (2) a linear k-space model for capturing gradient imperfections, (3) a dipole estimation for quantifying lower-body perturbing fields (4) and a position-dependent tissue mask to model FM alterations caused by large motion effects. The performance of the combined simulation strategy was compared with an approach based on a rigid body transformation of the FM measured in the reference position to the new position.

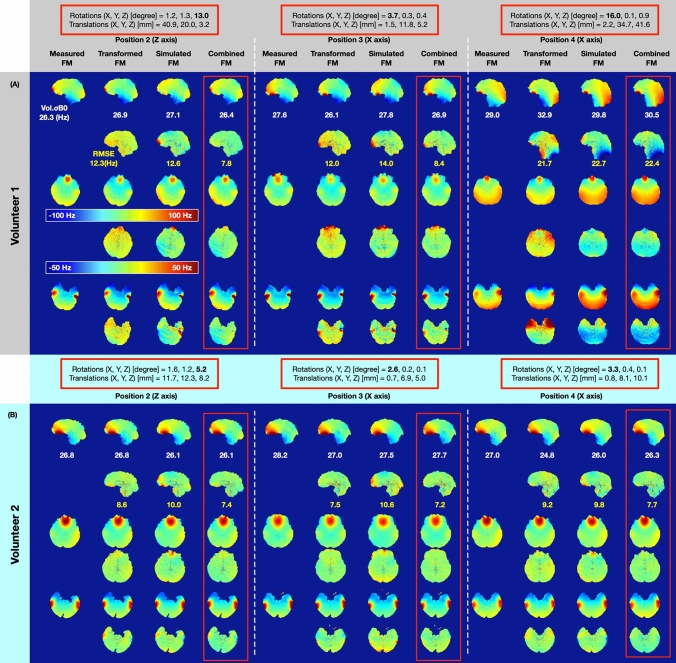
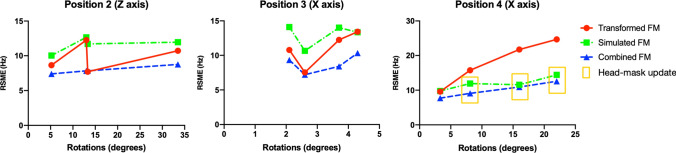
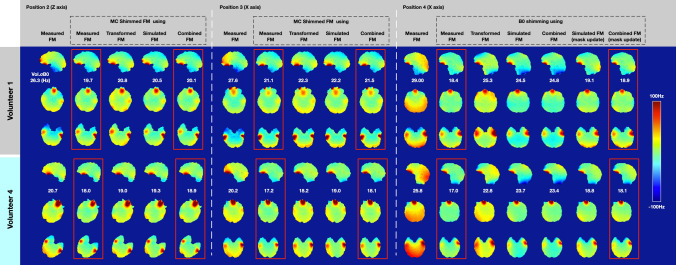
Results: The transformed FM provided inconsistent results for large head movements (> 5° rotation, approximately), while the simulation strategy had a superior prediction accuracy for all positions. The simulated FM was used to optimize B0 shims with up to 22.2% improvement with respect to the transformed FM approach.

Conclusion: The proposed simulation strategy is able to predict movement-induced B0 field inhomogeneities yielding more precise estimates of the ground truth field homogeneity than the transformed FM.

Keywords: B0 homogeneity; Head motion; Susceptibility model; UTE.


Figures

Fig. 1
Fig. 1
The threshold-based air, bone, and soft tissue segmentation of inverting the logarithmically scaled UTE dataset. A Three orthogonal views of the inverted logarithmically scaled UTE image, with full range [− 7,0]. B The image histogram with two distinctive peaks as soft-tissue (left) and noise (right) signals. Gaussian-fitting results with center peak (dashed line) and full-width-half-maximum (FWHM) information (dashed lines) for soft-tissue (red) and noise (green). The 3-class segment model is based on the bone signal threshold [Center (soft) + 1.4*FWHM (soft), Center (noise)-1.4*FWHM (noise)], which is positioned in between the two peaks, leading more toward soft tissue. The multiple segment model is defined as a linear interval between [Center (soft)-1.4*FWHM (soft): 0.1: Center (noise)]. C Middle sagittal slices of 3-classes segment model and multiple segment model
Fig. 2
Fig. 2
Schematic of simulated field map. The simulation field map is based on a 5 steps magnetic field estimation: A the system SH shim field is calculated from the SH shim coefficients; B the forward approximated sample induced Bχ field; C Linear phase errors by the imaging gradients; D Dipole approximation of the Bχ’ field from the lower body part; E Susceptibility model fitting to reduce the simulation residual error with the Bχ_m field
Fig. 3
Fig. 3
A Schematic of the iterative fitting algorithm. B The simple model residual field map, SMR, when using a 3-class susceptibility map. C The multiple segment model with additional spatial anatomical constrains. D The multiple model residual field map, MMR, when using a fitted susceptibility map E The fitted susceptibility map for one volunteer
Fig. 4
Fig. 4
A, B, C illustrates the calculation of transformed FM, simulated FM, and combined FM from a reference position (Position 1) to a new head position (Position 4). The transform FM utilizes the measured FM in reference position with a simple rigid-body transform operation. The absolute rotation and translation values have been marked in red squares. The simulated FM is calculated from the forward B0 approximation, with a rigid-body transformed susceptibility map. The combined FM adds a rigid-body transform MMR field map from Position 1 into the simulated FM at a new head position. C and D, show the process of susceptibility map mask adjustment when the large head rotation on X-axis causes subject tissue boundary changes. The updated head-mask is calculated from the measured field map at Position 4 and applied to the rigid body transformed susceptibility map. For large head movement, the simulated FM and combined FM were recalculated using the head-mask updated susceptibility map (dash square). The red arrow indicates the mask displacement
Fig. 5
Fig. 5
Four volunteers simulation results at the reference position. First row: Measured field maps, color range [− 100 Hz, 100 Hz]; Second row: Simulated field maps, color range [− 100 Hz, 100 Hz]; Third row: Residual field maps (Measured—Simulated), color range [− 50 Hz, 50 Hz]; Bottom row: Fitted susceptibility maps, color range [− 12 ppm, 0 ppm]
Fig. 6
Fig. 6
Motion induced field map estimation comparison in three representative slices from two subjects. The Vol. σB0 of the field map and RMSE of the estimated strategies were reported. The absolute rotation and translation values have been marked in red squares
Fig. 7
Fig. 7
Mask updated susceptibility models used for Position 4 in two volunteers. A Mask of volunteer 1 tissue boundary update process. B Mask of volunteer 2 tissue boundary update process. C Compare the simulation improvement (RMSE) by introducing the new subject tissue boundary for volunteer 1 (the second row vs. the third row). D Compare the simulation improvement (RMSE) by introducing the new subject tissue boundary for volunteer 2 (the second row vs. the third row). The absolute rotation and translation values have been marked in red squares
Fig. 8
Fig. 8
Comparison of prediction performance between the rigid-body transform, the simulation, and the combined strategies at multiple head angles. The yellow window indicates the simulation and combined strategies with subject head-mask update
Fig. 9
Fig. 9
Global shimming simulation off-resonance magnetic field maps at three representative slices from two volunteers. For positions 2 and 3, the first column is the target measured FM for B0 shimming. The second column to the fifth column compared the residual field map after B0 shimming with proposed strategies, where the second column used the measured FM itself as the baseline. For position 4, additional B0 shimming results using the mask update susceptibility model is compared with the B0 shimming result using measured field FM

References

    1. Jezzard P, Clare S. Sources of distortion in functional MRI data. Hum Brain Mapp. 1999;8:80–85. doi: 10.1002/(SICI)1097-0193(1999)8:2/3<80::AID-HBM2>3.0.CO;2-C. - DOI - PMC - PubMed
    1. Glover GH. 3D Z-shim method for reduction of susceptibility effects in BOLD fMRI. Magn Reson Med. 1999;42:290–299. doi: 10.1002/(SICI)1522-2594(199908)42:2<290::AID-MRM11>3.0.CO;2-N. - DOI - PubMed
    1. Stenger VA, Boada FE, Noll DC. Three-dimensional tailored RF pulses for the reduction of susceptibility artifacts in T2/(*)-weighted functional MRI. Magn Reson Med. 2000;44:525–531. doi: 10.1002/1522-2594(200010)44:4<525::AID-MRM5>3.0.CO;2-L. - DOI - PMC - PubMed
    1. Jezzard P, Balaban RS. Correction for geometric distortion in echo planar images from b0 field variations. Magn Reson Med. 1995;34:65–73. doi: 10.1002/mrm.1910340111. - DOI - PubMed
    1. Stockmann JP, Wald LL. In vivo B0 field shimming methods for MRI at 7 T. Neuroimage. 2018;168:71–87. doi: 10.1016/j.neuroimage.2017.06.013. - DOI - PMC - PubMed