. 2023 May:296:122093.
doi: 10.1016/j.biomaterials.2023.122093. Epub 2023 Mar 17.

A ciprofloxacin derivative with four mechanisms of action overcomes paclitaxel resistance in p53-mutant and MDR1 gene-expressing type II human endometrial cancer

Affiliations

A ciprofloxacin derivative with four mechanisms of action overcomes paclitaxel resistance in p53-mutant and MDR1 gene-expressing type II human endometrial cancer

Suhaila O Alhaj-Suliman et al. Biomaterials. 2023 May.

Abstract

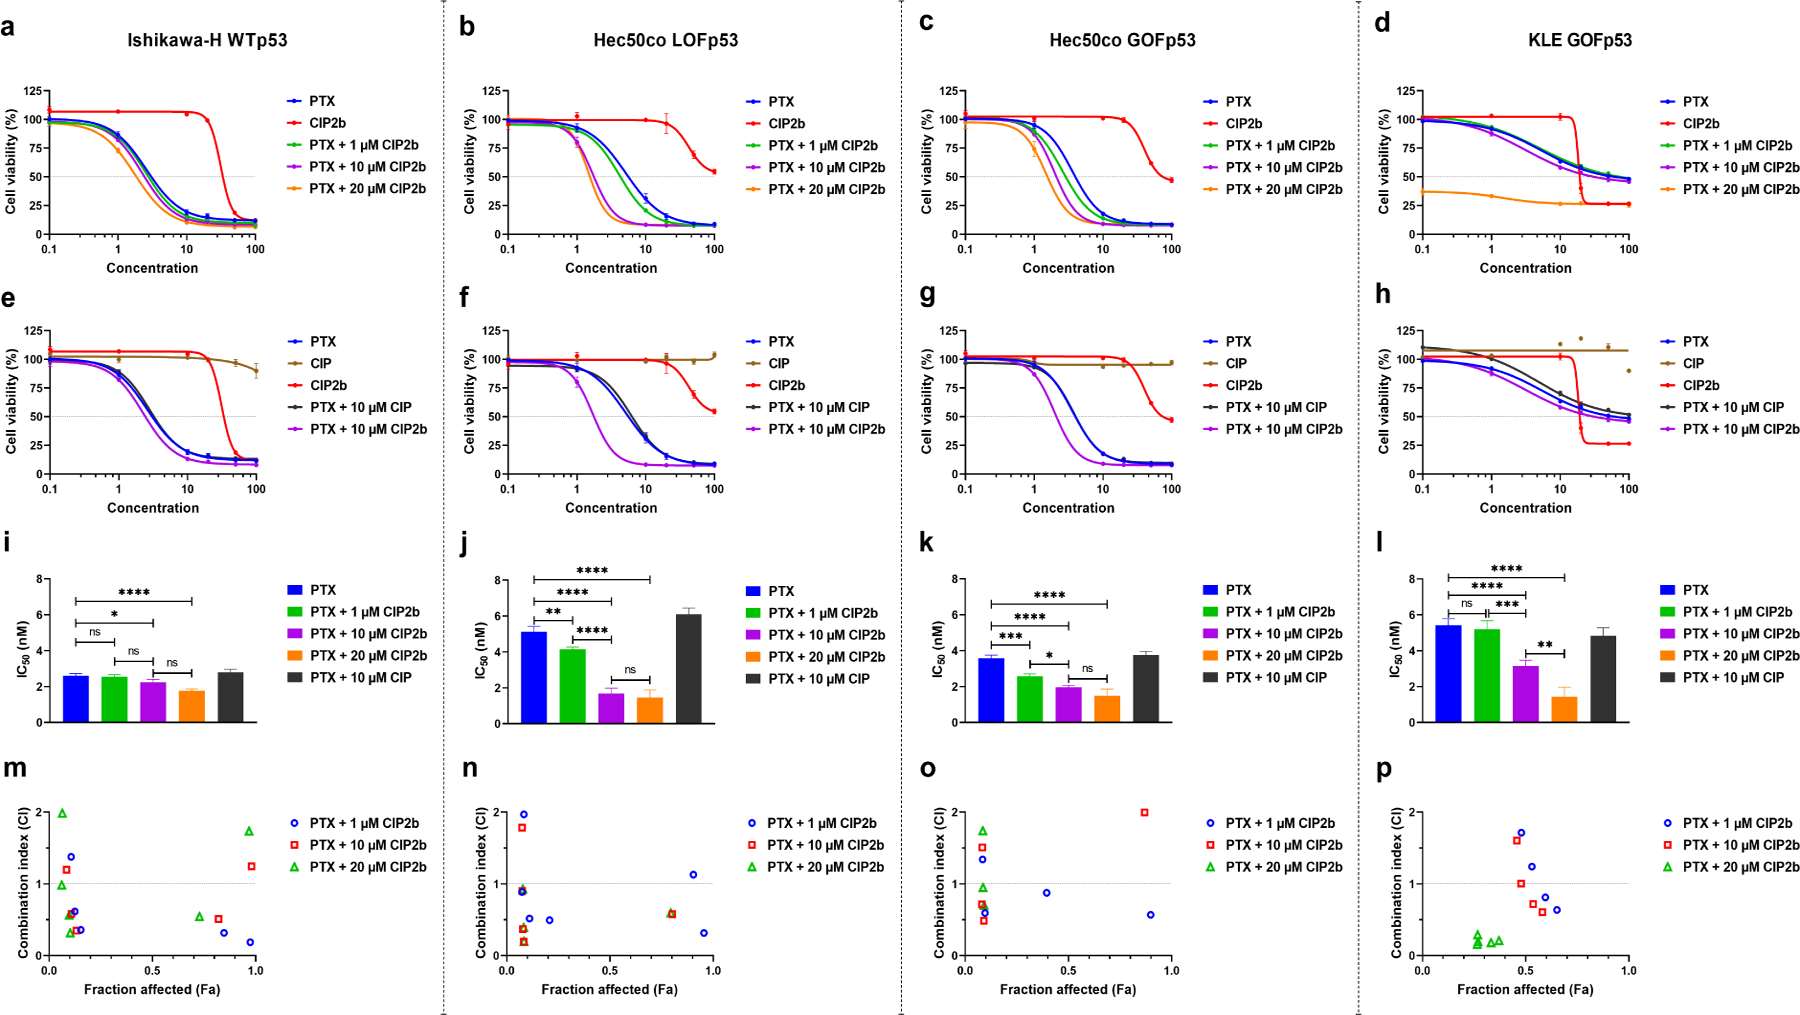
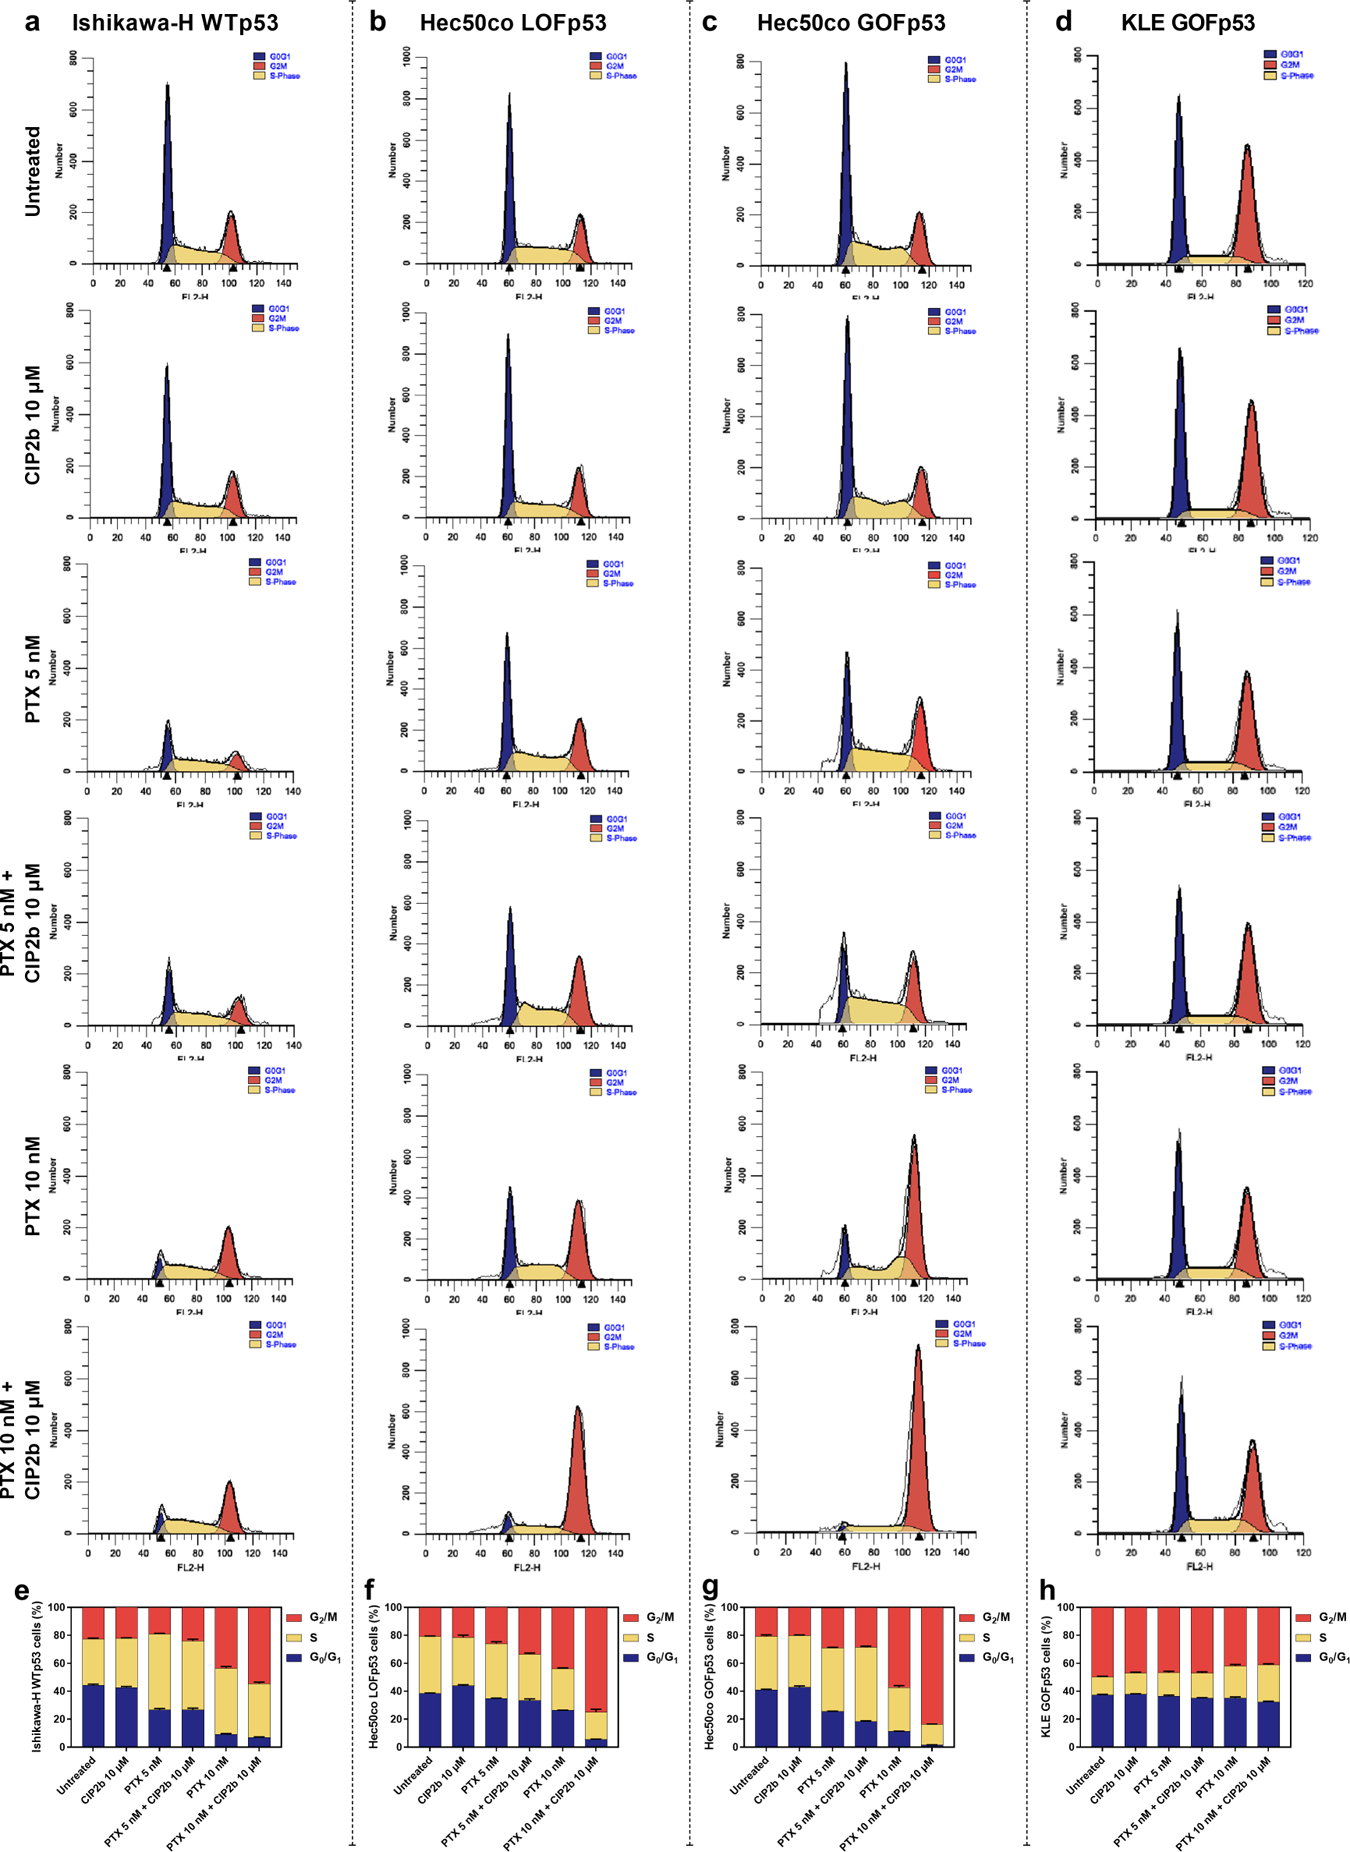
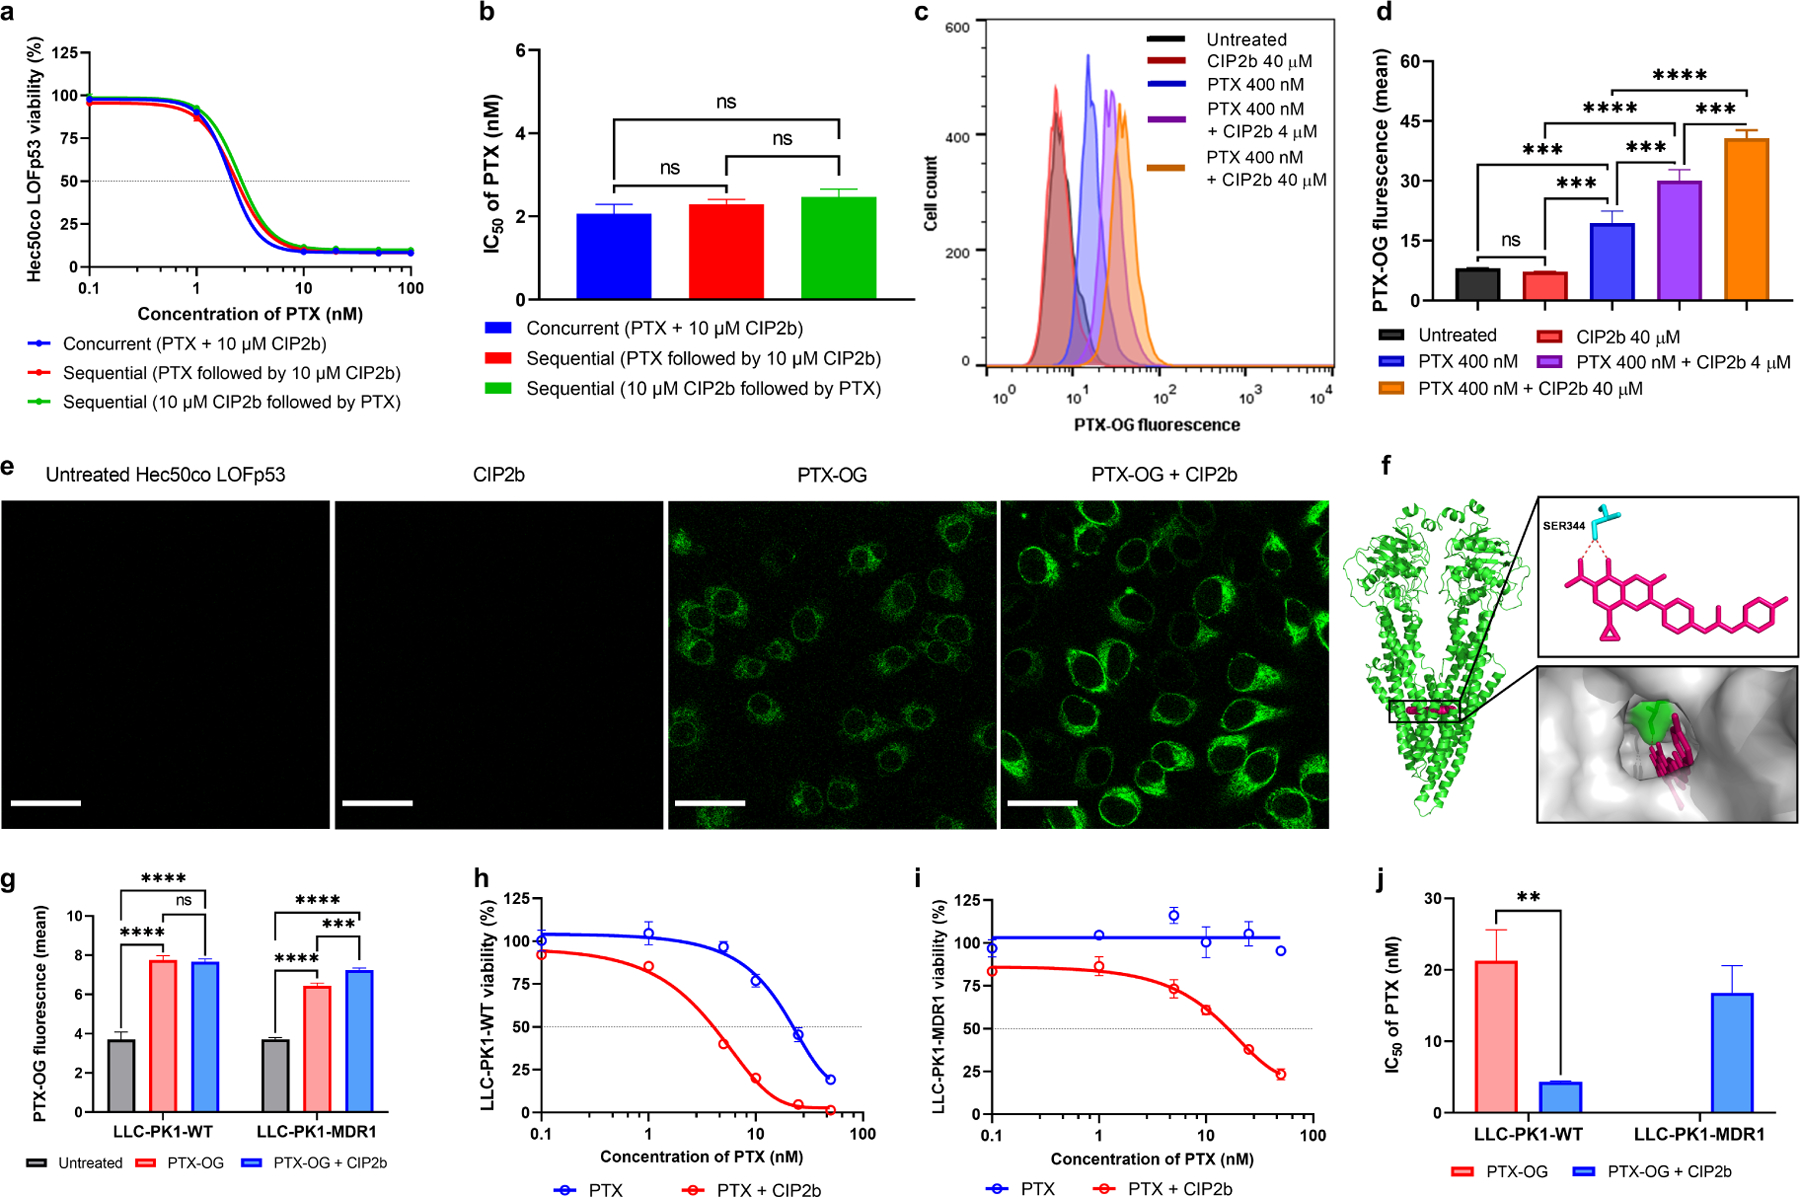
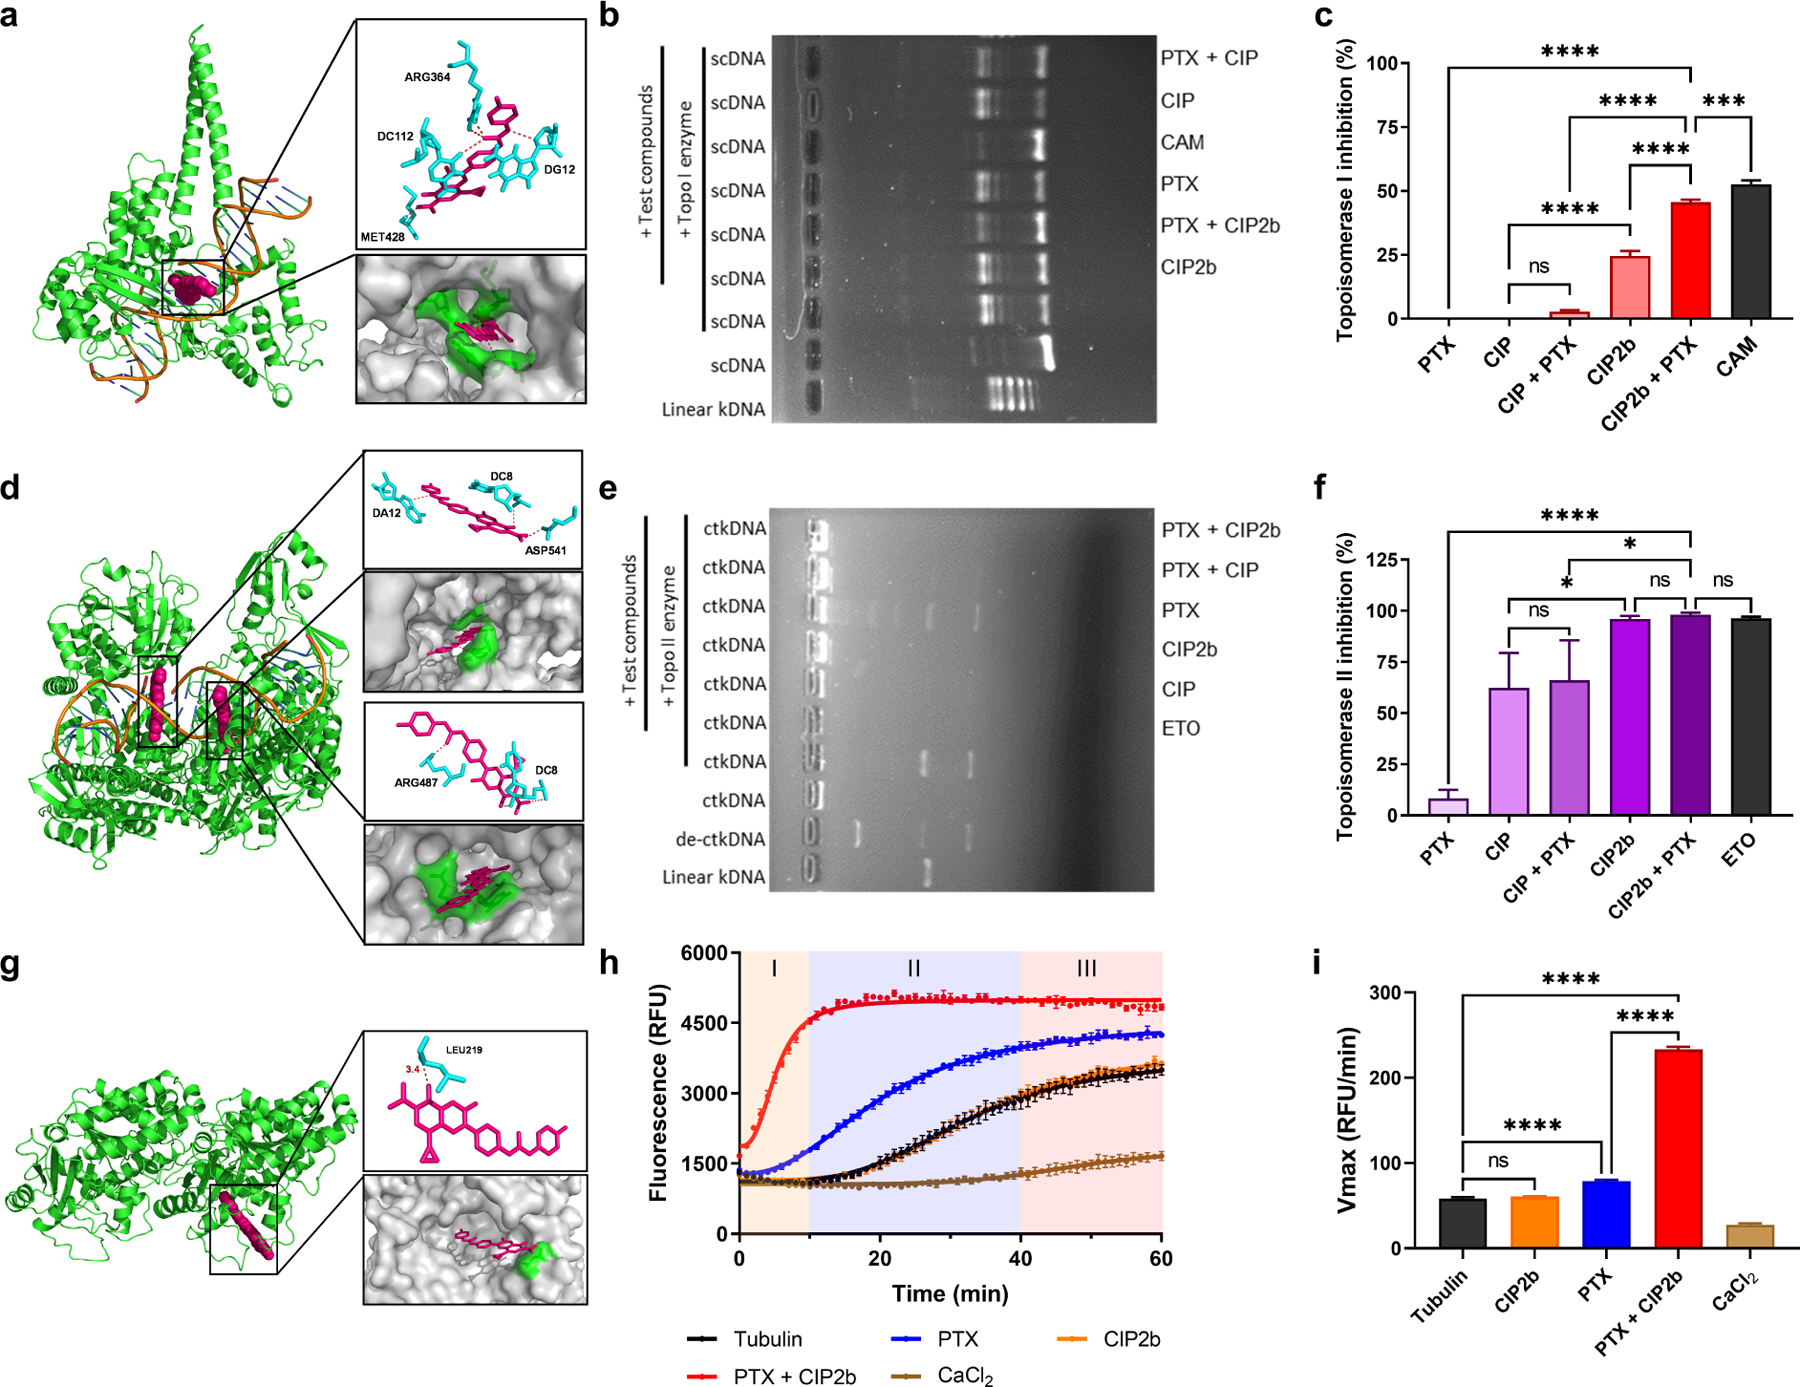
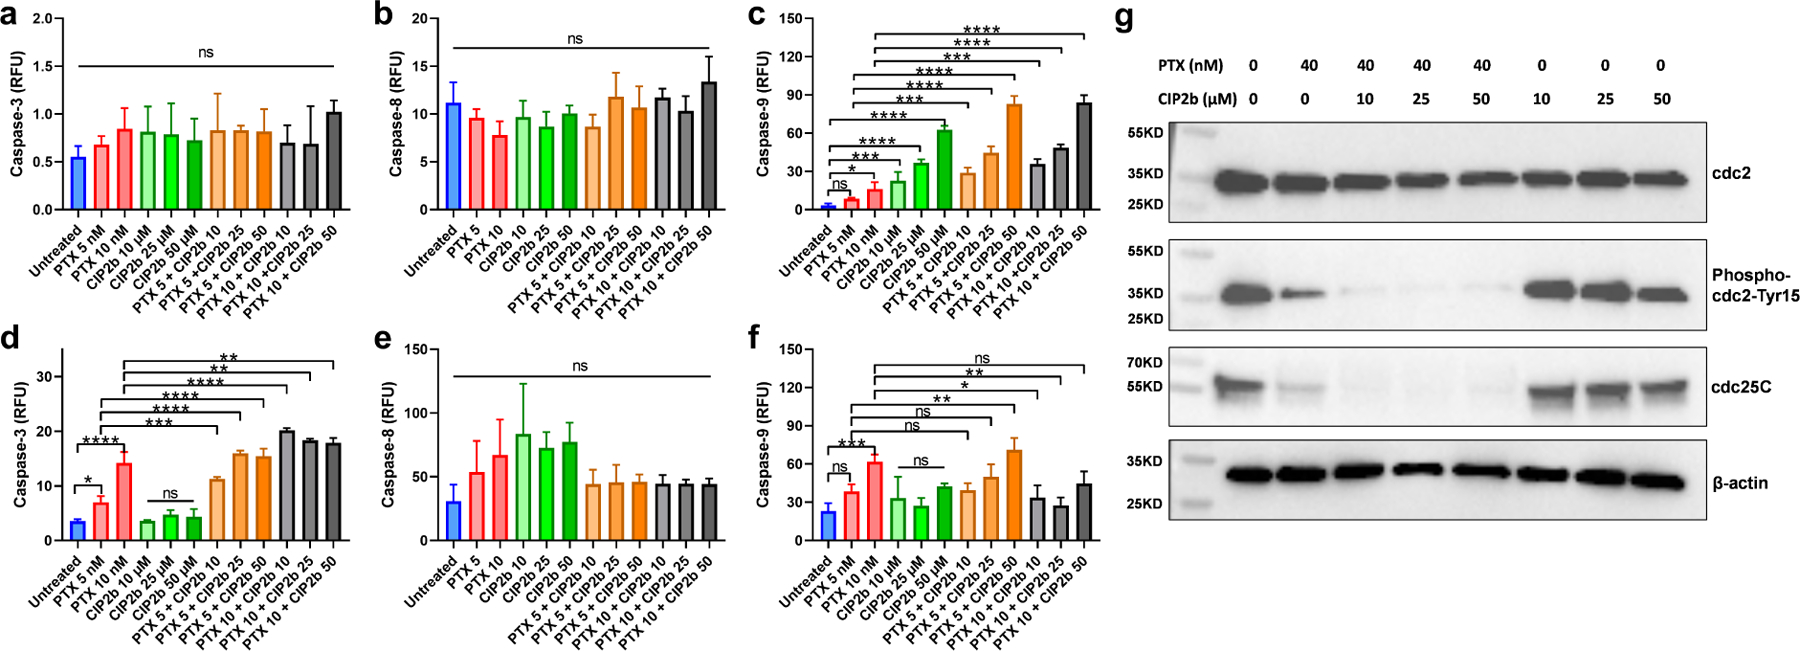
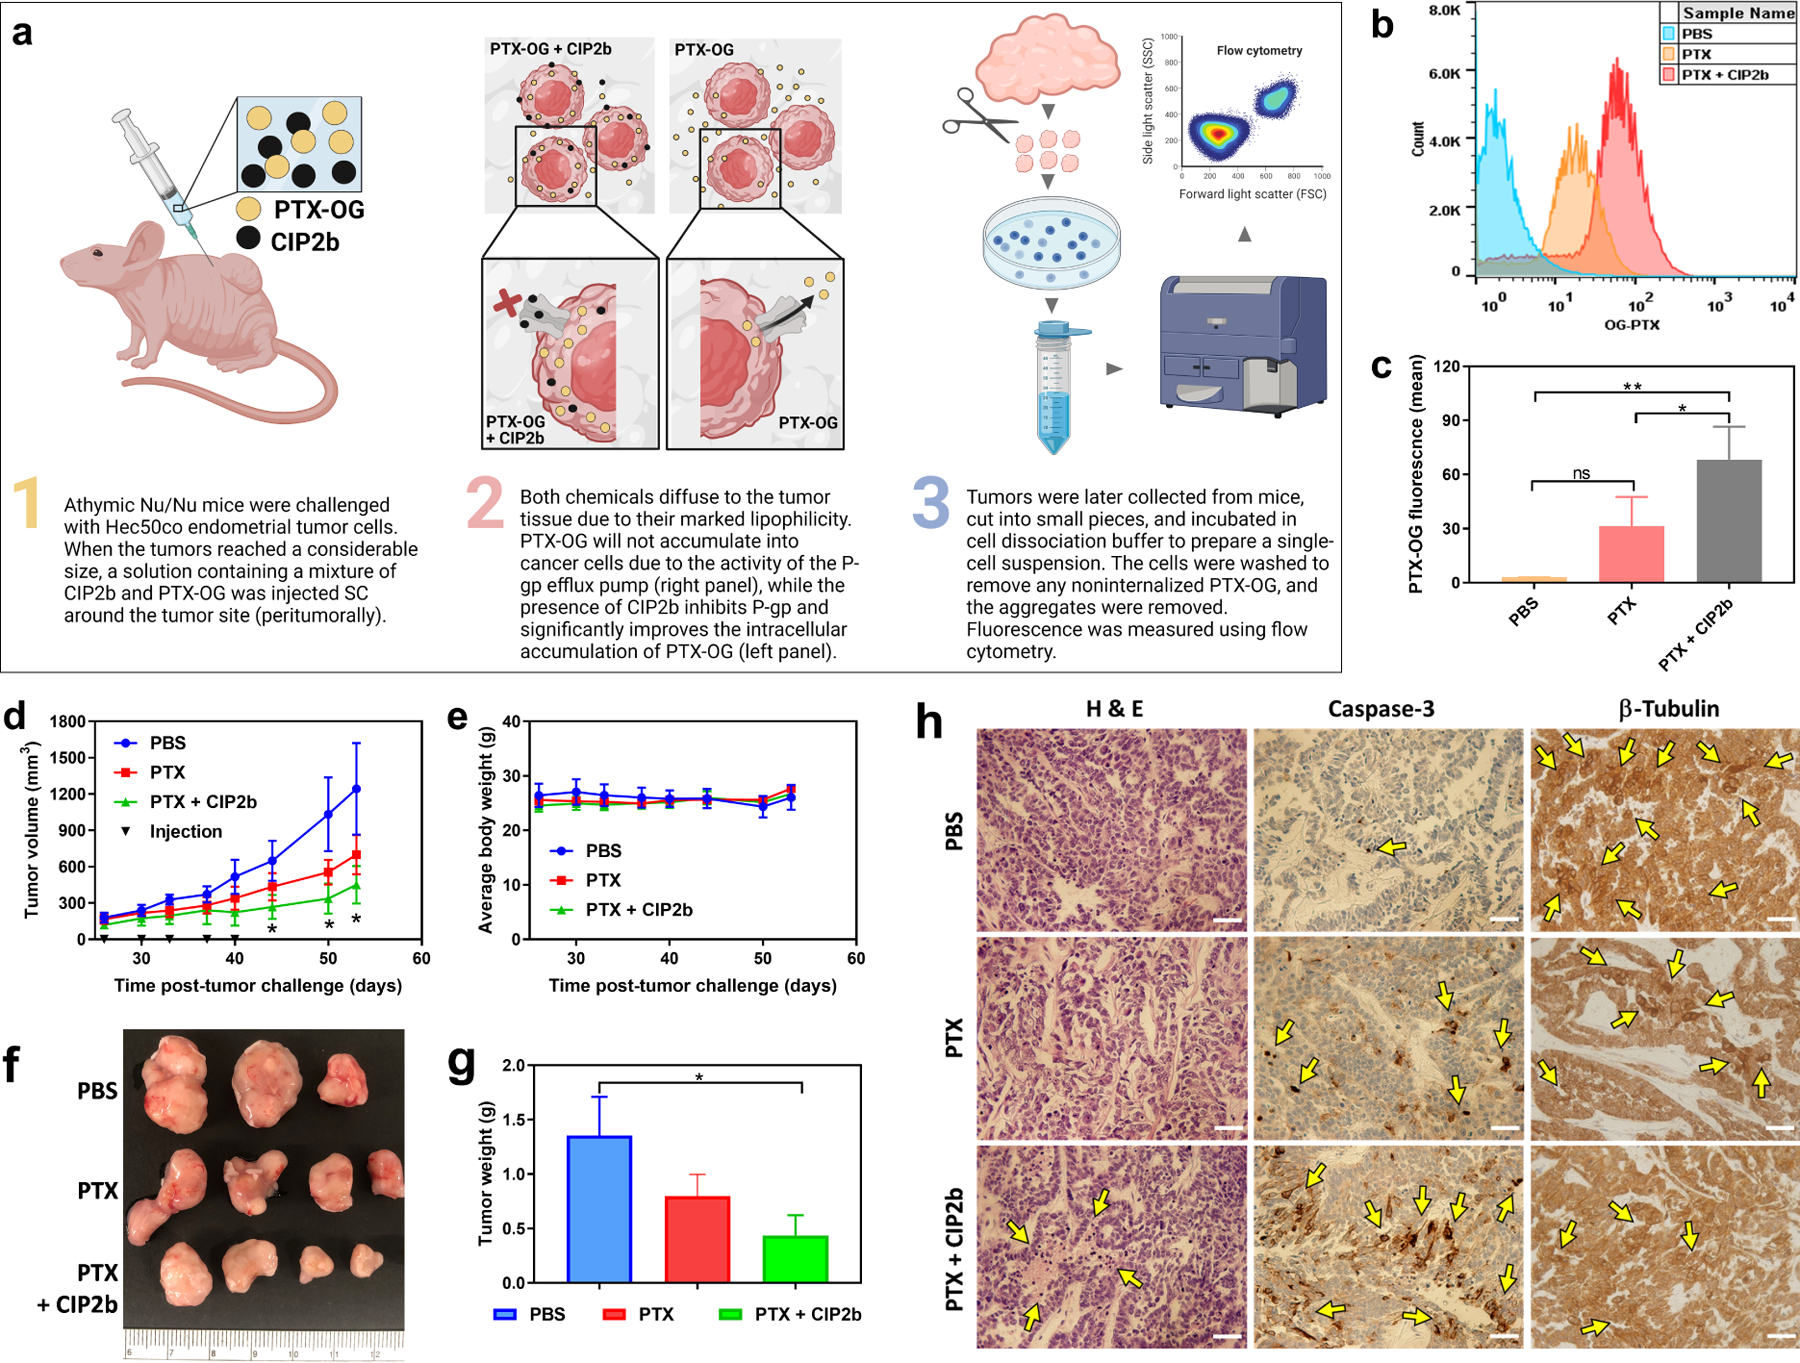
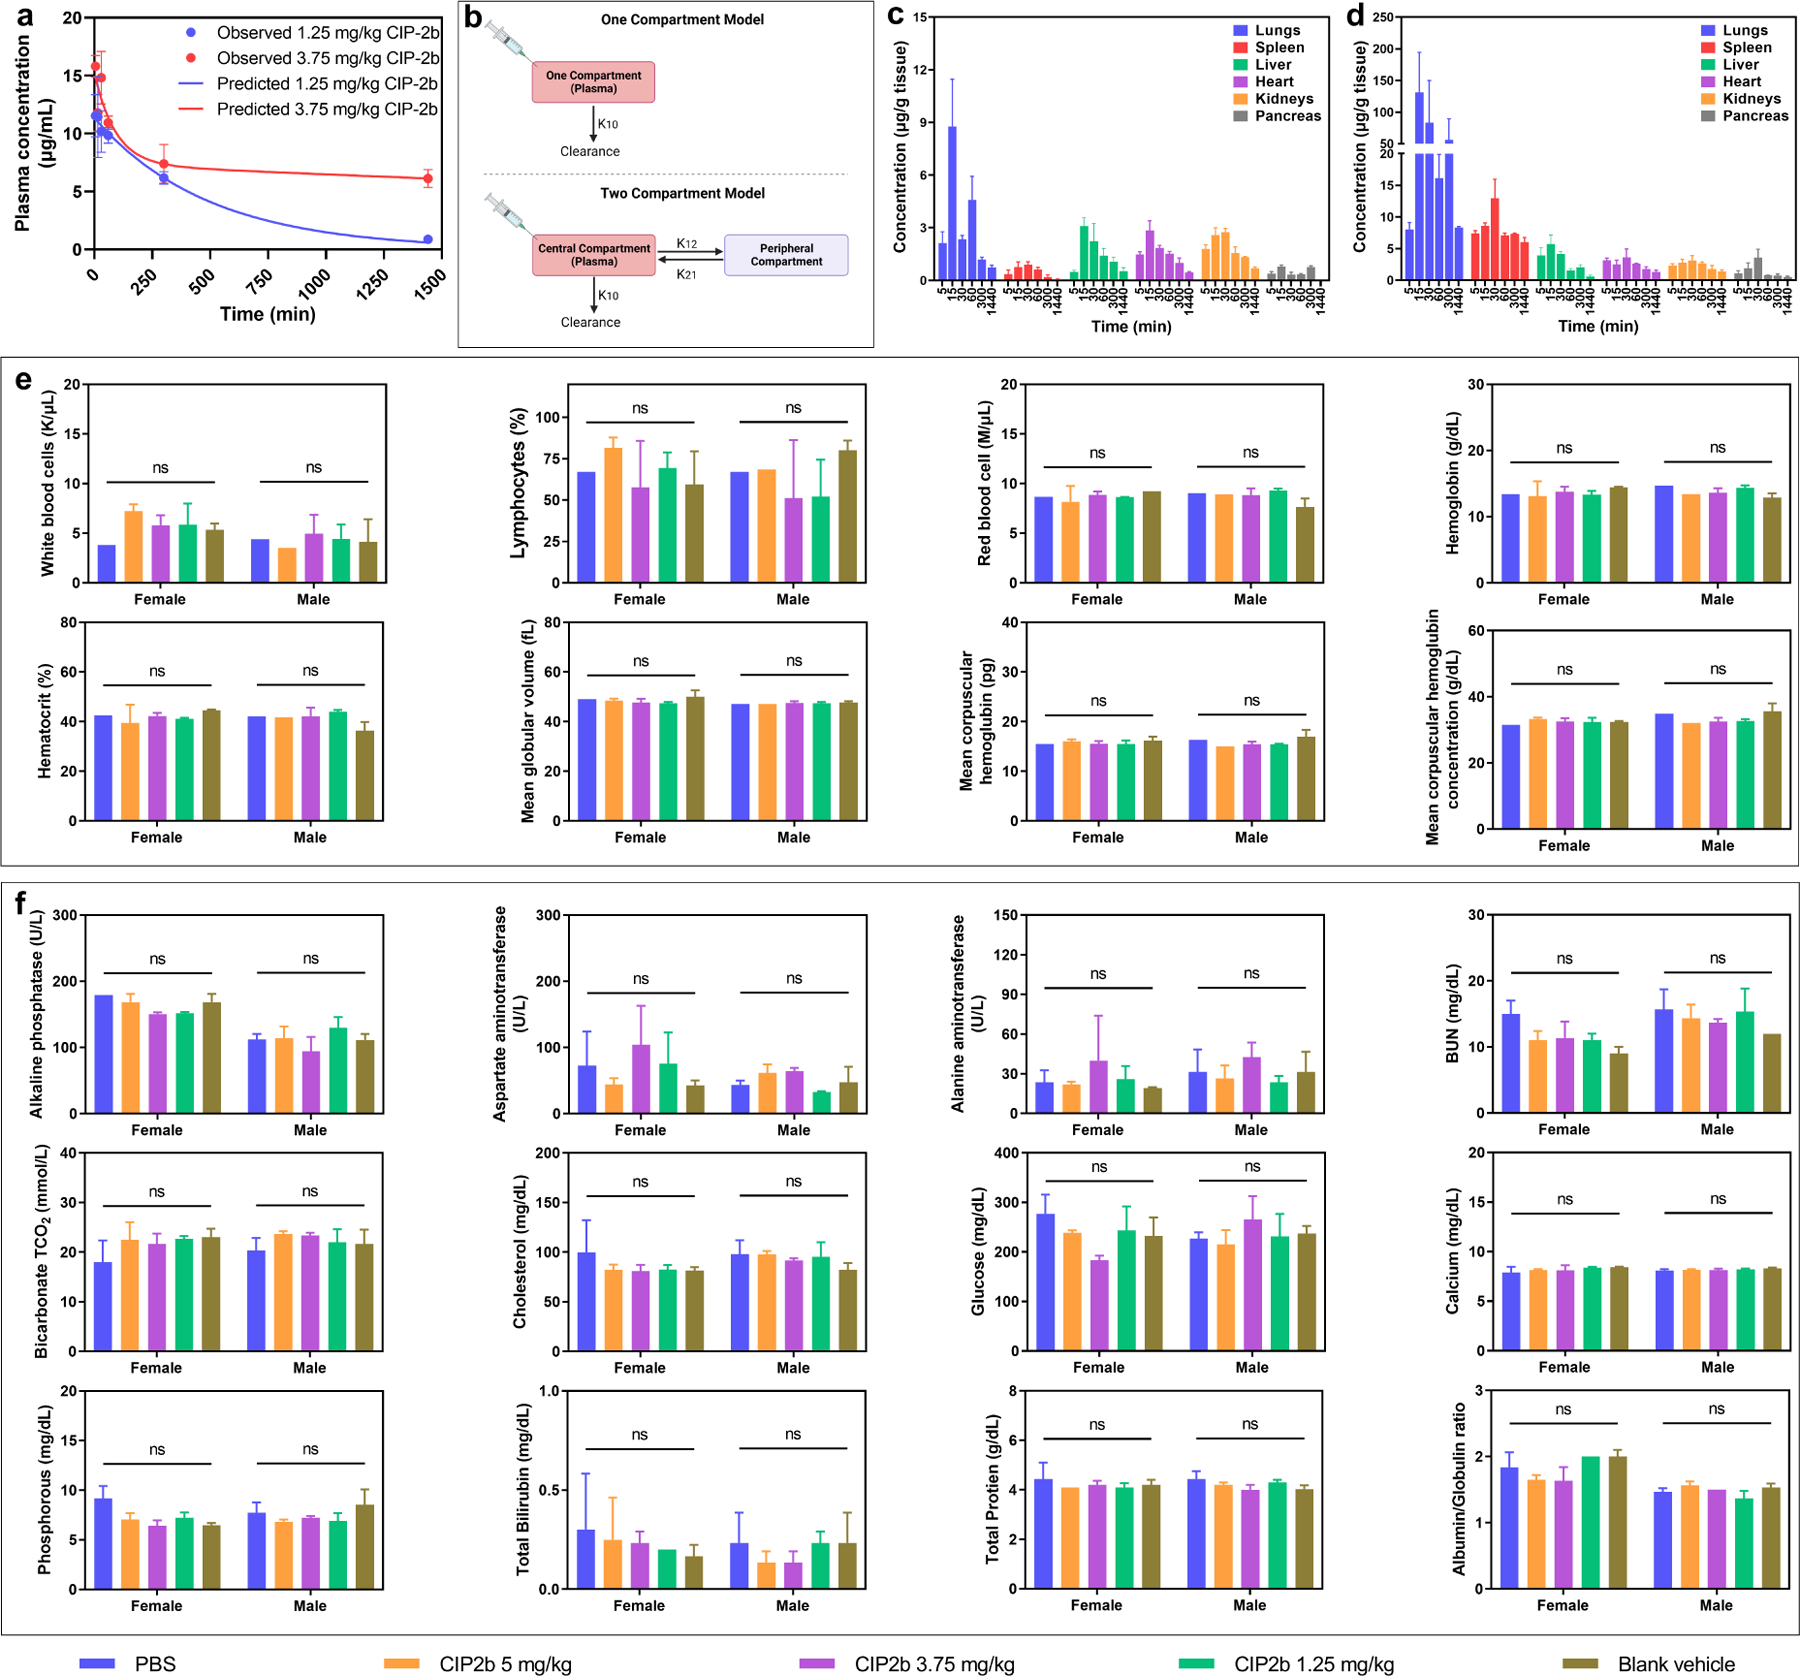
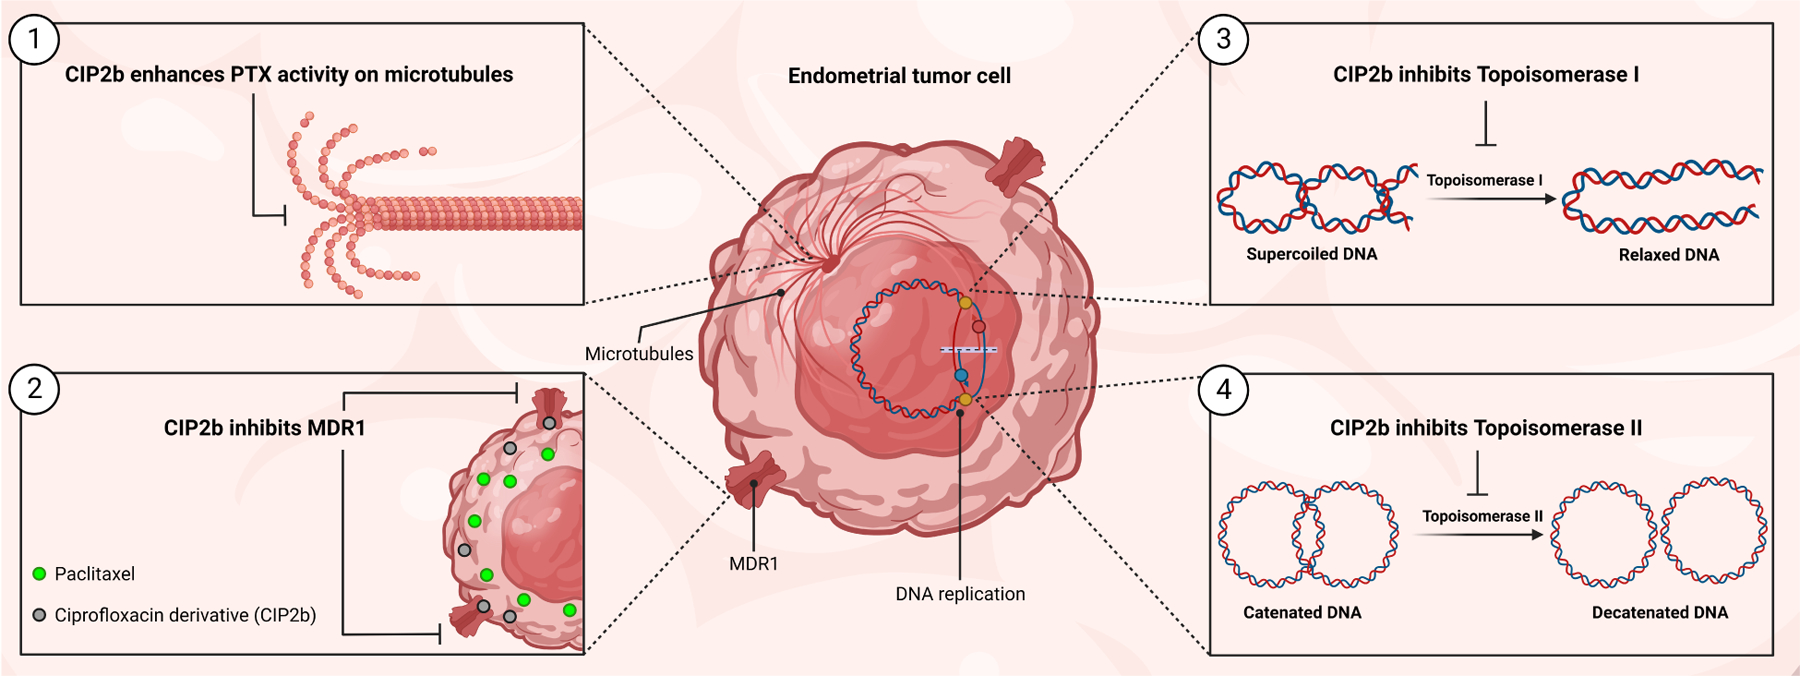
Dysfunction of the p53 gene and the presence of the MDR1 gene are associated with many malignant tumors including endometrial cancer and are responsible for cancer therapeutic resistance and poor survival. Thus, there is a critical need to devise novel combinatorial therapies with multiple mechanisms of action to overcome drug resistance. Here, we report a new ciprofloxacin derivative (CIP2b) tested either alone or in combination with taxanes against four human endometrial cancer cell lines. In vitro studies revealed that a combination of paclitaxel + CIP2b had synergistic cytotoxic effects against MDR1-expressing type-II human endometrial cancer cells with loss-of-function p53 (Hec50co LOFp53). Enhanced antitumor effects were confirmed by substantial increases in caspase-3 expression, cell population shifts toward the G2/M phase, and reduction of cdc2 phosphorylation. It was found that CIP2b targets multiple pathways including the inhibition of MDR1, topoisomerase I, and topoisomerase II, as well as enhancing the effects of paclitaxel (PTX) on microtubule assembly. In vivo treatment with the combination of PTX + CIP2b also led to significantly increased accumulation of PTX in tumors (compared to CIP2b alone) and reduction in tumor growth. Enhanced in vivo cytotoxic effects were confirmed by histological and immunohistochemical examination of the tumor tissues. Complete blood count and blood biochemistry data confirmed the absence of any apparent off-target toxicity. Thus, combination therapy involving PTX and CIP2b targeted multiple pathways and represents an approach that could result in improved tolerance and efficacy in patients with type-II endometrial cancer harboring the MDR1 gene and p53 mutations.

Keywords: Drug accumulation; Drug resistance; MDR1 and p53 genes; Microtubules; Molecular combinatorial therapy; Topoisomerases.


Conflict of interest statement

Declaration of competing interest The authors declare that they have no known competing financial interests or personal relationships that could have appeared to influence the work reported in this paper.

Figures

Fig. 1.
Fig. 1.
In vitro antitumor activity of PTX ± CIP2b combinatorial treatment against four different human endometrial cancer cell lines. (a–d) Cytotoxicity assay for indicated cell line following treatment for 72 hours with different concentrations of either PTX or CIP2b or different concentrations of PTX and fixed concentrations of CIP2b. (e–h), Cytotoxicity assay for indicated cell line following treatment for 72 hours with different concentrations of either PTX or CIP or CIP2b or different concentrations of PTX and fixed concentrations of either CIP or CIP2b. (i–l), Estimated IC50 values for indicated cell line following treatment with PTX ± CIP2b. (m–p), Cytotoxic synergy between PTX and CIP2b is calculated for indicated cell lines using the Combination Index (CI) method where CI values less than 1 indicate synergy. Data are plotted as mean ± SD (n=3). A one–way ANOVA with Tukey post hoc test was used for statistical analysis. *, P < 0.05; **, P < 0.01; ***, P < 0.001; ****, P < 0.0001; ns, nonsignificant.
Fig. 2.
Fig. 2.
Role of the mitotic spindle checkpoint in the cellular response to the therapeutic combination of PTX + CIP2b following the cell cycle analysis using ModFit LT software. (a, b, c, and d) Histograms of Ishikawa–H WTp53, Hec50co LOFp53, Hec50co GOFp53, and KLE GOFp53 cells, respectively, with indicated treatments represent cell cycle phases: G0/G1, S, and G2/M. (e, f, g, and h) Distribution of Ishikawa–H WTp53, Hec50co LOFp53, Hec50co GOFp53, and KLE GOFp53 cells, respectively, in each stage of the cell cycle after incubation with the indicated treatment for 24 hours. Data are plotted as mean ± SD (n=3).
Fig. 3.
Fig. 3.
Effect of PTX + CIP2b combinatorial therapy on the MDR1. (a) Cytotoxicity assays of MDR1-expressing Hec50co LOFp53 endometrial cancer cells following treatment for 72 hours with different concentrations of PTX and fixed concentration of CIP2b (10 μM) using two different treatment strategies: concurrent treatment where both compounds were added to the cells at the same time vs sequential treatment where the PTX was added either after or before the CIP2b. (b) IC50 values of PTX following the addition of 10 μM CIP2b against MDR1–expressing Hec50co LOFp53 endometrial cancer cells. (c) Representative flow cytometric histograms of PTX–OG intracellular accumulation experiment. (d) Intracellular accumulation of PTX–OG (400 nM) in MDR1–expressing Hec50co LOFp53 cells in the presence or absence of CIP2b (4 or 40 μM) after 2 hours of treatment, as determined by flow cytometric analysis. (e) Confocal microscopy images of Hec50co cells cultured with PTX–OG ± CIP2b (scale bar = 30 μm). (f) Molecular interaction of CIP2b with human MDR1. CIP2b molecule is colored pink, the non–conventional long–distance hydrogen bond is colored red, and active site residues are colored cyan. Polar contact surfaces are presented as green while the target protein is presented as a transparent surface in gray. (g) Flow cytometric assay of the intracellular accumulation of PTX–OG (400 nM) in LLC–PK1–WT or LLC–PK1–MDR1 cells in the presence or absence of CIP2b (4 μM). (h and i) Percent cell survival following treatment of LLC–PK1–WT cells and LLC-PK1–MDR1 cells, respectively, for 72 hours with different concentrations of PTX in the presence or absence of 50 μM CIP2b. (j) IC50 values of PTX following the addition of 50 μM CIP2b against LLC–PK1–WT cells and LLC–PK1–MDR1 cells. Data are plotted as mean ± SD (n=3). A one–way (b and c) or two–way (g) ANOVA with Tukey post hoc test or one–sided t–test (j) were used for statistical analysis. **, P < 0.01; ***, P < 0.001; ****, P < 0.0001; ns, nonsignificant.
Fig. 4.
Fig. 4.
Molecular mechanisms of action of the therapeutic combination of PTX + CIP2b. (a) Molecular interaction of CIP2b with human topoisomerase I. (b) Representative image of agarose gel electrophoresis showing inhibition of topoisomerase I. (c) Topoisomerase I inhibitory activity of CIP2b, CIP, PTX, or indicated combinations represented as a bar graph based on quantification of the band intensity in electrophoretic gels. (d) Molecular interaction of CIP2b with human topoisomerase II. (e) Representative image of agarose gel electrophoresis showing inhibition of topoisomerase II. (f) Topoisomerase II inhibitory activity of CIP2b, CIP, PTX, or indicated combinations represented as a bar graph based on quantification of the band intensity in electrophoretic gels. (g) Molecular interaction of CIP2b with tubulin dimers. (h) β–tubulin polymerization activity in the presence of PTX and CIP2b, alone or in combination. Tubulin and CaCl2 were used as controls. The three phases of polymerization are shown: I (nucleation), II (growth), and III (steady state). (i) Vmax values as an indicator of tubulin/ligand interactions. In all molecular docking graphs (a, d, and g), the CIP2b molecule is colored pink, the non–conventional long–distance hydrogen bond is colored red, and active site residues are colored cyan. Polar contact surfaces are presented as green, and the target protein is presented as a transparent surface in gray. Data are plotted as mean ± SD (n=3). A one–way ANOVA with Tukey post hoc test was used for statistical analysis. *, P < 0.05; ****, P < 0.0001; ns, nonsignificant.
Fig. 5.
Fig. 5.
Caspase cascade and key G2/M phase regulators of Hec50co LOFp53 cells treated with PTX ± CIP2b. (a, b, and c) Expression of caspase–3, caspase–8, and caspase–9, respectively, in Hec50co LOFp53 cells incubated with the designated treatment for 24 hours. (d, e, and f), Expression of caspase–3, caspase–8, and caspase–9, respectively, in Hec50co LOFp53 cells incubated with the designated treatment for 72 hours. (g) Western blot analysis to evaluate the effect of PTX ± CIP2b on cell cycle regulatory proteins in Hec50co LOFp53 cells. The cell lysate was subjected to SDS–PAGE followed by transfer to nitrocellulose membranes. Membranes were probed with cdc25C, phospho-cdc2 Tyr 15, total cdc2, and β–actin antibodies, followed by incubation with corresponding horseradish peroxidase–conjugated secondary antibody, and visualized by an ECL detection system. Data are plotted as mean ± SD (n=3). A one–way ANOVA with Tukey post hoc test was used for statistical analysis. *, P < 0.05; **, P < 0.01; ***, P < 0.001; ****, P < 0.0001; ns, nonsignificant.
Fig. 6.
Fig. 6.
In vivo tumor accumulation and antitumor efficacy of PTX ± CIP2b. (a) Graphical representation of the in vivo PTX–OG intracellular accumulation study in the presence or absence of CIP2b. (b) Representative histograms of PTX–OG fluorescence in tumor–bearing mice treated with PTX ± CIP2b. (c) Flow cytometric analysis of PTX–OG in tumor cells (i.e., single–cell suspension) derived from mice challenged with Hec50co LOFp53 cells. (d) Hec50co LOFp53 tumor growth (human endometrial cancer xenografts) in athymic Nu/Nu mice following treatment with PBS, PTX, or PTX + CIP2b. (e) Body weight monitoring of the mice following their treatment with PBS, PTX, or PTX + CIP2b. (f) Gross examination of tumors collected from mice injected with the indicated treatments (day 53 post–tumor challenge). (g) Average tumor weights following mice euthanasia and tumor collection from mice injected with indicated treatments (day 53 post–tumor challenge). (h) Histological and immunohistochemical analysis of tumor tissues. Tumors were collected from representative mice treated with either PBS, PTX, or PTX + CIP2b. Sections were stained with H&E or antibodies against caspase 3 (indicating apoptosis) or β–tubulin (indicating microtubule assembly). Yellow arrows point out necrotic areas (H&E) or where antibodies showed abundant binding to their specific target. Scale bar = 500 μm. Data are plotted as mean ± SD (n=3–4). A one–way ANOVA with Tukey post hoc test (c) or one–sided t–test (d and g) were used for statistical analysis. *, P < 0.05; **, P < 0.01; ns, nonsignificant.
Fig. 7.
Fig. 7.
Pharmacokinetics, biodistribution, and safety profile of CIP2b. (a) Observed and predicted plasma CIP2b concentration versus time following IV administration of CIP2b into female BALB/c mice. (b) Schematic representation of the one‐ and two–compartment models for IV administration. K10 is the elimination rate constant while K12 and K21 are the first–order distribution rate constants depicting CIP2b transfer between the central and the peripheral compartments. (c and d) Biodistribution of CIP2b into the vital body organs following the IV injection of 1.25 and 3.75 mg/kg CIP2b, respectively. (e) Complete blood count (hematological data) of healthy female and male BALB/c mice following IV administration of CIP2b. (f) Enzyme levels and biochemical markers (serum data) of healthy female and male BALB/c mice following IV administration of CIP2b. Data are plotted as mean ± SD (n=3). A two–way ANOVA with the Tukey post hoc test was used for statistical analysis. ns, nonsignificant.
Scheme 1.
Scheme 1.
Schematic illustration of the four mechanisms of actions of the combinatorial therapy of PTX + CIP2b.

Similar articles

Cited by

References

    1. Mota A, Oltra SS, Selenica P, Moiola CP, Casas–Arozamena C, Lopez–Gil C, Diaz E, Gatius S, Ruiz–Miro M, Calvo A, Rojo–Sebastian A, Hurtado P, Pineiro R, Colas E, Gil–Moreno A, Reis–Filho JS, Muinelo–Romay L, Abal M, Matias–Guiu X, Weigelt B, Moreno–Bueno G, Intratumor genetic heterogeneity and clonal evolution to decode endometrial cancer progression, Oncogene 41(13) (2022) 1835–1850. - PMC - PubMed
    1. Gatius S, Cuevas D, Fernandez C, Roman–Canal B, Adamoli V, Piulats JM, Eritja N, Martin-Satue M, Moreno–Bueno G, Matias–Guiu X, Tumor Heterogeneity in Endometrial Carcinoma: Practical Consequences, Pathobiology 85(1–2) (2018) 35–40. - PubMed
    1. Setiawan VW, Yang HP, Pike MC, McCann SE, Yu H, Xiang YB, Wolk A, Wentzensen N, Weiss NS, Webb PM, van den Brandt PA, van de Vijver K, Thompson PJ, Australian G National Endometrial Cancer Study, Strom BL, Spurdle AB, Soslow RA, Shu XO, Schairer C, Sacerdote C, Rohan TE, Robien K, Risch HA, Ricceri F, Rebbeck TR, Rastogi R, Prescott J, Polidoro S, Park Y, Olson SH, Moysich KB, Miller AB, McCullough ML, Matsuno RK, Magliocco AM, Lurie G, Lu L, Lissowska J, Liang X, Lacey JV Jr., Kolonel LN, Henderson BE, Hankinson SE, Hakansson N, Goodman MT, Gaudet MM, Garcia–Closas M, Friedenreich CM, Freudenheim JL, Doherty J, De Vivo I, Courneya KS, Cook LS, Chen C, Cerhan JR, Cai H, Brinton LA, Bernstein L, Anderson KE, Anton-Culver H, Schouten LJ, Horn–Ross PL, Type I and II endometrial cancers: have they different risk factors?, Journal of clinical oncology : official journal of the American Society of Clinical Oncology 31(20) (2013) 2607–18. - PMC - PubMed
    1. Murali R, Soslow RA, Weigelt B, Classification of endometrial carcinoma: more than two types, The Lancet. Oncology 15(7) (2014) e268–78. - PubMed
    1. Lu KH, Broaddus RR, Endometrial Cancer, The New England journal of medicine 383(21) (2020) 2053–2064. - PubMed

Publication types

MeSH terms