. 2023 Apr 15:377:578067.
doi: 10.1016/j.jneuroim.2023.578067. Epub 2023 Mar 17.

CD3+CD56+ and CD3-CD56+ lymphocytes in the cerebrospinal fluid of persons with HIV-1 subtypes B and C

Affiliations

CD3+CD56+ and CD3-CD56+ lymphocytes in the cerebrospinal fluid of persons with HIV-1 subtypes B and C

Sergio M de Almeida et al. J Neuroimmunol. .

Abstract

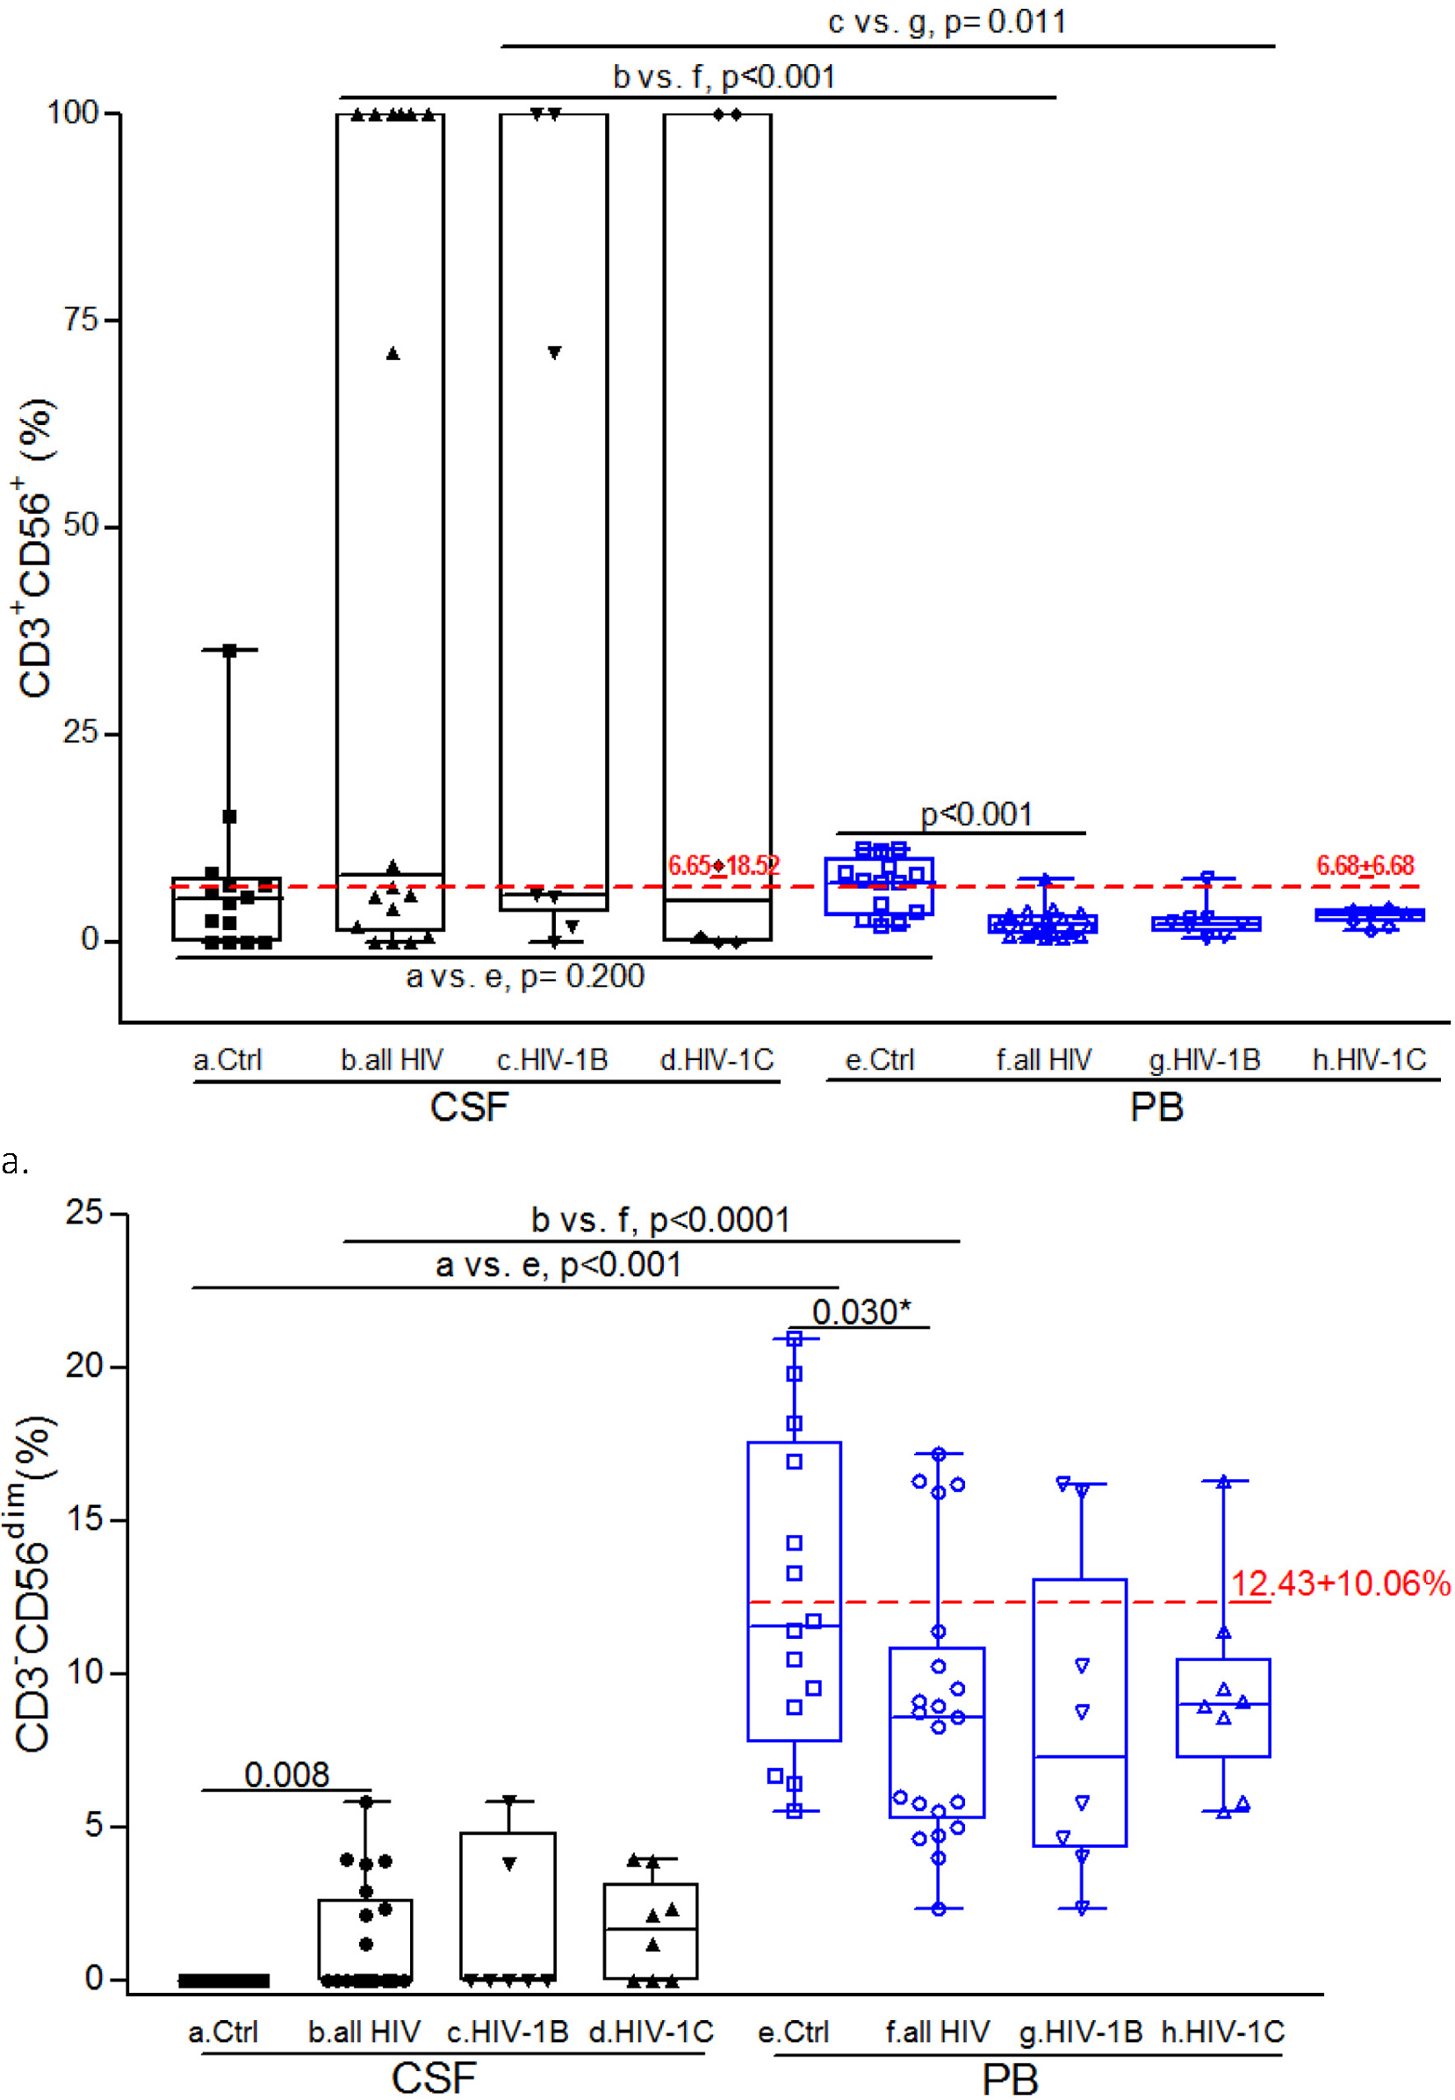
The transactivator of transcription (Tat) is a HIV regulatory protein which promotes viral replication and chemotaxis. HIV-1 shows extensive genetic diversity, HIV-1 subtype C being the most dominant subtype in the world. Our hypothesis is the frequency of CSF CD3+CD56+ and CD3-CD56dim is reduced in HIV-1C compared to HIV-1B due to the Tat C30S31 substitution in HIV-1C. 34 CSF and paired blood samples (PWH, n = 20; PWoH, n = 14) were studied. In PWH, the percentage of CD3+CD56+ was higher in CSF than in blood (p < 0.001), comparable in both compartments in PWoH (p = 0.20). The proportion of CD3-CD56dim in CSF in PWH was higher than PWoH (p = 0.008). There was no subtype differences. These results showed CNS compartmentalization of NKT cell response in PWH.

Keywords: Flow cytometry; HIV-1C; Human immunodeficiency virus (HIV); Immunophenotyping; Natural killer (NK) cells; T lymphocytes with natural killer activity (NKT).


Conflict of interest statement

Declaration of Competing Interest The authors have no conflicts of interest to declare regarding the publication of this article.

Figures

Fig. 1.
Fig. 1.
Proportion of CD3+CD56+ and CD3 CD56dim lymphocytes in gated CD45 in CSF (black) and peripheral blood (blue) by HIV serostatus and HIV-1 subtype. From a) to d), the box plots represent the medians and interquartile ranges, whiskers represent the maximum and minimum values, and dots represent individuals. The red dashed lines indicate mean ± two standard deviation in the HIV negative control group. a) CD3+CD56+ and b) CD3 CD56dim were compared between PWH and PWoH, HIV-1 subtypes B and C, and plasma and CSF. *p = 0.060 after multiple testing correction using Benjamini Hochberg method. c) CD3+CD56+ and d) CD3 CD56dim were compared between the groups categorized according to the HIV RNA in CSF and peripheral blood compartments. *p = 0.11 after adjusting for multiple comparisons with Tukey’s HSD test. e) the frequency of CSF samples CD3 CD56dim (black) and CD3+CD56+ (gray) lymphocytes between the groups categorized according with the HIV RNA in CSF and blood compartments. Ctrl, HIV negative control group. (For interpretation of the references to color in this figure legend, the reader is referred to the web version of this article.)
Fig. 1.
Fig. 1.
Proportion of CD3+CD56+ and CD3 CD56dim lymphocytes in gated CD45 in CSF (black) and peripheral blood (blue) by HIV serostatus and HIV-1 subtype. From a) to d), the box plots represent the medians and interquartile ranges, whiskers represent the maximum and minimum values, and dots represent individuals. The red dashed lines indicate mean ± two standard deviation in the HIV negative control group. a) CD3+CD56+ and b) CD3 CD56dim were compared between PWH and PWoH, HIV-1 subtypes B and C, and plasma and CSF. *p = 0.060 after multiple testing correction using Benjamini Hochberg method. c) CD3+CD56+ and d) CD3 CD56dim were compared between the groups categorized according to the HIV RNA in CSF and peripheral blood compartments. *p = 0.11 after adjusting for multiple comparisons with Tukey’s HSD test. e) the frequency of CSF samples CD3 CD56dim (black) and CD3+CD56+ (gray) lymphocytes between the groups categorized according with the HIV RNA in CSF and blood compartments. Ctrl, HIV negative control group. (For interpretation of the references to color in this figure legend, the reader is referred to the web version of this article.)
Fig. 2.
Fig. 2.
Scatterplots of correlations between biomarkers in CSF and PB. Correlation coefficients (ρ, 95% confidence intervals) estimated using Spearman’s rank-order method.

References

    1. Albini A, Benelli R, Giunciuglio D, Cai T, Mariani G, Ferrini S, Noonan D, 1998. Identification of a novel domain of HIV tat involved in monocyte chemotaxis. J. Biol. Chem. 273, 15895–15900. - PubMed
    1. Alter G, Altfeld M, 2009. NK cells in HIV-1infection: evidence for their role in the control of HIV-1infection. J. Intern. Med. 265, 29–42. - PMC - PubMed
    1. Alter G, Malenfant JM, Delabre RM, Burgett NC, Yu XG, Lichterfeld M, Zaunders J, Altfeld M, 2004. Increased natural killer cell activity in viremic HIV-1 infection. J. Immunol. 173, 5305–5311. - PubMed
    1. Alter G, Teigen N, Davis BT, Addo MM, Suscovich TJ, Waring MT, Streeck H, Johnston MN, Staller KD, Zaman MT, Yu XG, Lichterfeld M, Basgoz N, Rosenberg ES, Altfeld M, 2005. Sequential deregulation of NK cell subset distribution and function starting in acute HIV-1 infection. Blood 106, 3366–3369. - PubMed
    1. Azzoni L, Papasavvas E, Chehimi J, Kostman JR, Mounzer K, Ondercin J, Perussia B, Montaner LJ, 2002. Sustained impairment of IFN- gamma secretion in suppressed HIV-infected patients despite mature NK cell recovery: evidence for a defective reconstitution of innate immunity. J. Immunol. 168, 5764–5770. - PubMed