. 2023 Jun:169:111234.
doi: 10.1016/j.jpsychores.2023.111234. Epub 2023 Mar 17.

Persistent somatic symptoms are key to individual illness perception at one year after COVID-19 in a cross-sectional analysis of a prospective cohort study

Affiliations

Persistent somatic symptoms are key to individual illness perception at one year after COVID-19 in a cross-sectional analysis of a prospective cohort study

Katharina Hüfner et al. J Psychosom Res. 2023 Jun.

Abstract

Objective: Subjective illness perception (IP) can differ from physician's clinical assessment results. Herein, we explored patient's IP during coronavirus disease 2019 (COVID-19) recovery.

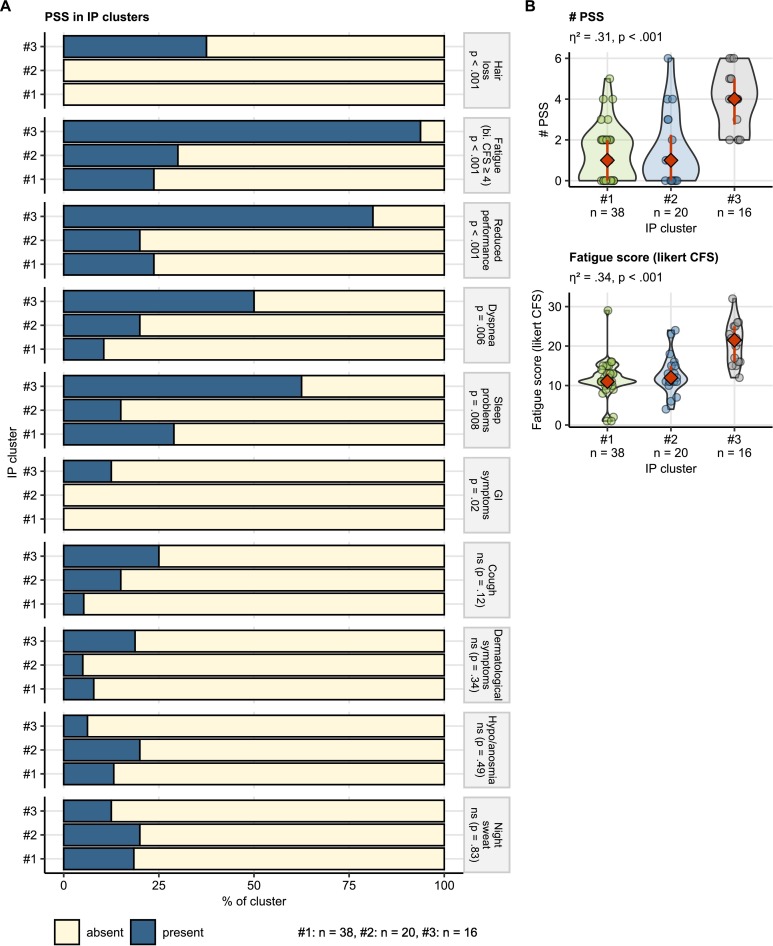
Methods: Participants of the prospective observation CovILD study (ClinicalTrials.gov: NCT04416100) with persistent somatic symptoms or cardiopulmonary findings one year after COVID-19 were analyzed (n = 74). Explanatory variables included demographic and comorbidity, COVID-19 course and one-year follow-up data of persistent somatic symptoms, physical performance, lung function testing, chest computed tomography and trans-thoracic echocardiography. Factors affecting IP (Brief Illness Perception Questionnaire) one year after COVID-19 were identified by regularized modeling and unsupervised clustering.

Results: In modeling, 33% of overall IP variance (R2) was attributed to fatigue intensity, reduced physical performance and persistent somatic symptom count. Overall IP was largely independent of lung and heart findings revealed by imaging and function testing. In clustering, persistent somatic symptom count (Kruskal-Wallis test: η2 = 0.31, p < .001), fatigue (η2 = 0.34, p < .001), diminished physical performance (χ2 test, Cramer V effect size statistic: V = 0.51, p < .001), dyspnea (V = 0.37, p = .006), hair loss (V = 0.57, p < .001) and sleep problems (V = 0.36, p = .008) were strongly associated with the concern, emotional representation, complaints, disease timeline and consequences IP dimensions.

Conclusion: Persistent somatic symptoms rather than abnormalities in cardiopulmonary testing influence IP one year after COVID-19. Modifying IP represents a promising innovative approach to treatment of post-COVID-19 condition. Besides COVID-19 severity, individual IP should guide rehabilitation and psychological therapy decisions.

Keywords: COVID-19; Clustering; Illness perception; Persistent somatic symptoms; Post-COVID-19 condition; Regularized regression.


Conflict of interest statement

Declaration of Competing Interest All authors have completed the ICMJE uniform disclosure form at www.icmje.org/coi_disclosure.pdf and declare: Katharina Hüfner has received research grants from Austria Wirtchaftsservice (AWS) and the State of Tyrol as well as lecturer's honoraria from Forum Medizinische Fortbildung (FOMF), the Anton Proksch Institute and the Hospital of Schwaz. Piotr Tymoszuk owns a data science company, Data Analytics as a Service Tirol, and receives payments from statistical data analysis, bioinformatic and scientific writing services. Other authors declare that no conflict of interest exists.

Figures

Fig. 1
Fig. 1
Flow diagram of study enrollment and analysis inclusion process. CT: computed tomography of the chest; LFT: lung function testing, TTE: trans-thoracic echocardiography.
Fig. 2
Fig. 2
Key factors associated with illness perception one year after COVID-19. The total illness perception (IP) score (A) and the emotion/concern/consequences IP component score (B) at the one-year follow-up were modeled as a function of 56 candidate explanatory variables by Elastic Net, LASSO and Bayesian LASSO. Key factors for the total IP score and emotion/concern/consequences component score were identified as variables with non-zero coefficients in all three models. Key factor numbers identified by each algorithm are presented as quasi-proportional Venn diagrams. The key factors are listed next to the diagrams. CFS: Chalder's fatigue score; reduced performance: Eastern Cooperative Oncology Group (ECOG) ≥ 1; # PSS: number of persistent somatic symptoms at the one-year follow-up; CRP: C-reactive protein.
Fig. 3
Fig. 3
Persistent somatic symptom number, reduced physical performance, fatigue and the total illness perception scoring. Association of the total illness perception (IP) score with persistent somatic symptom number (PSS), reduced physical performance and fatigue scoring at the one-year follow-up. Statistical significance was determined by Kruskal-Wallis test with η2 effect size statistic (symptom number), Mann-Whitney test with r effect size statistic (reduced performance) and Spearman's correlation (fatigue scoring). The total IP scores in the persistent somatic symptom number or physical performance strata are presented in violin plots; single observations are depicted as points, red diamonds with whiskers represent medians with interquartile ranges. The correlation with fatigue scoring is presented in a point plot; the blue line represents the fitted second-order trend and the gray ribbon depicts the 95% confidence intervals. Effect size statistic and p values are indicated in the plot captions. Numbers of complete observations are displayed in the plot captions or in the plot X axes. # PSS: number of persistent somatic symptoms at the one-year follow-up; CFS: Chalder's fatigue score; ECOG: Eastern Cooperative Oncology Group.
Fig. 4
Fig. 4
Key factors influencing the emotional representation,/concern /consequences component of illness perception. Association of the total emotion/concern/consequences IP component score at the one-year follow-up with persistent somatic symptoms (A), rehabilitation status, cardiological and inflammatory abnormalities (B), and respiratory comorbidity and body weight (C). Statistical significance was assessed by Kruskal-Wallis test with η2 effect size statistic (number of symptoms), Spearman's correlation (fatigue scoring) and Mann-Whitney test with r effect size statistic (remaining independent variables).The correlation with fatigue scoring is presented in a point plot; the blue line represents the fitted second-order trend and the gray ribbon depicts the 95% confidence intervals. For the remaining independent variables, the score values are presented in violin plots with single observations depicted as points, and red diamonds and whiskers representing medians with interquartile ranges. Effect size statistic and p values are indicated in the plot captions. Numbers of complete observations are displayed in the plot captions or in the plot X axes. # PSS: number of persistent somatic symptoms at the one-year follow-up, CFS: Chalder's fatigue score; ECOG: Eastern Cooperative Oncology Group; CRP: serum C-reactive protein.
Fig. 5
Fig. 5
Clusters of illness perception. Three subsets of study participants (illness perception [IP] clusters) were identified by clustering in respect to the Brief Illness Perception Questionnaire items (BIPQ, Q1 - Q8) with the partitioning around medoids algorithm and Euclidean distance metric. Numbers of observations assigned to the clusters are displayed next to the plots or in the plot X axes. (A) Mean BIPQ item scores at one year after COVID-19 in the IP clusters. Statistical significance was determined by Kruskal-Wallis test. P values are indicated below the item names. Lines represent mean values, tinted ribbons depict 2 × SEM (standard error of the mean) intervals. (B) The total IP score, emotion/concern/consequences and the lacking control/coherence IP component scores in the IP clusters. Statistical significance was determined by Kruskal-Wallis test with η2 effect size statistic. Response values are presented in violin plots. Points represent single observations. Red diamonds and whiskers depict medians and interquartile ranges. Effect size statistic and p values are indicated in the plot captions.
Fig. 6
Fig. 6
Course of COVID-19, rehabilitation and one-year follow-up sequelae of COVID-19 in the illness perception clusters. COVID-19 severity and post-COVID-19 rehabilitation status (A), persistent somatic symptom and cardiopulmonary abnormality rates (B) and chest computed tomography abnormality severity (C) in the illness perception (IP) clusters. Statistical significance was assessed by Kruskal-Wallis test with η2 effect size statistic (numeric variables) or by χ2 test with Cramer V effect size statistic (categorical variables). Numeric variable values are presented in violin plots with single observations depicted as points, and red diamonds and whiskers representing medians with interquartile ranges. Categorical variable strata frequencies expressed as percentages within the IP cluster are presented in stack plots. Effect size statistic and p values are indicated in the plot captions or plot facets. Numbers of observations assigned to the clusters are displayed below the plots or in the plot X axes. A, HM, HS: ambulatory, hospitalized moderate and hospitalized severe acute COVID-19, PSS: persistent somatic symptoms, WHO COVID-19 severity: WHO ordinal scale for clinical improvement; LFT: lung function testing; CT: chest computed tomography.
Fig. 7
Fig. 7
Persistent somatic symptoms at the one-year follow-up in the illness perception clusters. (A) Frequencies of persistent somatic symptoms (PSS) in the illness perception (IP) clusters. Statistical significance was determined by χ2 test. Percentages of individuals with and without the specific PSS within the IP cluster are presented in a stack plot. Significance is indicated next in the plot facets. Numbers of complete observations are displayed next to the plot. bi. CFS: bimodal Chalder's fatigue score; reduced performance: ECOG (Eastern Cooperative Oncology Group) ≥ 1. (B) Numbers of PSS and fatigue scoring in the IP clusters. Statistical significance was determined by Kruskal-Wallis test with η2 effect size statistic. Response values are presented in violin plots. Points represent single observations. Red diamonds and whiskers depict medians and interquartile ranges. Effect size statistic and p values are indicated in the plot captions. CFS: Chalder's fatigue score; # PSS: number of persistent somatic symptoms.

References

    1. Sonnweber T., Sahanic S., Pizzini A., Luger A., Schwabl C., Sonnweber B., Kurz K., Koppelstätter S., Haschka D., Petzer V., Boehm A., Aichner M., Tymoszuk P., Lener D., Theurl M., Lorsbach-Köhler A., Tancevski A., Schapfl A., Schaber M., Hilbe R., Nairz M., Puchner B., Hüttenberger D., Tschurtschenthaler C., Aßhoff M., Peer A., Hartig F., Bellmann R., Joannidis M., Gollmann-Tepeköylü C., Holfeld J., Feuchtner G., Egger A., Hoermann G., Schroll A., Fritsche G., Wildner S., Bellmann-Weiler R., Kirchmair R., Helbok R., Prosch H., Rieder D., Trajanoski Z., Kronenberg F., Wöll E., Weiss G., Widmann G., Löffler-Ragg J., Tancevski I. Cardiopulmonary recovery after COVID-19: an observational prospective multicentre trial. Eur. Respir. J. 2021;57 doi: 10.1183/13993003.03481-2020. - DOI - PMC - PubMed
    1. Sahanic S., Tymoszuk P., Ausserhofer D., Rass V., Pizzini A., Nordmeyer G., Hüfner K., Kurz K., Weber P.M., Sonnweber T., Boehm A., Aichner M., Cima K., Boeckle B., Holzner B., Rumpold G., Puelacher C., Kiechl S., Huber A., Wiedermann C.J., Sperner-Unterweger B., Tancevski I., Bellmann-Weiler R., Bachler H., Piccoliori G., Helbok R., Weiss G., Loeffler-Ragg J. Phenotyping of acute and persistent coronavirus disease 2019 Features in the outpatient setting: exploratory analysis of an international cross-sectional online survey. Clin. Infect. Dis. Off. Pub. Infect. Dis. Soc. Am. 2022;75:e418–e431. doi: 10.1093/cid/ciab978. - DOI - PMC - PubMed
    1. Luger A.K., Sonnweber T., Gruber L., Schwabl C., Cima K., Tymoszuk P., Gerstner A.K., Pizzini A., Sahanic S., Boehm A., Coen M., Strolz C.J., Wöll E., Weiss G., Kirchmair R., Feuchtner G.M., Prosch H., Tancevski I., Löffler-Ragg J., Widmann G. Chest CT of lung injury 1 year after COVID-19 pneumonia: the CovILD study. Radiology. 2022;304:462–470. doi: 10.1148/radiol.211670. - DOI - PMC - PubMed
    1. Sonnweber T., Tymoszuk P., Sahanic S., Boehm A., Pizzini A., Luger A., Schwabl C., Nairz M., Grubwieser P., Kurz K., Koppelstätter S., Aichner M., Puchner B., Egger A., Hoermann G., Wöll E., Weiss G., Widmann G., Tancevski I., Löffler-Ragg J. Investigating phenotypes of pulmonary COVID-19 recovery: A longitudinal observational prospective multicenter trial. eLife. 2022;11 doi: 10.7554/ELIFE.72500. - DOI - PMC - PubMed
    1. Hüfner K., Tymoszuk P., Ausserhofer D., Sahanic S., Pizzini A., Rass V., Galffy M., Böhm A., Kurz K., Sonnweber T., Tancevski I., Kiechl S., Huber A., Plagg B., Wiedermann C.J., Bellmann-Weiler R., Bachler H., Weiss G., Piccoliori G., Helbok R., Loeffler-Ragg J., Sperner-Unterweger B. Who is at risk of poor mental health following coronavirus disease-19 outpatient management? Front. Med. 2022;9 doi: 10.3389/fmed.2022.792881. - DOI - PMC - PubMed

Publication types

Associated data