. 2023 Apr 20;83(8):1264-1279.e10.
doi: 10.1016/j.molcel.2023.03.002. Epub 2023 Mar 24.

U1 snRNP increases RNA Pol II elongation rate to enable synthesis of long genes

Affiliations

U1 snRNP increases RNA Pol II elongation rate to enable synthesis of long genes

Claudia A Mimoso et al. Mol Cell. .

Abstract

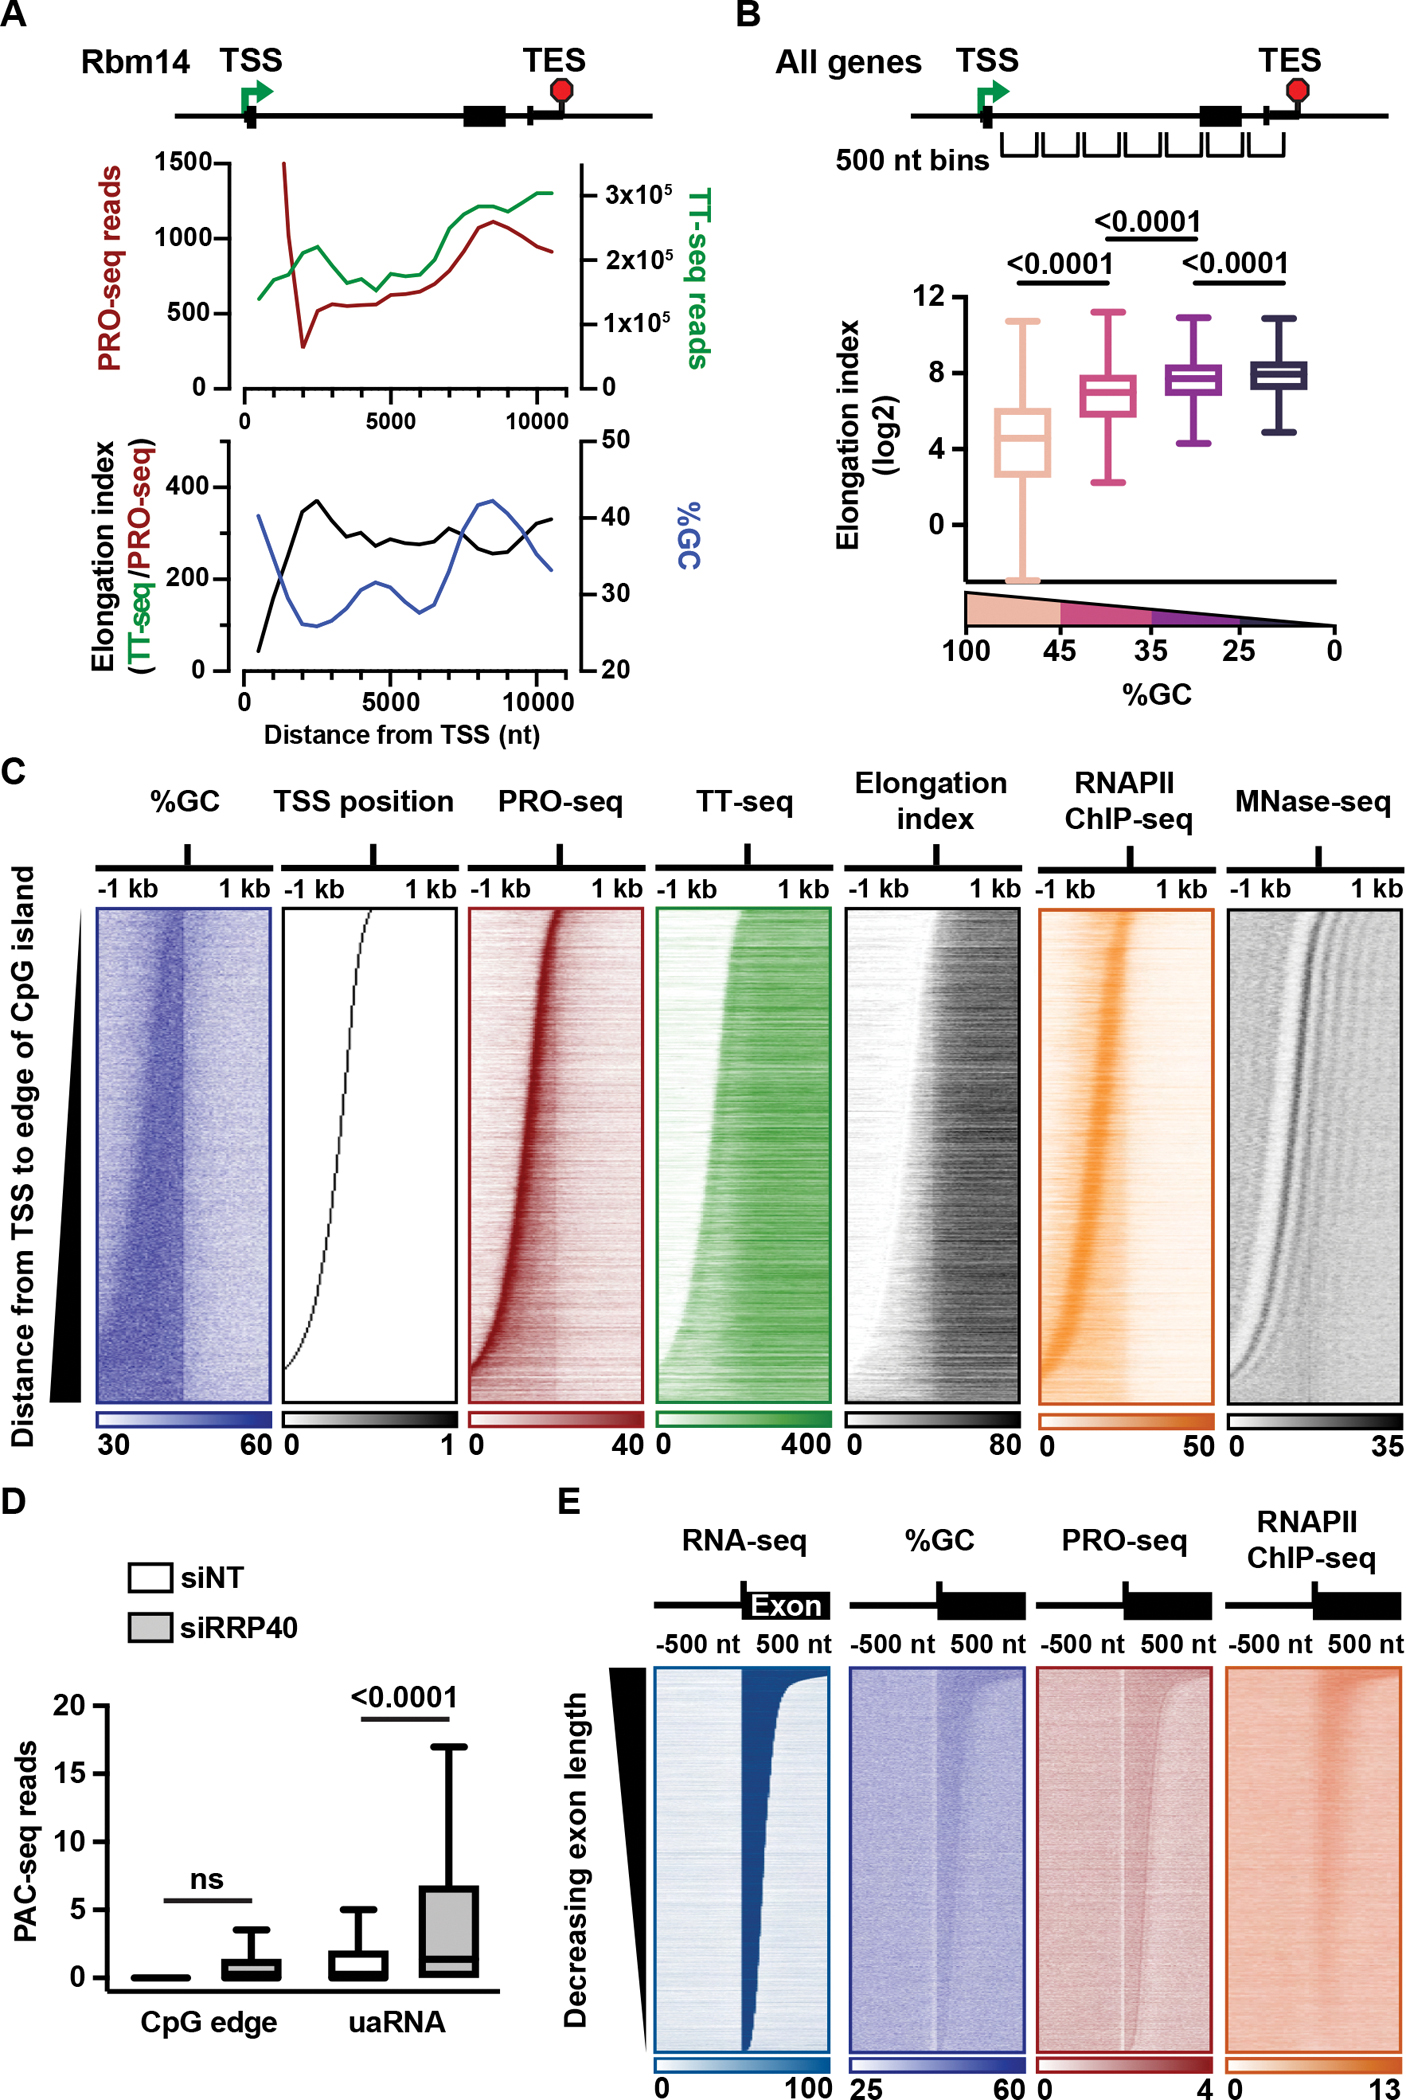
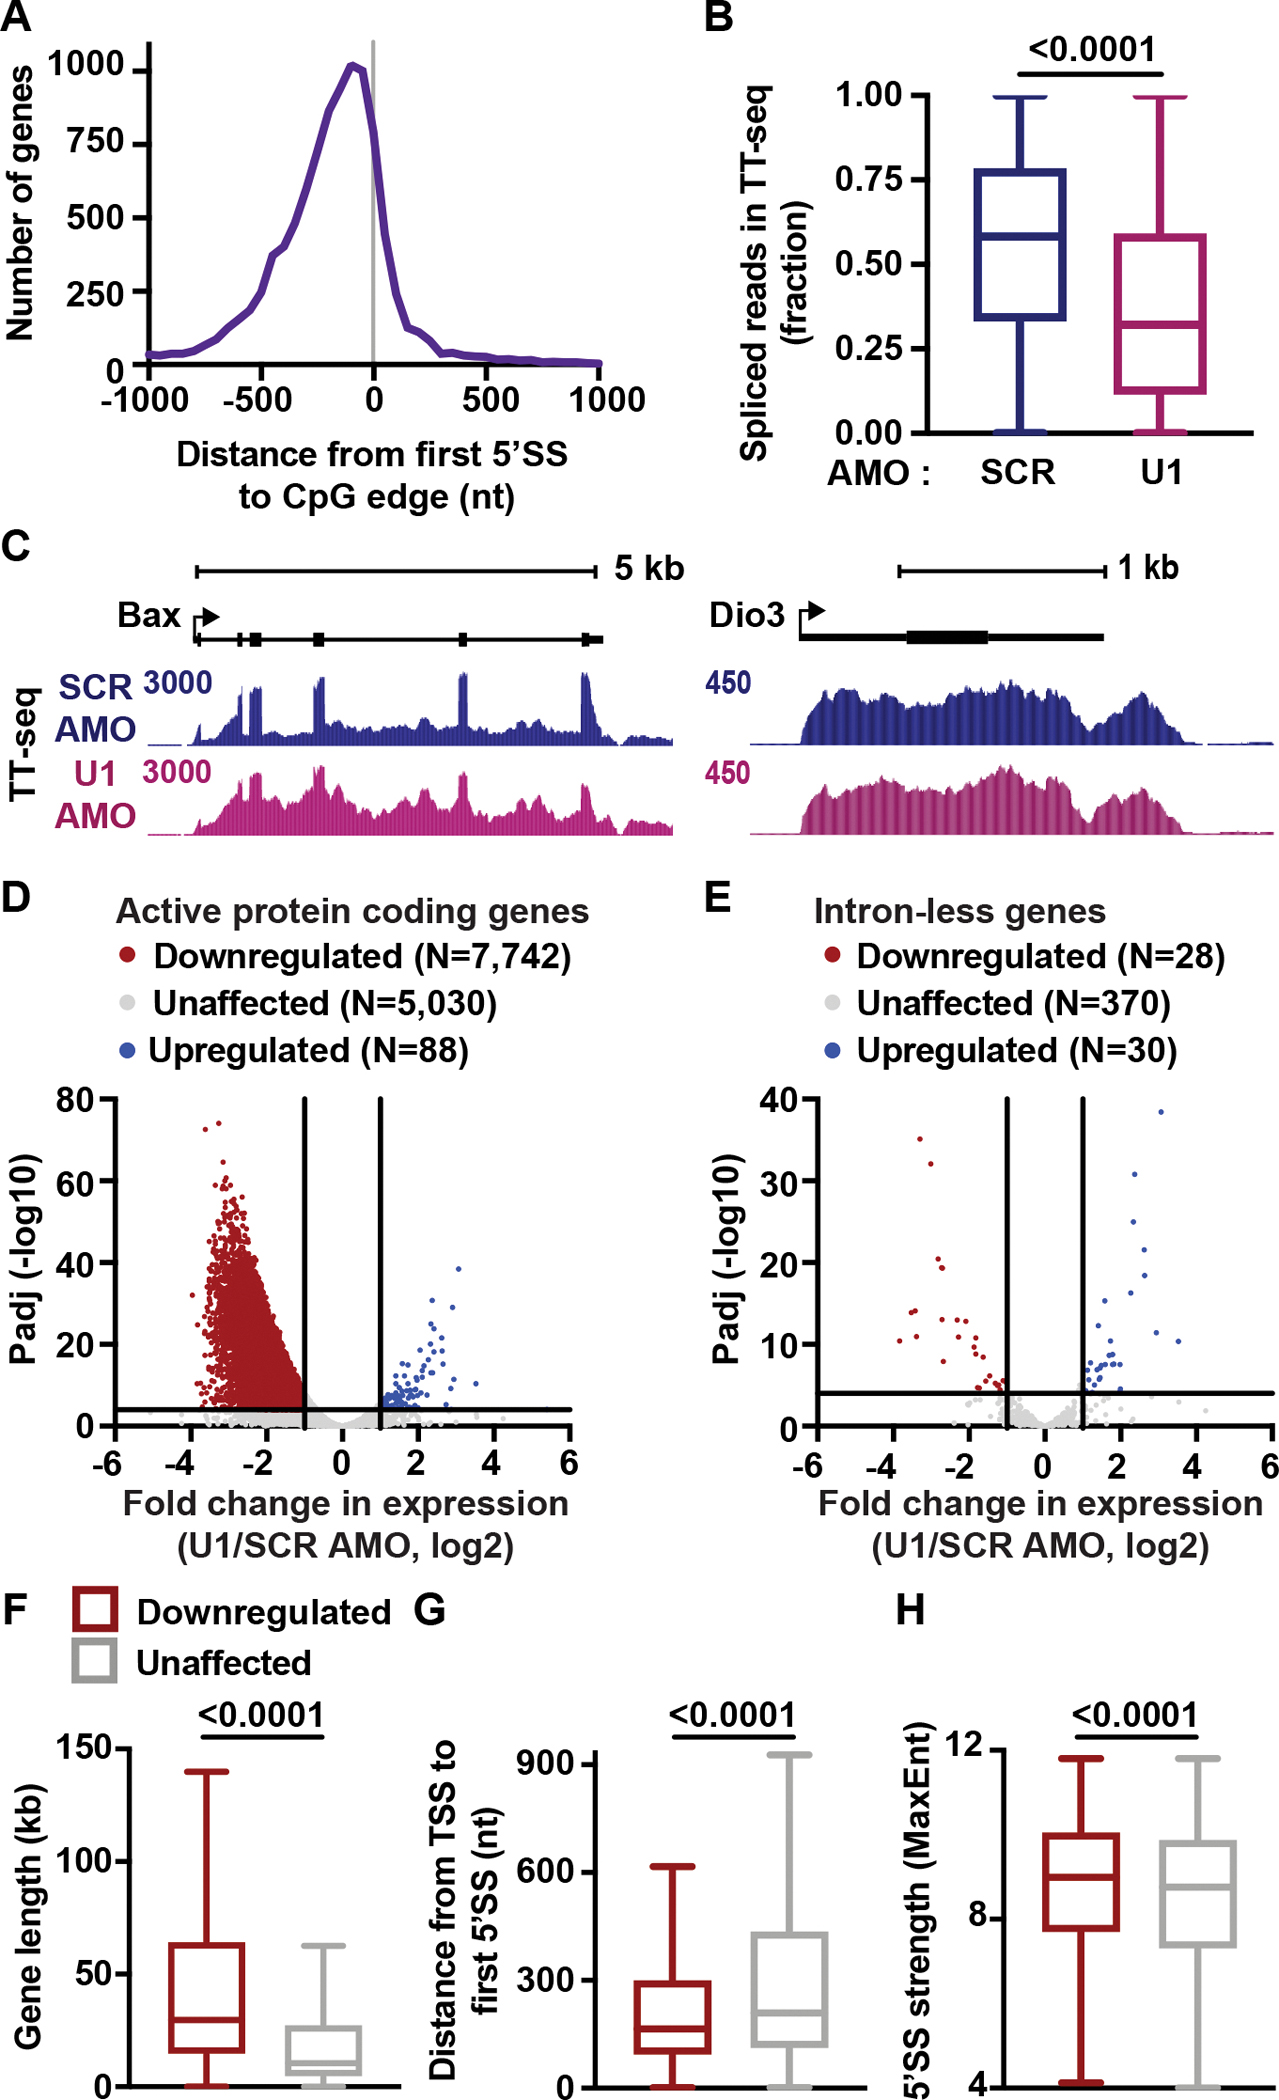
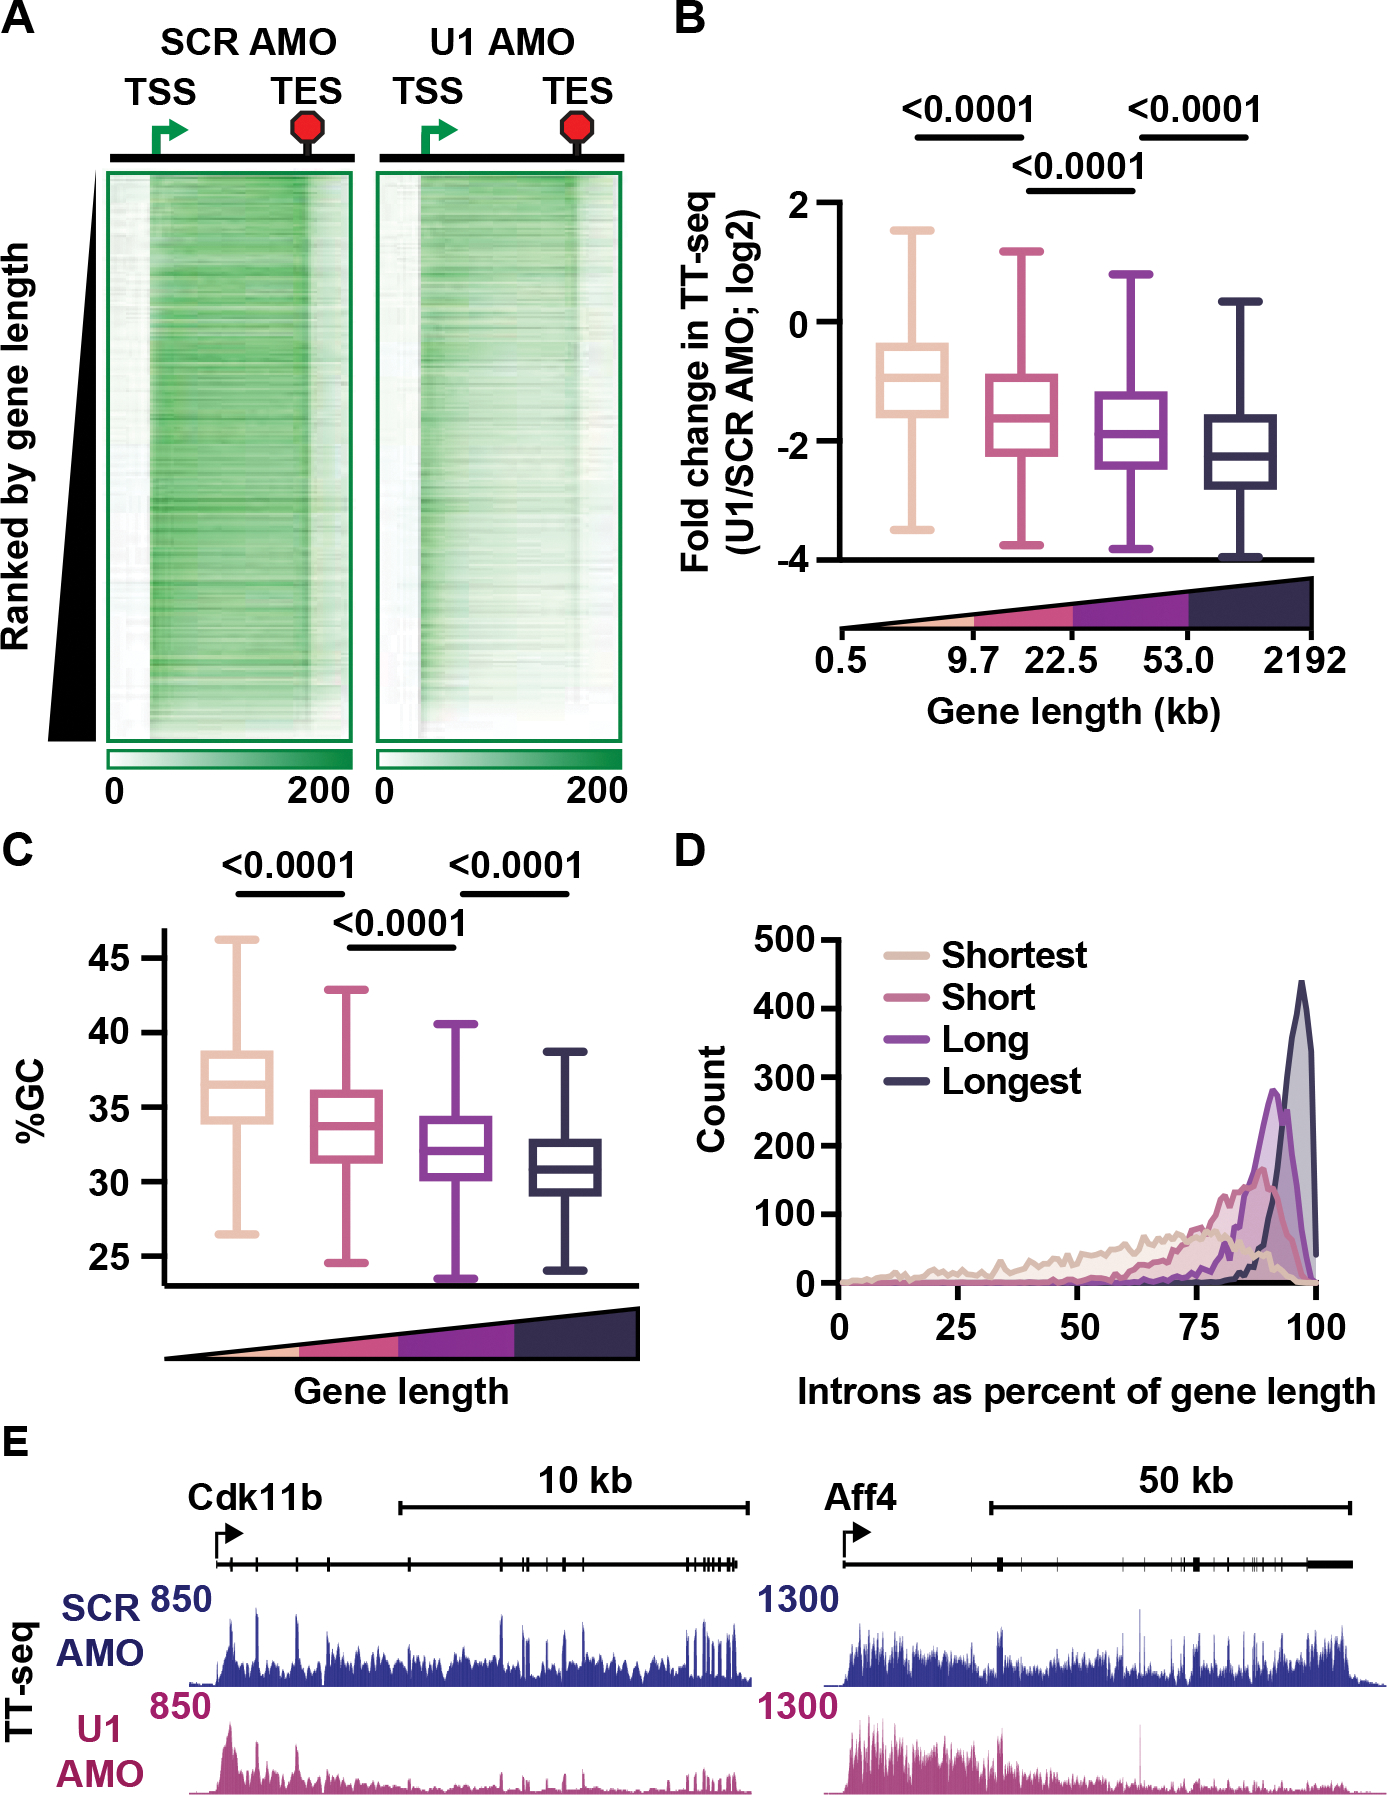
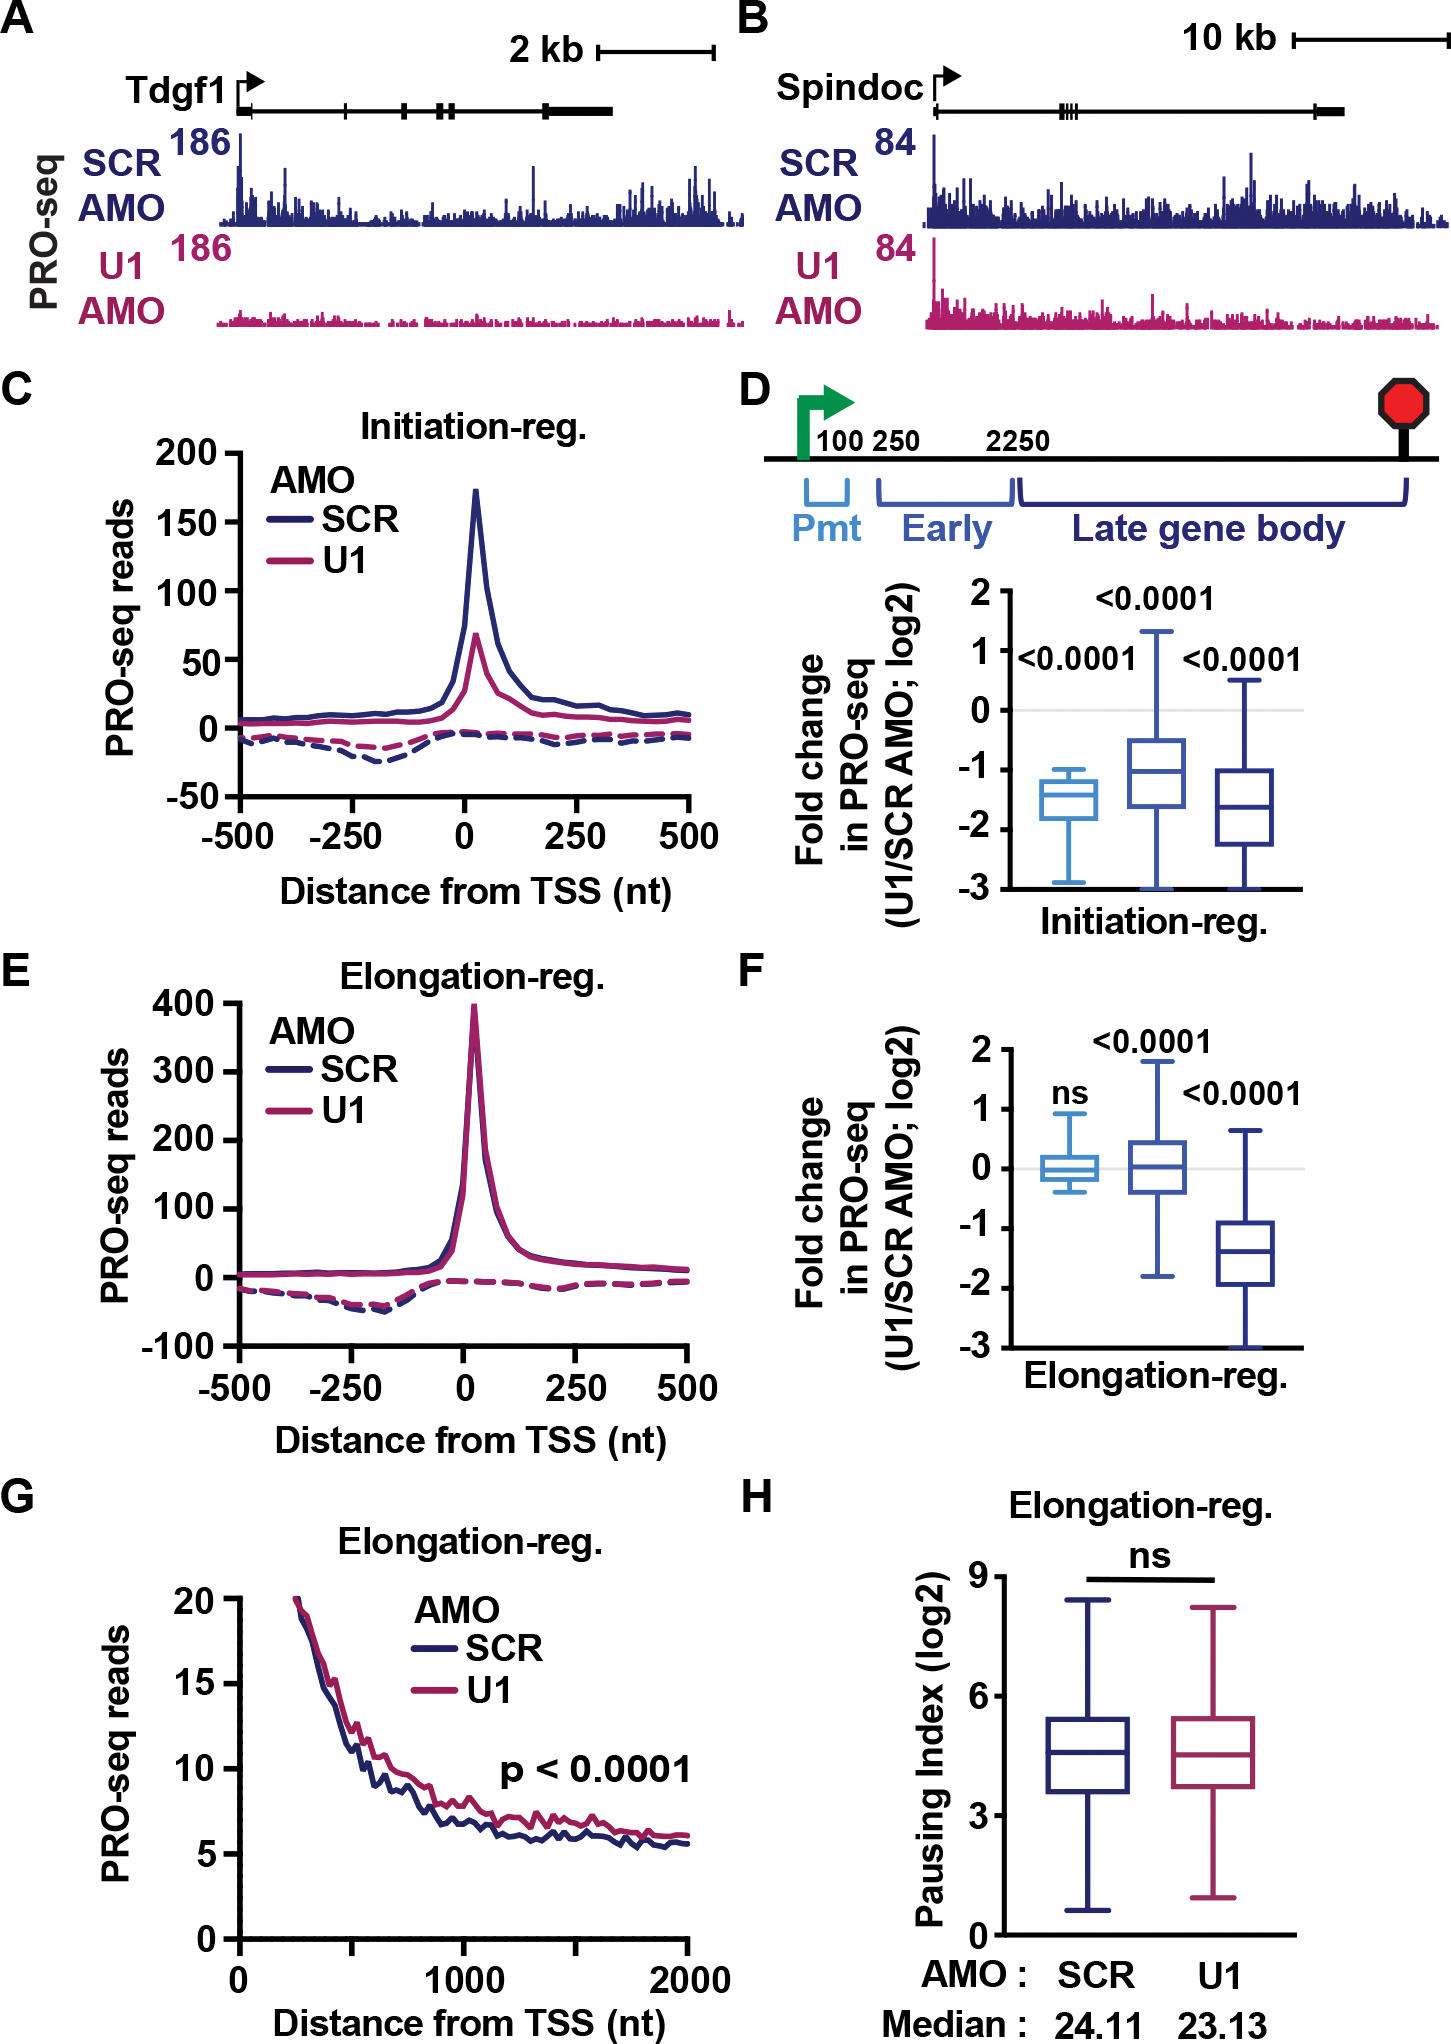
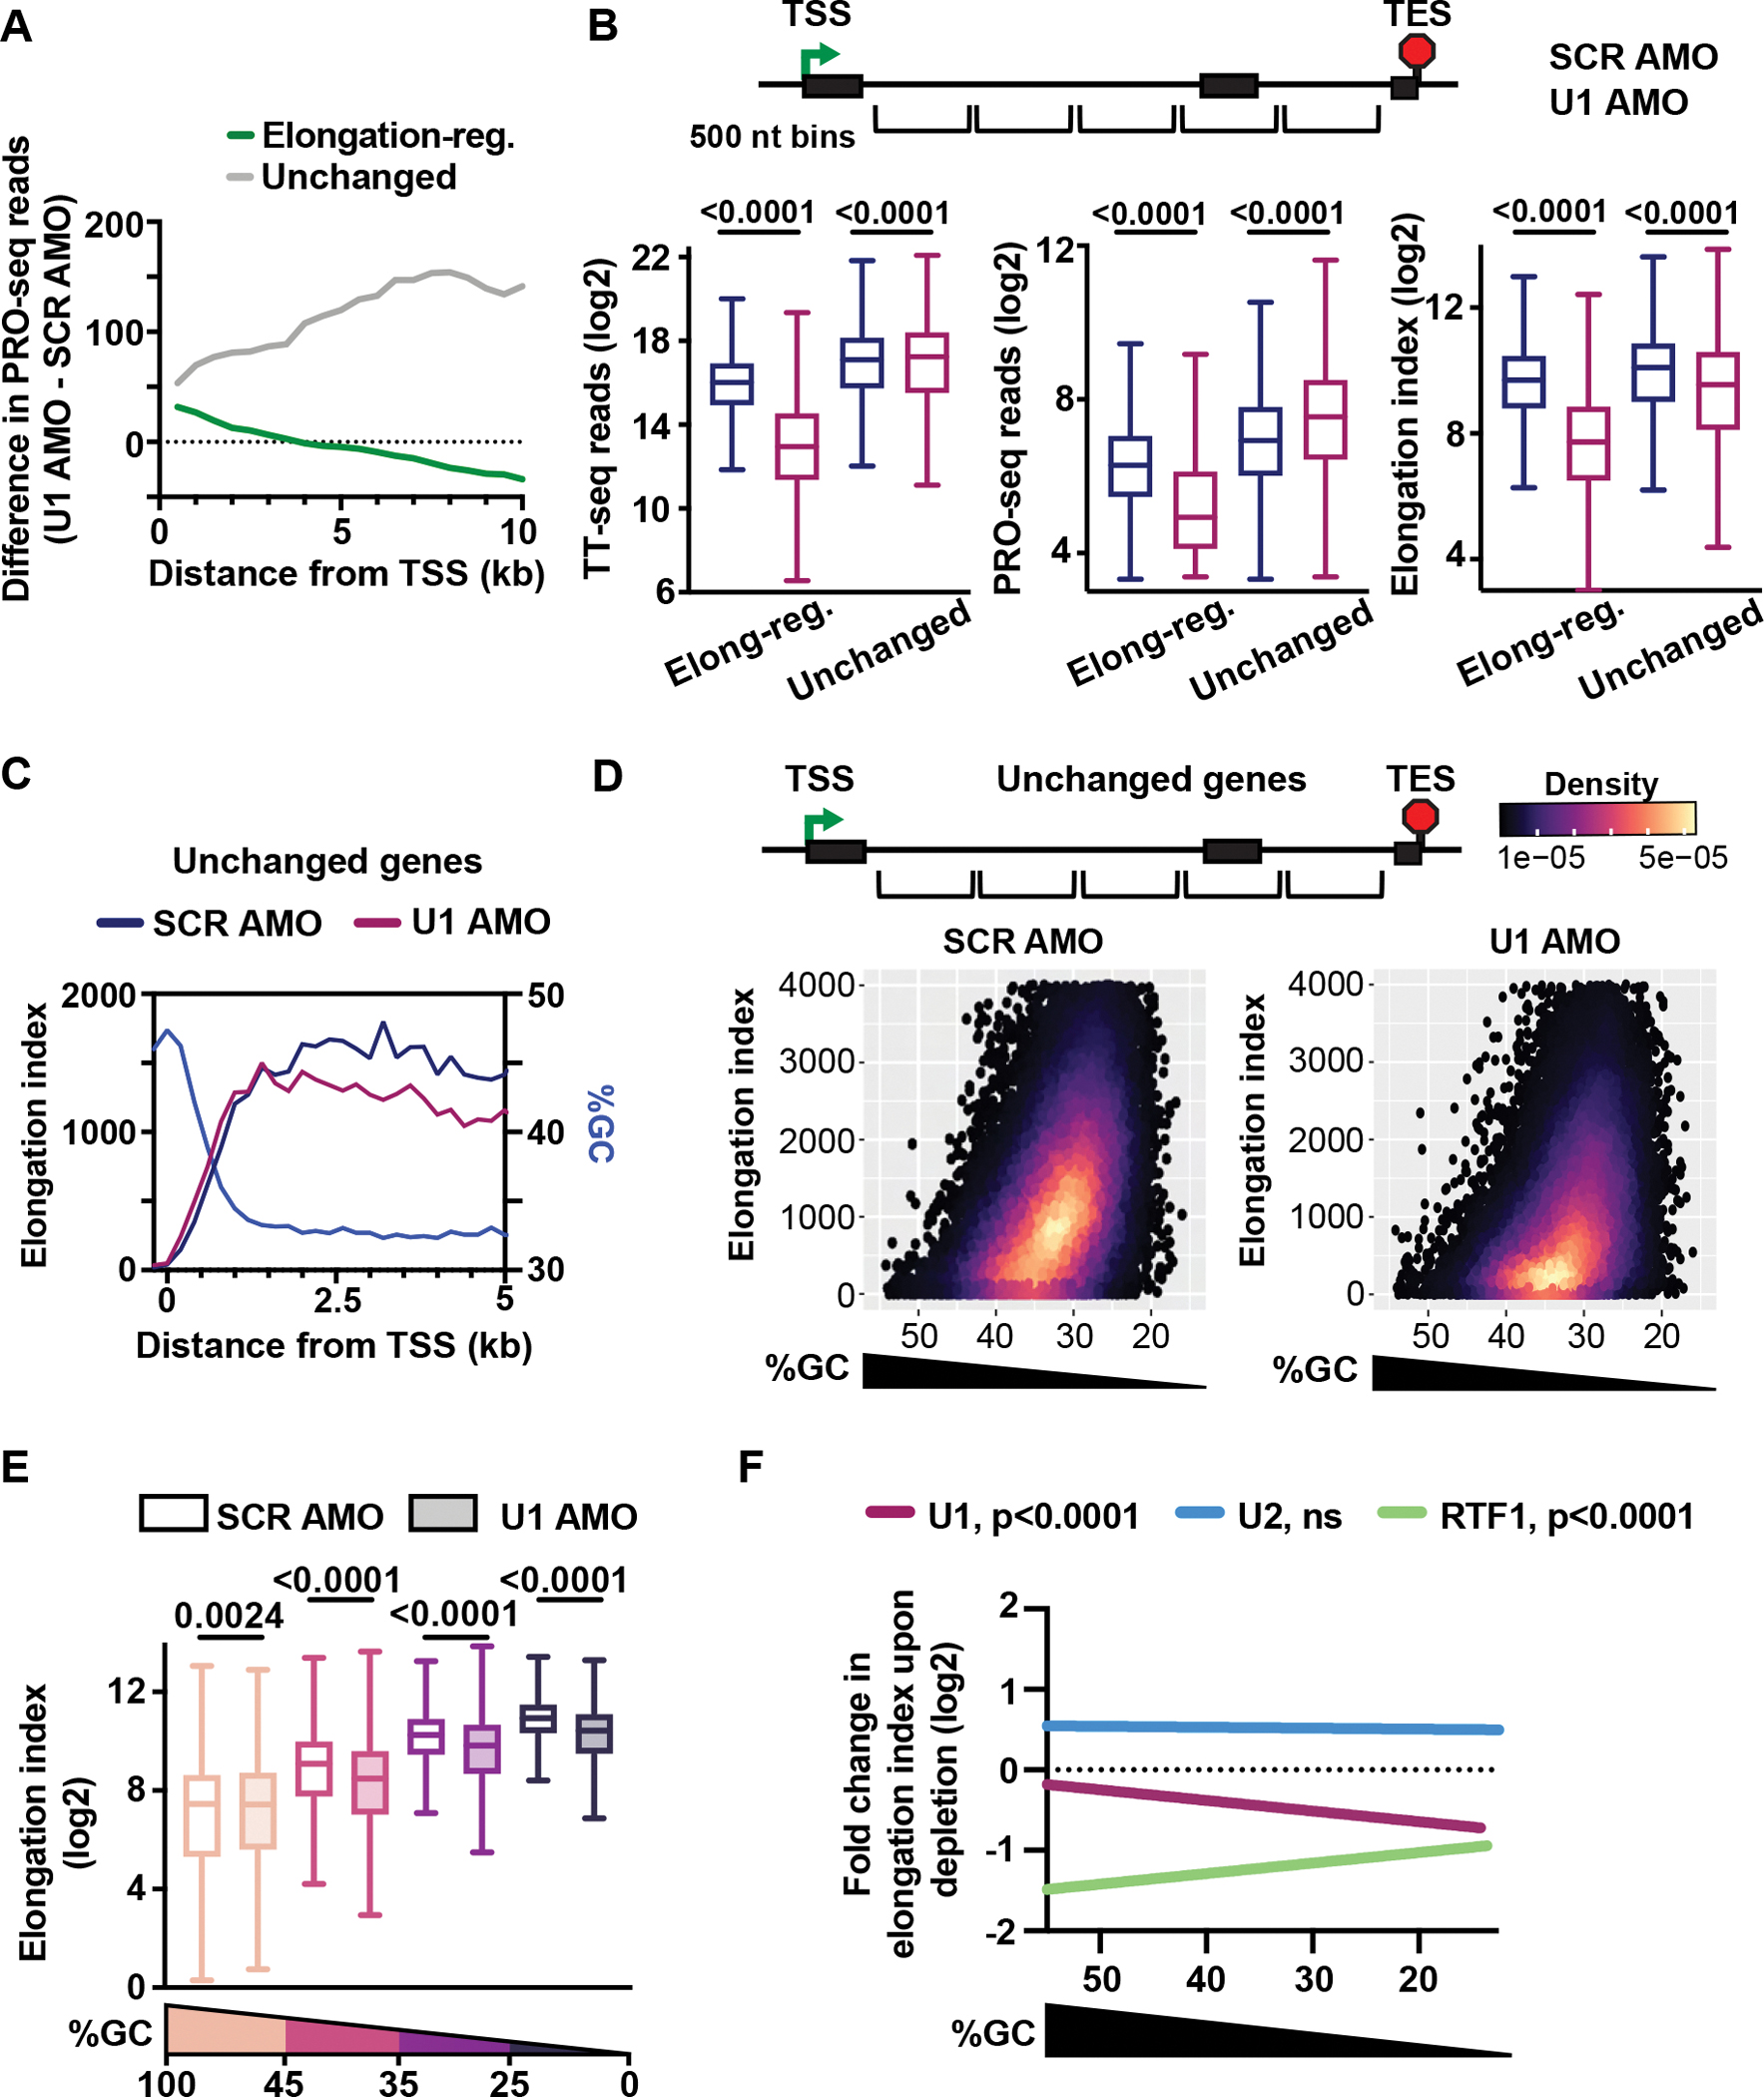
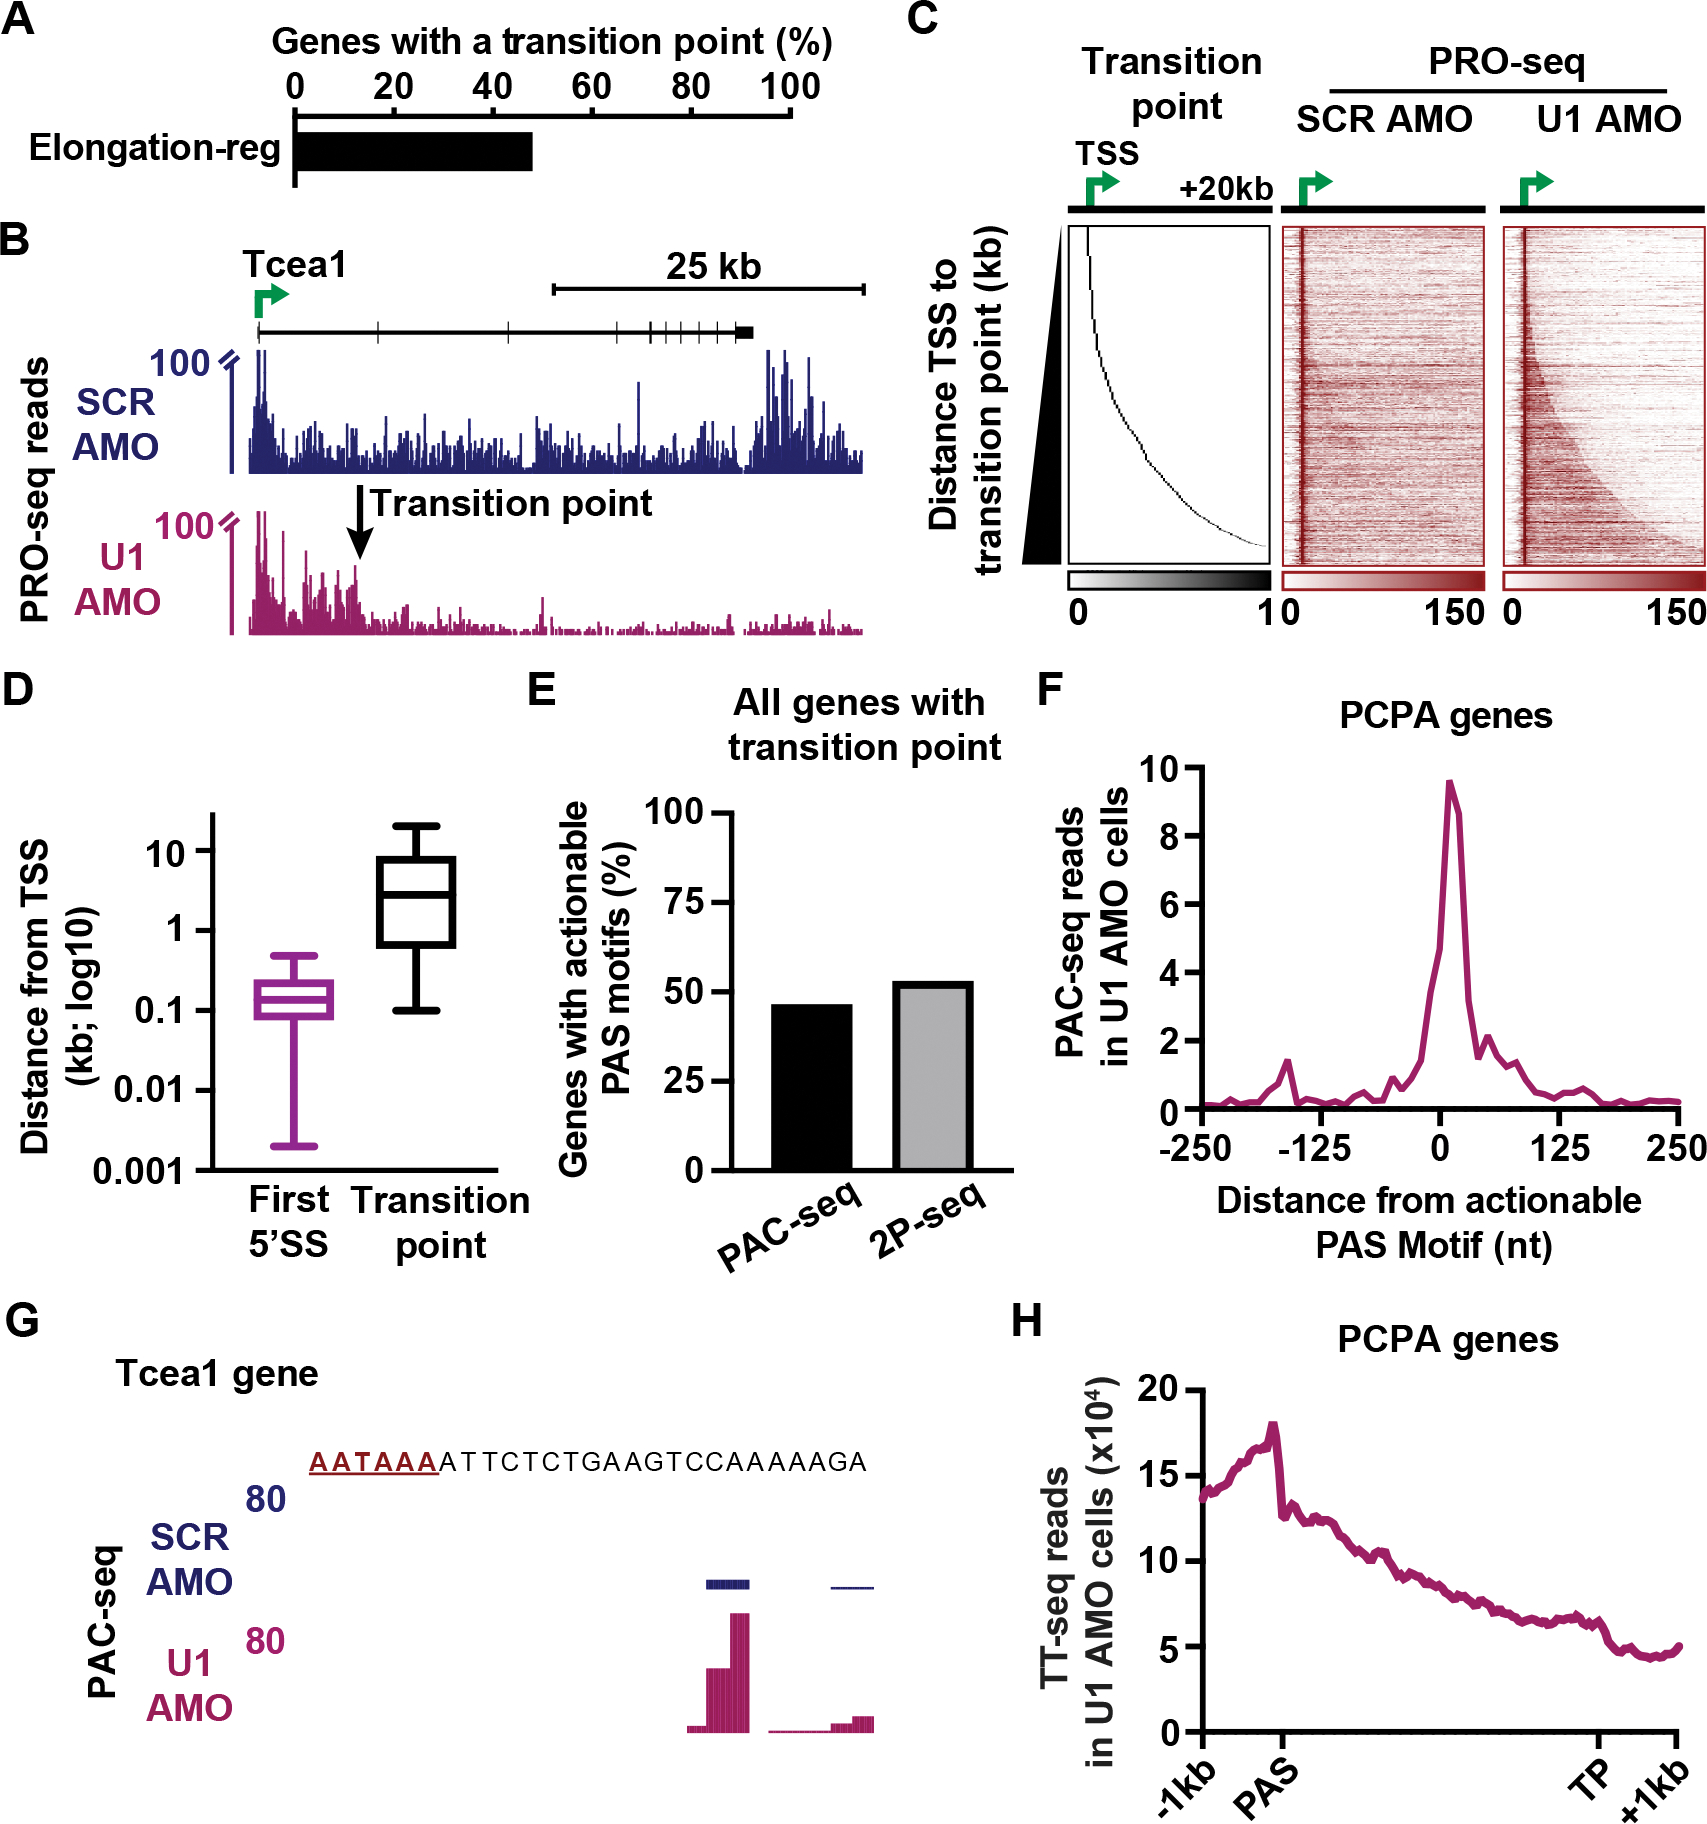
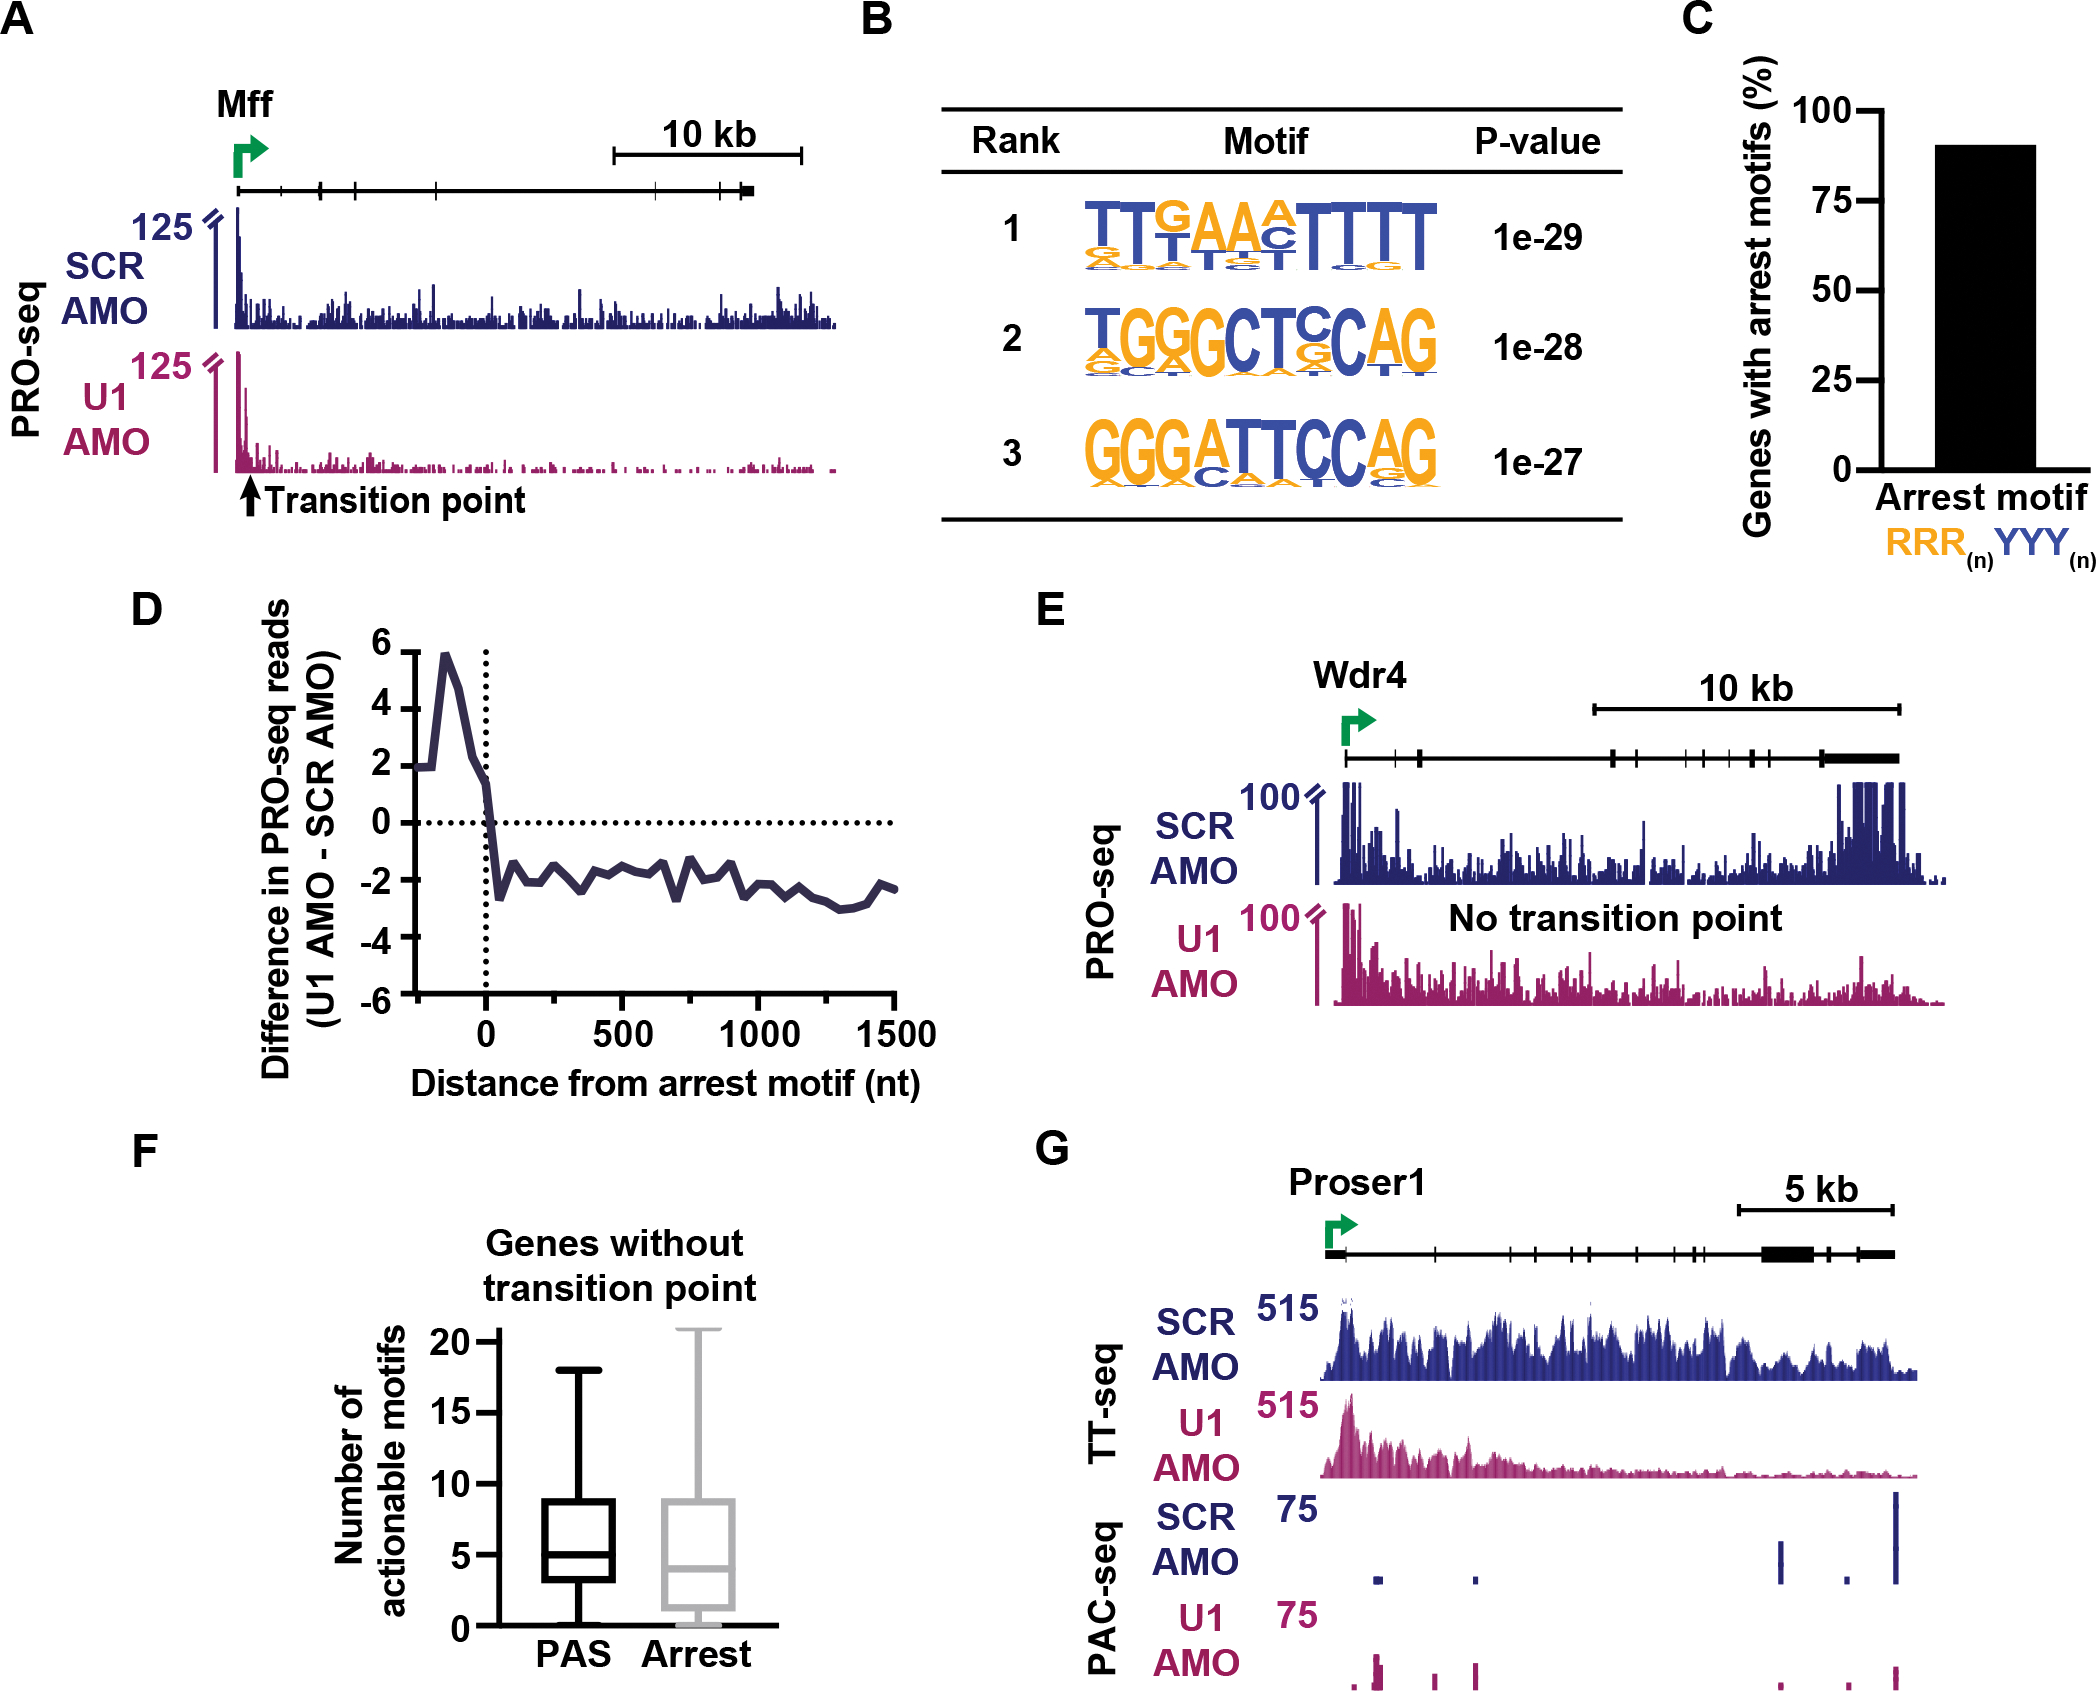
The expansion of introns within mammalian genomes poses a challenge for the production of full-length messenger RNAs (mRNAs), with increasing evidence that these long AT-rich sequences present obstacles to transcription. Here, we investigate RNA polymerase II (RNAPII) elongation at high resolution in mammalian cells and demonstrate that RNAPII transcribes faster across introns. Moreover, we find that this acceleration requires the association of U1 snRNP (U1) with the elongation complex at 5' splice sites. The role of U1 to stimulate elongation rate through introns reduces the frequency of both premature termination and transcriptional arrest, thereby dramatically increasing RNA production. We further show that changes in RNAPII elongation rate due to AT content and U1 binding explain previous reports of pausing or termination at splice junctions and the edge of CpG islands. We propose that U1-mediated acceleration of elongation has evolved to mitigate the risks that long AT-rich introns pose to transcript completion.

Keywords: CpG island; RNA polymerase II; U1 snRNP; co-transcriptional splicing; elongation factors; elongation rate; long genes; nascent RNA; sequence content; transcription regulation.


Conflict of interest statement

Declaration of interests K.A. received research funding from Novartis not related to this work, is on the SAB of CAMP4 Therapeutics, and is a member of the Advisory Board of Molecular Cell.

Figures

Figure 1.
Figure 1.. RNAPII elongation is slower in GC-rich sequences
(A) Indicated data are shown in 500 nt bins across an example gene. (B) Box plot depicts the relationship between elongation index and %GC across active protein coding genes (N = 12,327 intron-containing genes > 1kb). Genes were divided into 500 nt bins starting at the TSS and extending across the gene body, with bins containing the TSS, TES or below read count thresholds removed. Bins were separated into four groups based on %GC (Highest to lowest %GC: N = 2,452; 40,982; 62,740; 3,457). P-values from Mann-Whitney test. (C) Heatmaps of the indicated data are shown for active genes with promoters that overlap a CpG island (N = 9,768). Data is aligned to the downstream edge of the CpG island and summed in 25 nt bins. Genes are ranked by increasing distance from the TSS to the CpG edge. (D) For genes in (C) with an identified upstream antisense TSS (uaTSS; N = 7,449), PAC-seq reads from control (siNT) and RRP40-depleted (siRRP40) cells were summed in the following regions: CpG edge +/− 500 nt; uaRNA, uaTSS to +1 kb. P-values are from paired t-test. (E) Heatmaps of indicated data are aligned to the 3’SS of internal introns (N = 28,019) and ranked by length of the downstream exon. Reads are shown in 10 nt bins.
Figure 2.
Figure 2.. Inhibition of U1 broadly decreases expression of intron-containing genes
(A) Histogram reporting the distance between 5’SS and CpG edge for genes in Figure 1C. A negative distance indicates that the first 5’SS is upstream of the CpG edge. (B) Splicing efficiency (SE) for first introns in protein coding genes was calculated as the number of spliced reads divided by the total number of spliced and unspliced reads per intron. The distribution of SE is shown per condition as a box plot. P-values from Wilcoxon test. (C) TT-seq signal at example genes that have (left) or lack (right) introns. (D) Volcano plot depicting differentially expressed genes in U1 AMO cells. TT-seq reads were calculated within exons and U1-affected genes were defined by DESeq2 (p <0.0001 and Fold Change >2). (E) Same as (D) but highlighting intron-less genes. (F-H) Box plots report the distribution of (F) gene lengths, (G) distances between the TSS and first 5’SS, and (H) the MaxEnt score for first 5’SSs at downregulated and unaffected genes. P-values from Mann-Whitney test.
Figure 3.
Figure 3.. U1 AMO causes a progressive loss of TT-seq signal across long genes
(A) Heatmaps of TT-seq read density at intron-containing genes (N = 12,362), from 2 kb upstream of the TSS to 2 kb downstream of the TES in SCR and U1 AMO conditions. The region between the TSS and TES was scaled by gene length into 100 bins. Genes are ranked by increasing length. (B-D) Genes in A were divided into quartiles based on gene length (Medians per quartile: 5.28 kb, 14.98 kb, 33.04 kb, 97.45 kb). Box plots depict the (B) fold changes in TT-seq signal (summed between the TSS and TES) between U1 and SCR AMO cells, and (C) average GC content per quartile. P-values from Mann-Whitney test. (D) Total intron length as a percentage of gene length is shown for genes in each quartile as a histogram. (E) TT-seq signal at example genes.
Figure 4.
Figure 4.. U1 can stimulate either transcription initiation or elongation
(A-B) PRO-seq signal at an (A) initiation-regulated and (B) elongation-regulated gene. (C) Average PRO-seq signal per condition at downregulated genes classified as initiation-regulated (N= 1,398). Shown are reads for sense (solid lines) and antisense (dotted lines) strands in 25 nt bins, centered on sense TSSs. (D) For initiation-regulated genes longer than 2350 nt (N = 1,378), PRO-seq reads were summed in the indicated gene regions. The fold change in PRO-seq signal between conditions is shown as a box plot. P-values from the Wilcoxon test, comparing between SCR and U1 AMO conditions. (E) Same as (C), but for downregulated genes classified as elongation-regulated (N = 2,696) (F) Same as (D), but for elongation-regulated genes longer than 2350 nt (N = 2,684). (G) Same as (E), but zoomed in view of PRO-seq signal. P-value from Wilcoxon test, comparing reads from +500 nt to +2 kb downstream of the TSS. (H) Pausing index was calculated as the ratio of PRO-seq read density in promoter over early gene body windows. Box plots depict pausing indices at elongation-regulated genes. P-value from Wilcoxon test.
Figure 5.
Figure 5.. RNAPII elongation index is reduced in AT-rich regions upon U1 inhibition
(A) Metagene plot of the difference in PRO-seq reads between SCR and U1 AMO cells for elongation-regulated (N = 2,399) and unchanged (N = 460) genes longer than 10 kb. Reads were summed in 500 nt bins, aligned to TSSs. (B) Box plots depict TT-seq (left) and PRO-seq (middle) read density, and elongation index (right) for 500 nt bins at elongation-regulated (N= 131,315) and unchanged (N= 22,703) genes. P-values from Wilcoxon test. (C) Metagene plot of Elongation index and %GC at unchanged genes > 5 kb (N = 692). Reads were summed in 200 nt bins, aligned to TSSs. (D) Density scatter plot depicting %GC and elongation index at unchanged genes for SCR and U1 AMO cells (500 nt bins). (E) Bins from (D) were divided into groups by %GC (Highest to lowest %GC: N = 1889, 8881, 9979, 1954). Box plots depict elongation index for indicated conditions. P-values from Wilcoxon test. (F) Fold change in elongation index was calculated between control cells and those wherein U1, RTF1 or U2 was inhibited, for bins within unchanged genes (defined for each dataset: U1 as in D; RTF1, N = 65,953; U2, N = 32,078). Scatter plots depicting %GC versus fold change in elongation index were generated (see Figure S5C) and the linear trend lines for each dataset are shown here. P-values from F test.
Figure 6.
Figure 6.. Without U1, RNAPII is susceptible to premature termination
(A) Bar plot depicting the percentage of elongation-regulated genes longer than 10 kb with an identified transition point (N = 1,162 of 2,399 genes). (B) PRO-seq signal at a gene with a defined TP. Reads are shown in 25 nt bins. Y-axis is truncated to highlight gene body signal. (C) Heatmaps of PRO-seq at genes with a TP. Data is aligned to TSSs and ranked by distance from the TSS to the TP. Read counts were summed in 250 nt bins. (D) For genes in C, box plots report the distribution of distances from the TSS to indicated feature. (E) The percentage of genes with TPs that display an actionable PAS motif in U1 AMO cells based on PAC-seq or 2P-seq. (F) Metagene plot of PAC-seq signal at actionable PAS motifs in U1 AMO cells. Reads were summed in 10 nt bins. (G) PAC-seq signal near an actionable PAS motif (red) within the Tcea1 gene. (H) Metagene plot of TT-seq signal in U1 AMO cells is shown from 1 kb upstream of the actionable PAS to 1 kb downstream of the TP (N = 541 genes with actionable PASs). The region between the PAS and TP was scaled by length into 100 bins.
Figure 7.
Figure 7.. RNAPII undergoes more frequent transcriptional arrest in the absence of U1
(A) PRO-seq signal at a gene with a TP but no evidence of PCPA. Reads are shown in 25 nt bins. Y-axis is truncated to highlight gene body signal. (B) Top three enriched motifs within a 100 nt window of the TP at genes without PCPA (N = 621), identified by HOMER. (C) The percentage of TP genes without PCPA that contain an arrest motif within 150 nt of the TP (N = 565). (D) Metagene plot of the difference in PRO-seq signal at arrest motifs near TPs at genes without PCPA. To avoid biases from promoter proximal RNAPII signal, only genes with the arrest motif > 400 nt from the TSS are shown (N= 395). Reads were aligned to the final nt of the arrest motif and summed in 50 nt bins. (E) Same as (A), but for an elongation-regulated gene without a TP. (F) Box plots showing the number of actionable motifs per elongation-regulated gene without a TP (N = 1,237). (G) TT-seq and PAC-seq data at an elongation-regulated gene without a TP.

References

    1. Sidorenkov I, Komissarova N, and Kashlev M (1998). Crucial Role of the RNA:DNA Hybrid in the Processivity of Transcription. Mol. Cell 2, 55–64. 10.1016/S1097-2765(00)80113-6. - DOI - PubMed
    1. Hahn S (2004). Structure and mechanism of the RNA Polymerase II transcription machinery. Nat. Struct. Mol. Biol. 11, 394. 10.1038/NSMB763. - DOI - PMC - PubMed
    1. Osman S, and Cramer P (2020). Structural Biology of RNA Polymerase II Transcription: 20 Years On Pol II: RNA polymerase II. 10.1146/annurev-cellbio-042020. - DOI - PubMed
    1. Chiu AC, Suzuki HI, Wu X, Mahat DB, Kriz AJ, and Sharp PA (2018). Transcriptional Pause Sites Delineate Stable Nucleosome-Associated Premature Polyadenylation Suppressed by U1 snRNP. Mol. Cell 69. 10.1016/j.molcel.2018.01.006. - DOI - PMC - PubMed
    1. Venters CC, Oh JM, Di C, So BR, and Dreyfuss G (2019). U1 snRNP telescripting: Suppression of premature transcription termination in introns as a new layer of gene regulation. Cold Spring Harb. Perspect. Biol. 11. 10.1101/cshperspect.a032235. - DOI - PMC - PubMed

Publication types