. 2023 May;4(5):e340-e348.
doi: 10.1016/S2666-5247(22)00386-X. Epub 2023 Mar 22.

Wastewater concentrations of human influenza, metapneumovirus, parainfluenza, respiratory syncytial virus, rhinovirus, and seasonal coronavirus nucleic-acids during the COVID-19 pandemic: a surveillance study

Affiliations

Wastewater concentrations of human influenza, metapneumovirus, parainfluenza, respiratory syncytial virus, rhinovirus, and seasonal coronavirus nucleic-acids during the COVID-19 pandemic: a surveillance study

Alexandria B Boehm et al. Lancet Microbe. 2023 May.

Abstract

Background: Respiratory disease is a major cause of morbidity and mortality; however, surveillance for circulating respiratory viruses is passive and biased. Wastewater-based epidemiology has been used to understand SARS-CoV-2, influenza A, and respiratory syncytial virus (RSV) infection rates at a community level but has not been used to investigate other respiratory viruses. We aimed to use wastewater-based epidemiology to understand community viral respiratory infection occurrence.

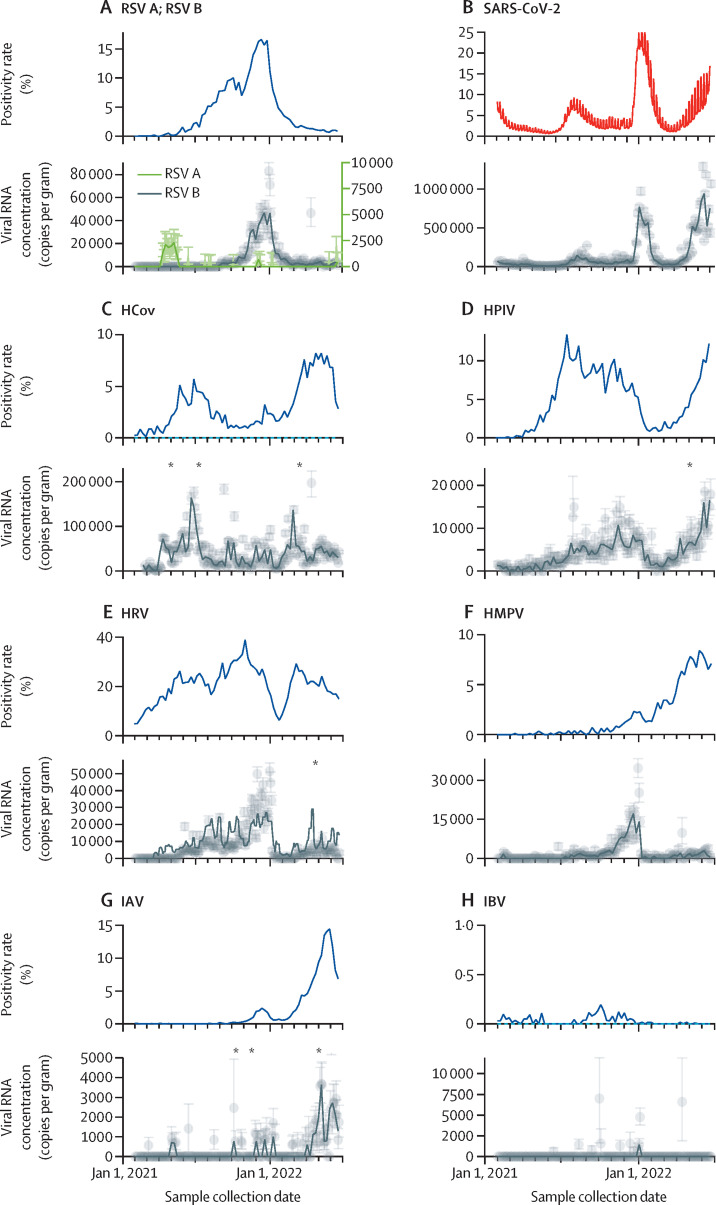
Methods: A retrospective wastewater-based epidemiology surveillance study was carried out at a large wastewater treatment plant located in California, USA. Using droplet digital RT-PCR, we measured RNA concentrations of influenza A and influenza B viruses, RSV A and RSV B, parainfluenza (1-4) viruses, rhinovirus, seasonal coronaviruses, and metapneumovirus in wastewater solids three times per week for 17 months (216 samples) between Feb 1, 2021, and June 21, 2022. Novel probe-based RT-PCR assays for non-influenza viral targets were developed and validated. We compared viral RNA concentrations to positivity rates for viral infections from clinical specimens submitted to California Sentinel Clinical Laboratories (sentinel laboratories) to assess concordance between the two datasets.

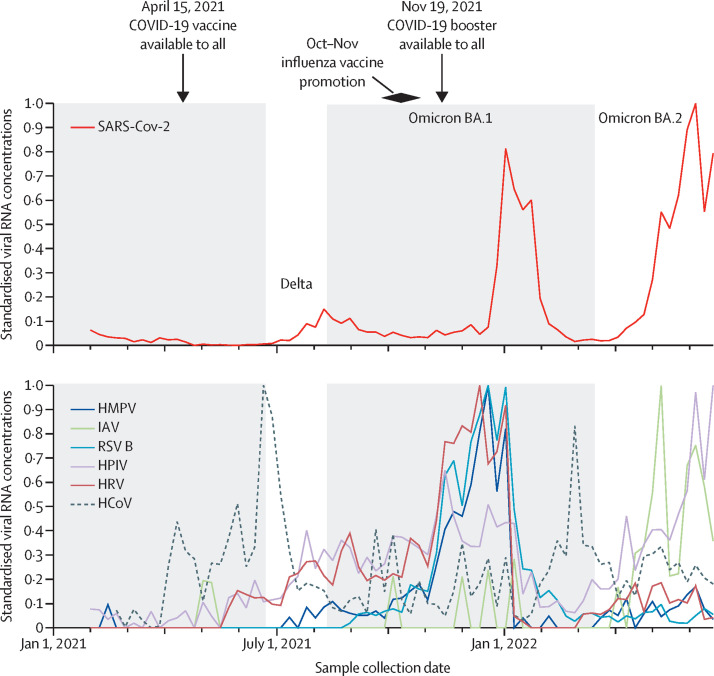
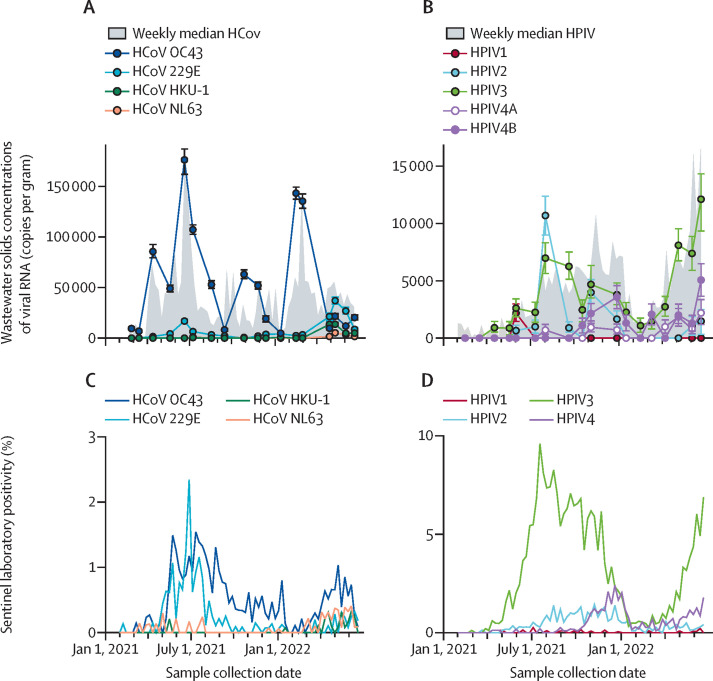
Findings: We detected RNA from all tested viruses in wastewater solids. Human rhinovirus (median concentration 4300 [0-9500] copies per gram dry weight) and seasonal human coronaviruses (35 000 [17 000-56 000]) were found at the highest concentrations. Concentrations of viral RNA correlated significantly and positively with positivity rates of associated viral diseases from sentinel laboratories (tau 0·32-0·57, p<0·0009); the only exceptions were influenza B and RSV A, which were rarely detected in wastewater solids. Measurements from wastewater indicated coronavirus OC43 dominated the seasonal human coronavirus infections whereas parainfluenza 3 dominated among parainfluenza infections during the study period. Concentrations of all tested viral RNA decreased noticeably after the omicron BA.1 surge suggesting a connection between changes in human behaviour during the surge and transmission of all respiratory viruses.

Interpretation: Wastewater-based epidemiology can be used to obtain information on circulation of respiratory viruses at a localised, community level without the need to test many individuals because a single sample of wastewater represents the entire contributing community. Results from wastewater can be available within 24 h of sample collection, generating real time information to inform public health responses, clinical decision making, and individual behaviour modifications.

Funding: CDC Foundation.


Conflict of interest statement

Declaration of interests BH, DD, VC-H, AB, and BJW are employees of Verily Life Sciences. All other authors declare no competing interests.

Figures

Figure 1
Figure 1
State-aggregated positivity rate and viral RNA in wastewater solids Grey symbols represent measurements; error bars are SD. Black lines represent Morbidity and Mortality Weekly Report weekly median wastewater measurements. Asterisks indicate dates for which a point is off scale. (A) RSV positivity rates include RSV A and RSV B. (B) SARS-CoV-2 wastewater results and state-aggregated positivity rate are from all laboratories in the state (not just sentinel laboratories) and are shown in red to distinguish from other clinical data. (C) HCoV is the sum of all four seasonal HCoVs (ie, OC43, HKU-1, 229E, and NL63); three measurements were located off scale (1·1 × 106 copies per gram on April 9, 2021, 3·6 × 105 on June 24, 2021, and 5·1 × 105 on March 3, 2022). (D) HPIV is the sum of HPIVs (1–4); one measurement was located off scale (3·6 × 104 copies per gram on April 14, 2022). (E) HRV includes HRV A, B, and C; one measurement was located off scale (7·6 × 104 copies per gram on April 14, 2022). (G) Three IAV measurements were located off scale (2·1 × 104 copies per gram on Sept 30, 2021, 7·5 × 104 on Oct 31, 2021, and 1·5 × 104 on April 14, 2022). RSV=respiratory syncytial virus. HCoV=human coronaviruses. HPIV=human parainfluenza viruses. HRV=human rhinovirus. HMPV=human metapneumovirus. IAV=influenza A virus. IBV=influenza B virus.
Figure 2
Figure 2
Standardised concentrations of viral RNA Standardised concentrations of viral RNA for all viruses except for RSV A and influenza B virus, which were rarely detected, to allow for clear visualisation of concordance in the reduction of virus concentrations after the omicron BA.1 surge, and the rise of HCoV concentrations shortly thereafter. The grey shaded backgrounds indicate periods of time that indoor masking mandates were in effect locally. The red SARS-CoV-2 line is labelled with the dominating circulating variant at the time. Standardised concentrations were calculated using the following formula: Cst(t) = (C(t) – Cmin)/(Cmax– Cmin), where Cst(t) is the standardised concentration at a given week t, C(t) is the Morbidity and Mortality Weekly Report weekly median concentration shown in figure 1 at week t, Cmin is the minimum concentration, and Cmax is the maximum concentration. HMPV=human metapneumovirus. IAV=influenza A virus. RSV=respiratory syncytial virus. HPIV=human parainfluenza viruses. HRV=human rhinovirus. HCoV=human coronavirus.
Figure 3
Figure 3
Concentrations of viral RNA in wastewater solids and comparison to sentinel laboratory percent positivity data (A) Concentration of total HCoV RNA (weekly medians from figure 1 shown as grey filled areas) and individual HCoVs. (B) Concentrations of total concentration of HPIV RNA (weekly medians from figure 1 shown as grey filled areas) and individual HPIVs. (C) State-aggregated percent positivity from sentinel laboratories for tests for individual HCoVs. (D) State-aggregated percent positivity from sentinel laboratories for tests for individual HPIVs. Percent positivity for unknown HCoV and unknown HPIV from the sentinel laboratories surveillance system are not shown in panels C and D. Error bars on individual HCoV and HPIV are SDs and in some cases are smaller than the symbol. HCoV=human coronavirus. HPIV=human parainfluenza virus.

Similar articles

Cited by

References

    1. Wang H, Bhutta ZA, Coates MM, et al. Global, regional, national, and selected subnational levels of stillbirths, neonatal, infant, and under-5 mortality, 1980–2015: a systematic analysis for the Global Burden of Disease Study 2015. Lancet. 2016;388:1725–1774. - PMC - PubMed
    1. Moriyama M, Hugentobler WJ, Iwasaki A. Seasonality of respiratory viral infections. Annu Rev Virol. 2020;7:83–101. - PubMed
    1. Henrickson KJ. Advances in the laboratory diagnosis of viral respiratory disease. Pediatr Infect Dis J. 2004;23(suppl 1):S6–10. - PubMed
    1. Killerby ME, Biggs HM, Haynes A, et al. Human coronavirus circulation in the United States 2014–2017. J Clin Virol. 2018;101:52–56. - PMC - PubMed
    1. Kuitunen I, Artama M, Haapanen M, Renko M. Respiratory virus circulation in children after relaxation of COVID-19 restrictions in fall 2021—a nationwide register study in Finland. J Med Virol. 2022;94:4528–4532. - PMC - PubMed

Publication types

MeSH terms