. 2023 May;299(5):104649.
doi: 10.1016/j.jbc.2023.104649. Epub 2023 Mar 24.

The Batten disease protein CLN3 is important for stress granules dynamics and translational activity

Affiliations

The Batten disease protein CLN3 is important for stress granules dynamics and translational activity

Emily L Relton et al. J Biol Chem. 2023 May.

Abstract

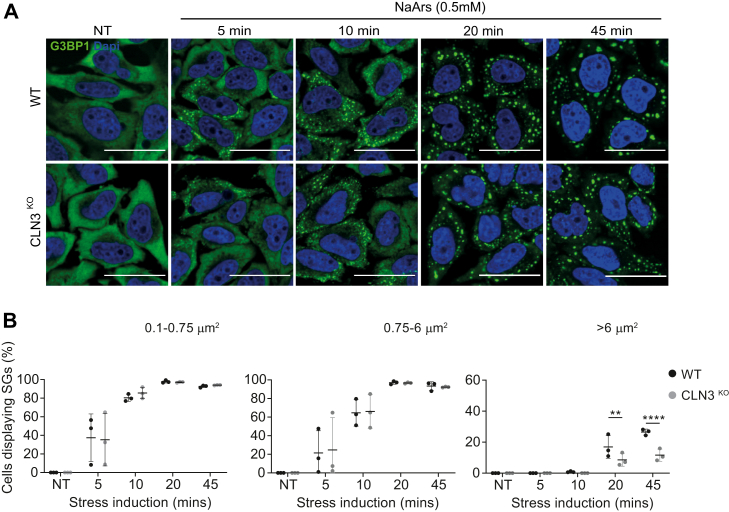
The assembly of membrane-less organelles such as stress granules (SGs) is emerging as central in helping cells rapidly respond and adapt to stress. Following stress sensing, the resulting global translational shutoff leads to the condensation of stalled mRNAs and proteins into SGs. By reorganizing cytoplasmic contents, SGs can modulate RNA translation, biochemical reactions, and signaling cascades to promote survival until the stress is resolved. While mechanisms for SG disassembly are not widely understood, the resolution of SGs is important for maintaining cell viability and protein homeostasis. Mutations that lead to persistent or aberrant SGs are increasingly associated with neuropathology and a hallmark of several neurodegenerative diseases. Mutations in CLN3 are causative of juvenile neuronal ceroid lipofuscinosis, a rare neurodegenerative disease affecting children also known as Batten disease. CLN3 encodes a transmembrane lysosomal protein implicated in autophagy, endosomal trafficking, metabolism, and response to oxidative stress. Using a HeLa cell model lacking CLN3, we now show that CLN3KO is associated with an altered metabolic profile, reduced global translation, and altered stress signaling. Furthermore, loss of CLN3 function results in perturbations in SG dynamics, resulting in assembly and disassembly defects, and altered expression of the key SG nucleating factor G3BP1. With a growing interest in SG-modulating drugs for the treatment of neurodegenerative diseases, novel insights into the molecular basis of CLN3 Batten disease may reveal avenues for disease-modifying treatments for this debilitating childhood disease.

Keywords: Batten disease; CLN3; NCL; metabolism; stress; stress granules; translation control.


Conflict of interest statement

Conflict of interest The authors declare that they have no conflicts of interest with the contents of this article.

Figures

Figure 1
Figure 1
Loss of CLN3 alters metabolic activity and global protein synthesis. Metabolic, proteostatic, and signaling defects accompany CLN3 loss in HeLa cells (A) efficacy of glycolysis was measured by extracellular acidification rate (ECAR). CLN3KO HeLa cells display reduced glycolytic flux as compared with WT at baseline conditions. The same trend is observed after challenge with NaArs, which increases glycolytic flux irrespective of genotype. The figure shows the mean ± SD, of three separate experiments analyzed by two-way analysis of variance with Dunnett’s multiple comparisons test. B, mitochondrial respiration was assessed using oxygen consumption rate (OCR). CLN3KO HeLa cells display reduced OCR under NT (baseline) conditions. Challenge with NaArs increases OCR in both genotypes but is significantly lower in CLN3KO HeLa cells. The figure shows the mean ± SD, of three separate experiments analyzed by two-way analysis of variance with Dunnett’s multiple comparisons test: ∗∗p < 0.01; ∗∗∗p < 0.001. C and D, efficacy of de novo protein synthesis assessed by measuring integrated density values of single cells. Immunofluorescent images of puromycin incorporation (green) with nuclei stained with DAPI (blue). The scale bar represents 40 μm. The figure shows the mean ± SD, of three separate experiments analyzed by one-way analysis of variance with Sidak’s multiple comparisons test: ∗∗∗∗p < 0.001. D and E, polysome fractions in both WT and CLN3KO HeLa cells in NT condition. CLN3KO HeLa cells exhibit fewer polysomes compared with WT in NT conditions characteristic of reduced rate of translation while NaArs treatment depletes polysome fraction in WT and CLN3KO HeLa cells. Polysomes were prepared as detailed under “Experimental Procedures.” The displayed trace represents absorbance at 254 nm (vertical axis) throughout the gradient from top (left) to bottom (right). 80 S (monosome) and polysome peaks are labeled. F, the areas below the monosome and polysome peaks were determined for several biological replicates (n = 3), and the mean polysome:monosome (P/M) ratio was calculated by measuring the area under the polysomal (P) to monosomal (M) peaks using standard area under the curve methods. The figure shows the mean ± SD, of three separate experiments analyzed by two-way analysis of variance with Dunnett’s multiple comparisons test: ∗∗∗∗p < 0.001. G, heatmap shows differences in phosphorylation status of a panel of target residues spanning various stress-activated signaling pathways. Decreased phosphorylation of HSP27 (S78/S82), JNK1/2/3 (T183/Y185, T221/Y223), and p38α (T180/Y182). The figure shows the mean ± SD, of three separate experiments analyzed by two-way analysis of variance with Dunnett’s multiple comparisons test: ∗p < 0.05; ∗∗∗p < 0.001.
Figure 2
Figure 2
CLN3KOHeLa cells display defect in stress granule (SG) induction pathway.A, representative immunofluorescence images show time course of SG induction after NaArs treatment. Cells were stained with the SG marker G3BP1 (green) and the nuclei marker DAPI (blue). The scale bar represents 40 μm. B, quantification of small (0.1–0.75 μm2), medium (0.75–6 μm2), and large (>6 μm2) puncta shown as % cells displaying SGs. The figure shows the mean ± SD, of three separate experiments, with >100 cells analyzed for each condition, analyzed by one-way analysis of variance with Sidak’s multiple comparisons test: ∗∗p < 0.01; ∗∗∗∗p < 0.001.
Figure 3
Figure 3
CLN3KOHeLa cells display defect in clearance of NaArs-induced stress granules (SGs).A, representative immunofluorescence images show time course of SG clearance after NaArs challenge. The scale bar represents 40 μm. Cells were stained for SG markers G3BP1 (green) and eIF3B (magenta). Nuclei were stained with DAPI (blue). B, quantification of small (0.1–0.75 μm2), medium (0.75–6 μm2), and large (>6 μm2) puncta using ImageJ plugin Aggrecount shown as % cells displaying SGs. The figure shows the mean ± SD, of six separate experiments, with >100 cells analyzed for each condition, analyzed by one-way analysis of variance with Sidak’s multiple comparisons test: ∗p < 0.05.
Figure 4
Figure 4
Impaired stress granule (SG) clearance is a CLN3-specific phenotype.A, rate of SG recovery was assessed in an alternative Batten disease model, CLN5KO HeLa cells. Representative immunofluorescence images show time course of SG clearance after NaArs challenge. The scale bar represents 40 μm. Cells were stained for G3BP1 (green) and eIF3B (magenta). B, quantification of small (0.1–0.75 μm2), medium (0.75–6 μm2), and large (>6 μm2) puncta using ImageJ plugin Aggrecount shown as % cells displaying SGs. Results shown as mean ± SD, n = 3. The figure shows the mean ± SD, of three separate experiments, with >100 cells analyzed for each condition, analyzed by one-way analysis of variance with Sidak’s multiple comparisons test: ∗∗p < 0.01; ∗∗∗p < 0.001.
Figure 5
Figure 5
The dynamics of eIF2α-independent stress granules (SGs) is not affected in CLN3KOHeLa cells.A, representative immunofluorescence images show time course of SG clearance after Hippuristanol challenge. The scale bar represents 40 μm. Cells were stained for SG markers G3BP1 (green) and eIF3B (magenta). Nuclei were stained with DAPI (blue). B, quantification of small (0.1–0.75 μm2), medium (0.75–6 μm2), and large (>6 μm2) puncta using ImageJ plugin Aggrecount shown as % cells displaying SGs. Results show mean ± SD, n = 6. The figure shows the mean ± SD, of six separate experiments, with >100 cells analyzed for each condition, analyzed by one-way analysis of variance with Sidak’s multiple comparisons test.
Figure 6
Figure 6
Paraspeckles dynamics is affected in CLN3KOHeLa cells. WT and CLN3KO HeLa cells were stained for the paraspeckles marker lcRNA NEAT-1 using RNA FISH after NaArs challenge and quantitated during recovery from stress. Quantification of paraspeckles area per % of nuclei area (A), and paraspeckles number per cell (B), was performed using ImageJ plugin Aggrecount. The figure shows the mean ± SD, of three separate experiments, with >100 cells analyzed for each condition, analyzed by two-way analysis of variance with Dunnett’s multiple comparisons test: ∗p < 0.05; ∗∗∗p < 0.001.
Figure 7
Figure 7
The impaired clearance of NaArs-induced stress granules (SGs) is conserved in patient-derived fibroblasts.A, representative immunofluorescence images show time course of SG clearance after NaArs challenge in two healthy controls and two CLN3 patients-derived fibroblasts (lines 523N and 526N, 478Pa and 481Pa, respectively). The scale bar represents 50 μm. Cells were stained for SG markers G3BP1 (green) and eIF3B (magenta). Nuclei were stained with DAPI (blue). Representative images are shown with white arrows pointing at persistent SGs during the recovery phase. B, quantification of small (0.1–0.75 μm2), medium (0.75–6 μm2), and large (>6 μm2) puncta using ImageJ plugin Aggrecount shown as % cells displaying SGs. Results show mean ± SD, n = 6. The figure shows the mean ± SD, of three separate experiments, with >100 cells analyzed for each condition, analyzed by one-way analysis of variance with Sidak’s multiple comparisons test: ∗∗∗p < 0.001; ∗∗∗∗p < 0.0001.
Figure 8
Figure 8
Stress granule (SG) disassembly defect is not linked to impaired eIF2α signaling or SG chaperones activity.A, immunoblotting analysis of eIF2α phosphorylation (Ser51) shows no difference in CLN3KO HeLa cells compared with WT in NT, NaArs treated, and 3 h post NaArs conditions. Molecular weights are indicated to the left (kDa). B, RT-qPCR analysis of SG chaperones HSP90AA1, HSP90AB1, and DYRK3 mRNA expression in response to NaArs challenge and 3 h post stress. The figure shows the mean ± SD, of three separate experiments, normalized to β-tubulin mRNA and shown relative to WT NT expression level, analyzed by two-way analysis of variance with Dunnett’s multiple comparisons test: n.s, not significant.
Figure 9
Figure 9
Reduced G3BP1 levels in loss of G3BP1 models.A, RT-qPCR analysis in CLN3KO HeLa cells of stress granule (SG) resident proteins G3BP1, Caprin-1, UBAP2L, TIA-1, and eIF3B as well as β-actin mRNA as control. The figure shows the mean ± SD, of three separate experiments, normalized to β-tubulin mRNA and shown relative to WT NT expression level, analyzed by two-way analysis of variance with Dunnett’s multiple comparisons test: ∗p < 0.05. B, RT-qPCR analysis of SG resident proteins G3BP1, Caprin-1, and UBAP2L mRNAs in healthy controls or patient-derived fibroblasts (lines 523N and 526N, 478Pa and 481Pa, respectively). The figure shows the mean ± SD, of three separate experiments, normalized to β-tubulin mRNA and shown relative to WT NT expression level, analyzed by two-way analysis of variance with Dunnett’s multiple comparisons test: ∗p < 0.05. C, Western blot analysis of G3BP1, G3BP2, TDP-43, and GAPDH in WT and CLN3KO HeLa cells, and healthy controls or patient-derived fibroblasts (lines 523N and 478Pa, respectively). The relative levels of G3BP1 in input fraction are shown, normalized to levels in WT cells. Representative picture from three independent experiments, with molecular weights indicated to the left (kDa). D, Western blot analysis of distribution of key SG nodes proteins in WT and CLN3KO HeLa cells. For each genotype samples were loaded as input, b-isox pellet, and b-isox supernatant from left to right. Representative picture from three independent experiments, with molecular weights indicated to the left (kDa). E, Graphs show relative precipitation of SG nodes in b-isox pellet compared with input. The figure shows the mean ± SD, of three separate experiments, analyzed by two-way analysis of variance with Dunnett’s multiple comparisons test: n.s, not significant.

References

    1. Mole S.E., Cotman S.L. Genetics of the neuronal ceroid lipofuscinoses (Batten disease) Biochim. Biophys. Acta. 2015;1852:2237–2241. - PMC - PubMed
    1. Williams R.E., Mole S.E. New nomenclature and classification scheme for the neuronal ceroid lipofuscinoses. Neurology. 2012;79:183–191. - PubMed
    1. Munroe P.B., Mitchison H.M., O'Rawe A.M., Anderson J.W., Boustany R.M., Lerner T.J., et al. Spectrum of mutations in the Batten disease gene, CLN3. Am. J. Hum. Genet. 1997;61:310–316. - PMC - PubMed
    1. Kitzmuller C., Haines R.L., Codlin S., Cutler D.F., Mole S.E. A function retained by the common mutant CLN3 protein is responsible for the late onset of juvenile neuronal ceroid lipofuscinosis. Hum. Mol. Genet. 2008;17:303–312. - PubMed
    1. Mirza M., Vainshtein A., DiRonza A., Chandrachud U., Haslett L.J., Palmieri M., et al. The CLN3 gene and protein: what we know. Mol. Genet. Genomic Med. 2019;7:e859. - PMC - PubMed

Publication types

MeSH terms