. 2023 Mar 25;14(1):1666.
doi: 10.1038/s41467-023-37440-w.

Integrative proteogenomic characterization of early esophageal cancer

Affiliations

Integrative proteogenomic characterization of early esophageal cancer

Lingling Li et al. Nat Commun. .

Abstract

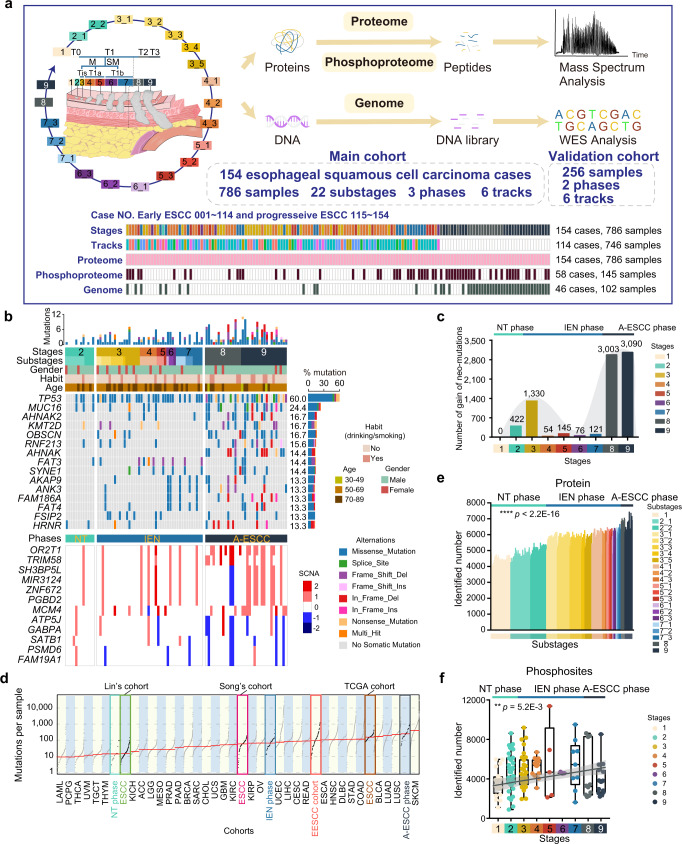
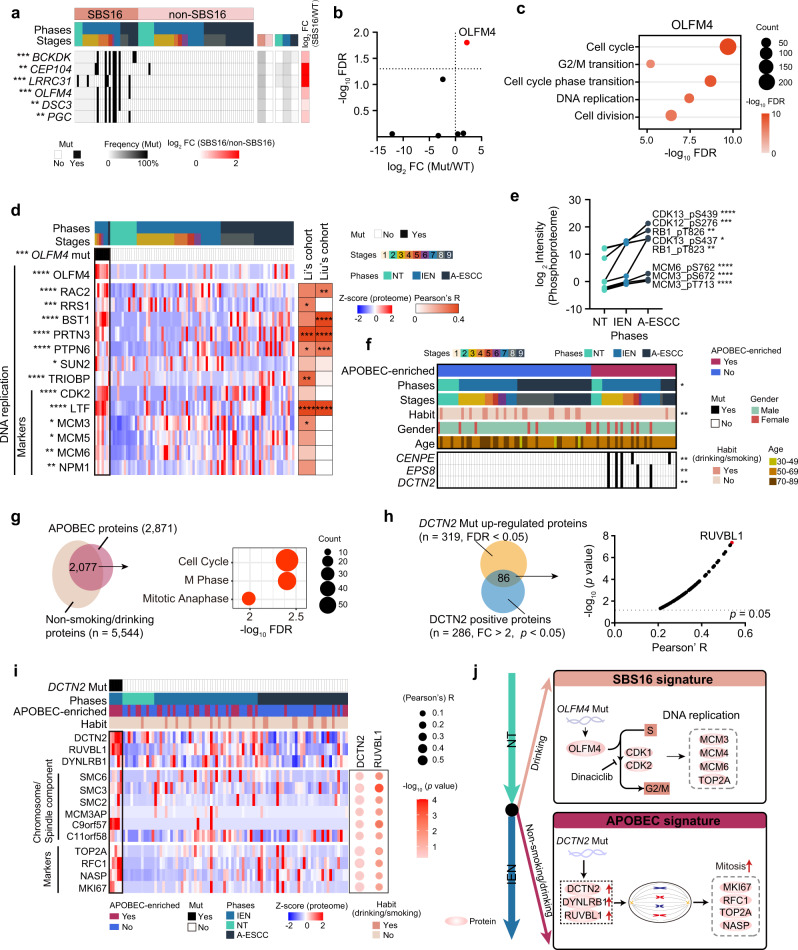
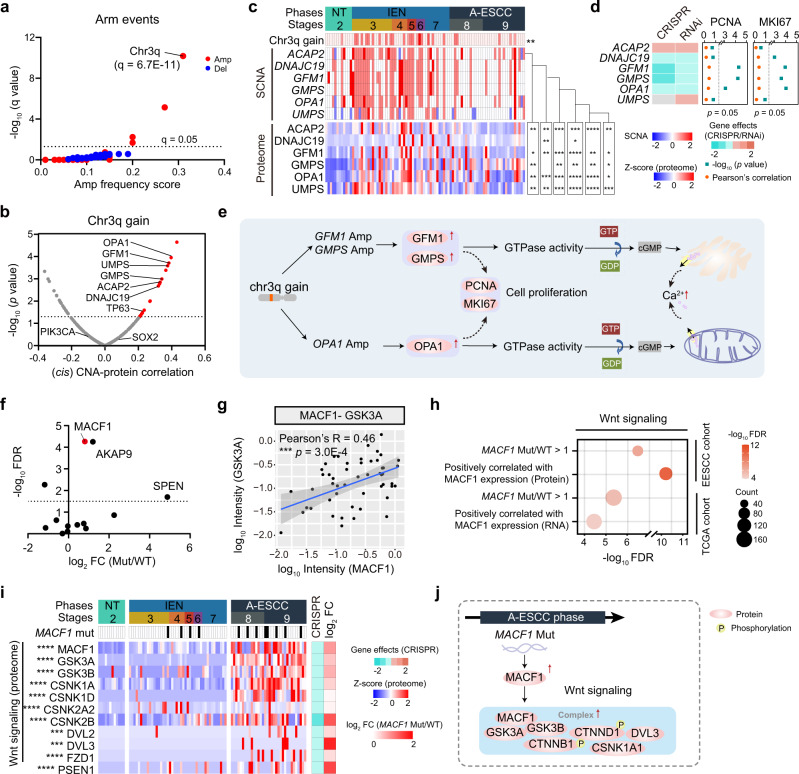
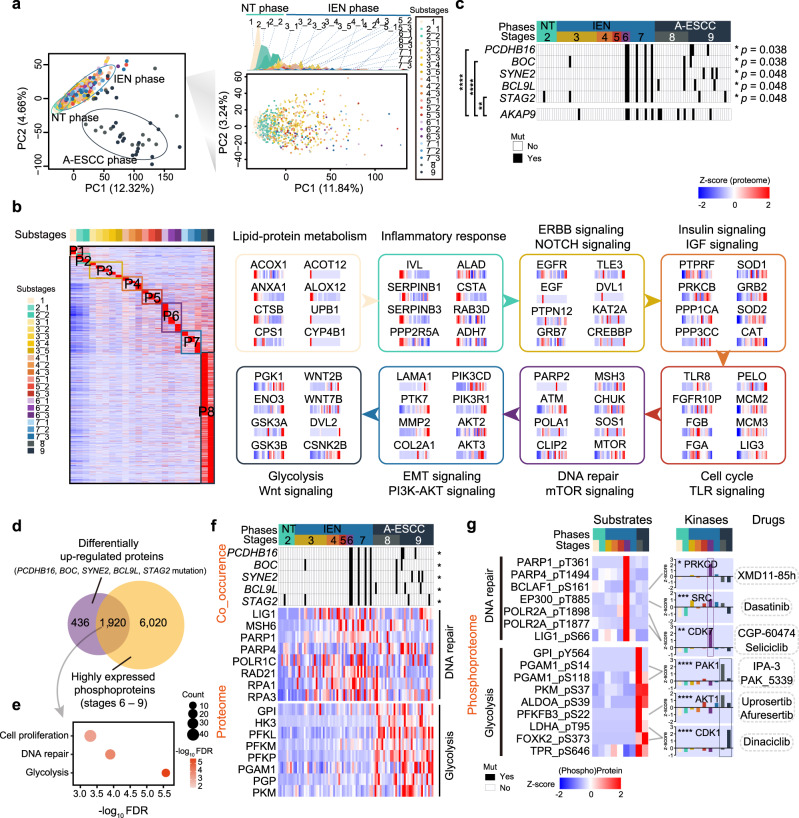
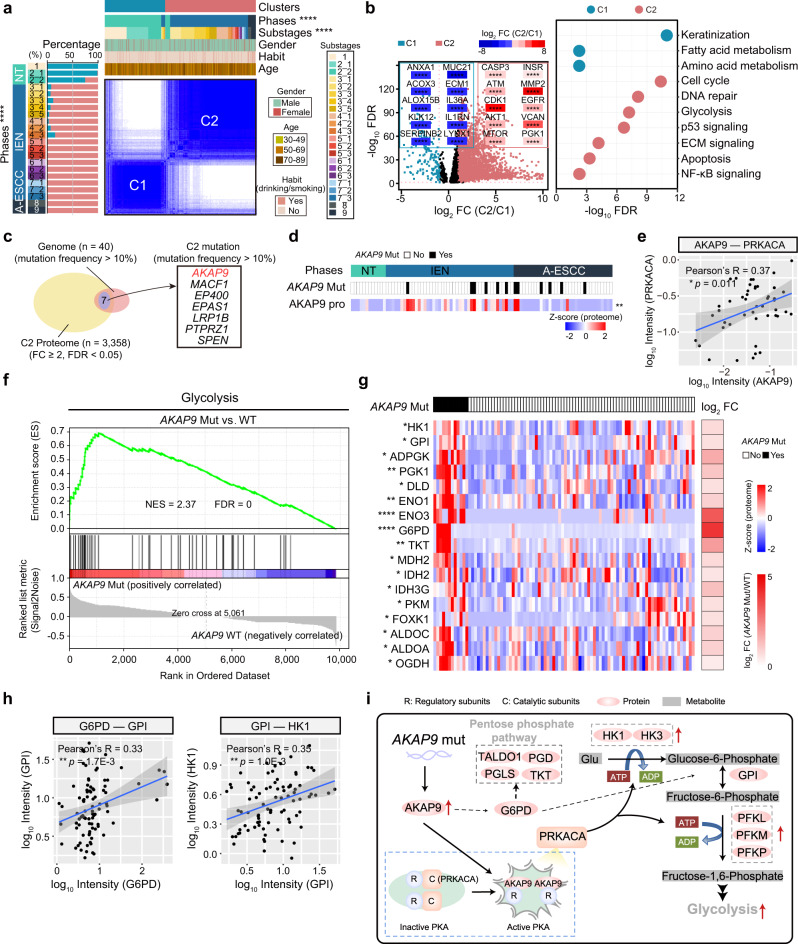
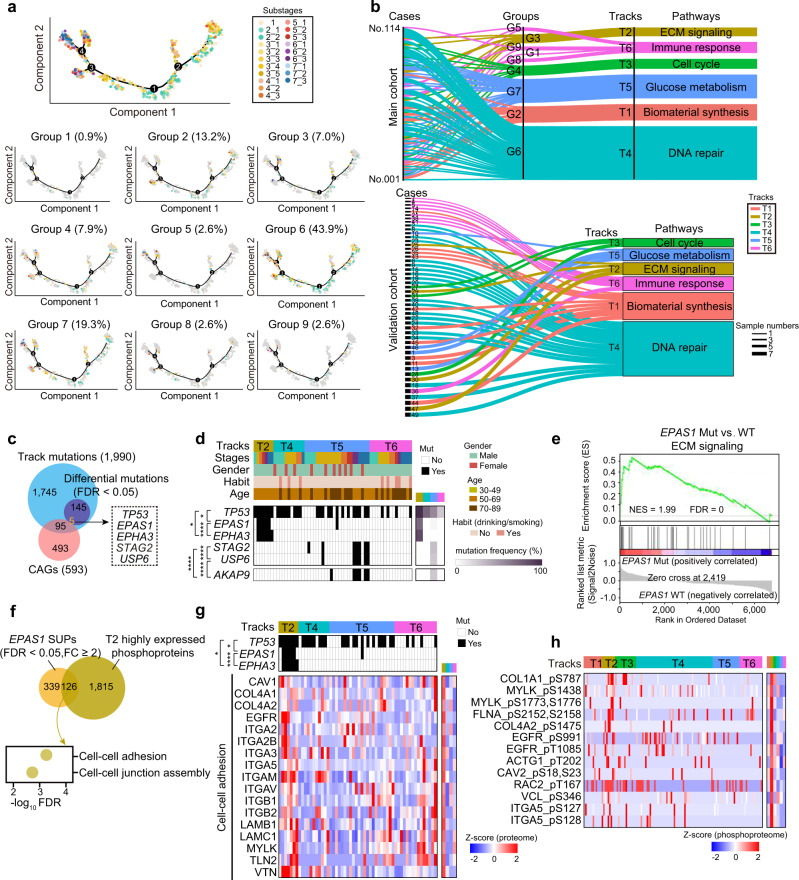
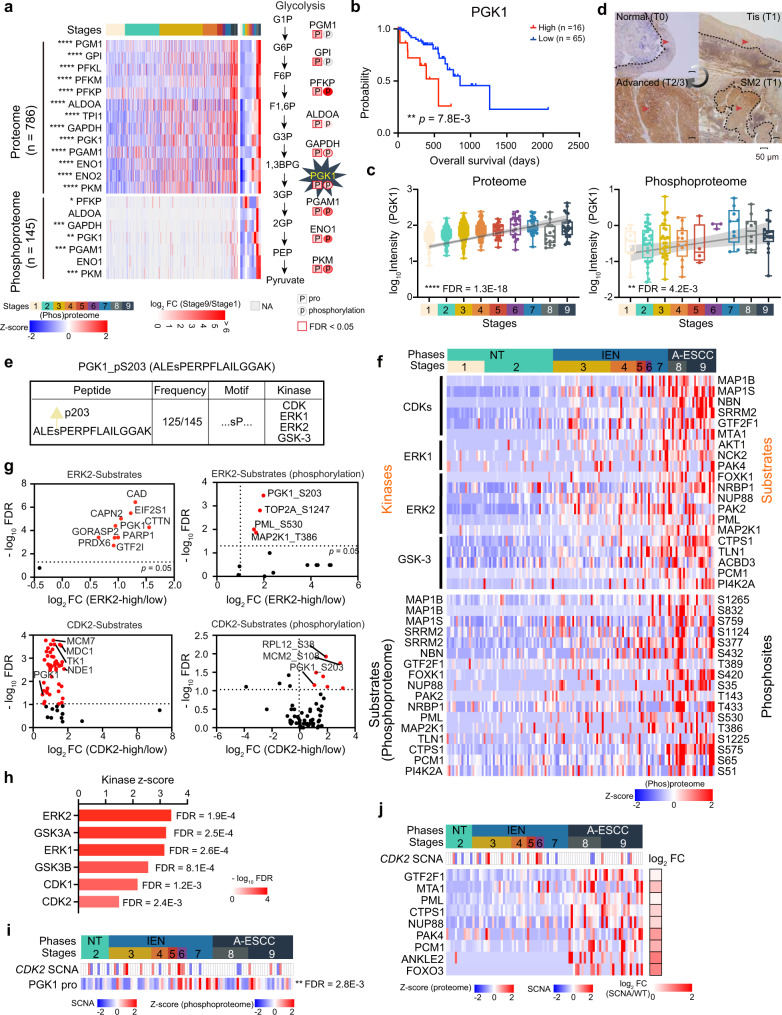
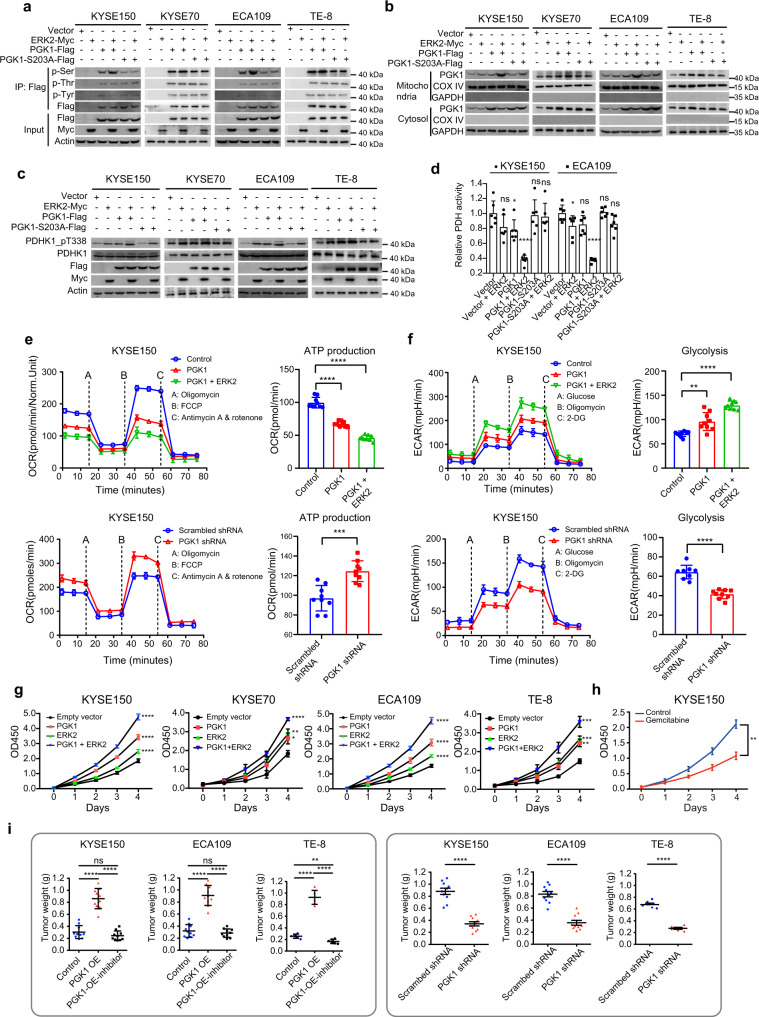
Esophageal squamous cell carcinoma (ESCC) is malignant while the carcinogenesis is still unclear. Here, we perform a comprehensive multi-omics analysis of 786 trace-tumor-samples from 154 ESCC patients, covering 9 histopathological stages and 3 phases. Proteogenomics elucidates cancer-driving waves in ESCC progression, and reveals the molecular characterization of alcohol drinking habit associated signatures. We discover chromosome 3q gain functions in the transmit from nontumor to intraepithelial neoplasia phases, and find TP53 mutation enhances DNA replication in intraepithelial neoplasia phase. The mutations of AKAP9 and MCAF1 upregulate glycolysis and Wnt signaling, respectively, in advanced-stage ESCC phase. Six major tracks related to different clinical features during ESCC progression are identified, which is validated by an independent cohort with another 256 samples. Hyperphosphorylated phosphoglycerate kinase 1 (PGK1, S203) is considered as a drug target in ESCC progression. This study provides insight into the understanding of ESCC molecular mechanism and the development of therapeutic targets.


Conflict of interest statement

The authors declare no competing interests.

Figures

Fig. 1
Fig. 1. The multi-omics landscape in ESCC progression.
a Overview of the experimental design and the number of samples for the genomic, proteomic, and phosphoproteomic analyses. ESCC esophageal squamous cell carcinoma. b The genomic profile of ESCC progression. Top: the mutation number and types of all the samples from early to progressive ESCC. Bottom: the somatic copy number alterations of all the samples from early to progressive ESCC. The mutation frequencies are shown by a bar plot at the right panel. NT phase: non-tumor phase, IEN phase: intraepithelial neoplasia phase, A-ESCC phase: advanced-stage ESCC phase. c The gain of neo-mutations at all stages in ESCC progression. d Analysis of the mutations loads of diverse cohorts. EESCC cohort: early ESCC cohort. e The number of the identified proteins of 786 samples (Kruskal–Wallis test, p < 2.2E–16). f Boxplot showing the number of the phosphosites identifications of 145 samples (Kruskal–Wallis test). Boxplot shows median (central line), upper and lower quartiles (box limits), 1.5× interquartile range (whiskers). ****p < 1.0E–4, ***p < 1.0E–3, **p < 0.01, *p < 0.05, ns. > 0.05. Source data are provided as a Source data file.
Fig. 2
Fig. 2. The risk factor-associated mutational signatures in ESCC progression.
a Heatmap showing the significantly positive associated mutations in SBS16 signature (two-sided Fisher’s exact test). ***p = 1.4E–4 (BCKDK), **p = 2.7E–3 (CEP104), ***p = 1.4E–4 (LRRC31), ***p = 4.5E–4 (OLFM4), ***p = 1.5E–3 (DSC3), ***p = 1.5E–3 (PGC). The square directs to a subset of patient samples used for WES. b Volcano analysis of the impacts of significantly positive associated mutations in SBS16 signature on their counterpart proteins expression (two-sided Wilcoxon signed-rank test). c Represented pathway enrichment that was positively correlated with OLFM4. d Heatmap showing the protein levels of DNA replication in OLFM4 mutation group vs. WT group (two-sided Wilcoxon signed-rank test, BH-adjusted *p < 0.05). e The expression (log2-transformed Intensity, median) of represented DNA replication-related phosphoprotein in ESCC progression (Kruskal–Wallis test, BH-adjusted *p < 0.05). A total of 145 samples for phosphoproteomic profiling are used in this analysis. n (NT) = 57, n (IEN) = 62, n (A-ESCC) = 26 biologically independent samples examined. f The correlation between etiological factors (top) and the significantly associated mutations of APOBEC signature (bottom) (two-sided Fisher’s exact test). *p = 0.012 (Phase), **p = 4.2E–3 (Habit), **p = 4.6E–3 (DCTN2), **p = 4.6E–3 (EPS8), **p = 4.6E–3 (CENPE). g Venn diagram depicting the number of the overlapped proteins overrepresented in the APOBEC signature and non-smoking/drinking ESCC patients (left, two-sided Wilcoxon signed-rank test, BH-adjusted *p < 0.05), and the associated signaling pathways (right). h Venn plot (left) showing the overlapped proteins significantly correlated with DCTN2 at the gene and protein levels (two-sided Wilcoxon signed-rank test, BH-adjusted *p < 0.05). Volcano plot (right) depicting the correlation between DCTN2 and the overlapped proteins (n = 86, two-sided Pearson’s correlation test). i Heatmap (left) presenting the represented chromosomal/spindle components and cell proliferation markers overrepresented in the DCTN2 mutation group (two-sided Wilcoxon signed-rank test), and correlation (right) between DCTN2/RUVBL1 and represented chromosomal/spindle components and cell proliferation markers (two-sided Pearson’s correlation test). j A brief summary of the impacts of the SBS16 signature (top) and APOBEC signature (bottom) in ESCC progression. A total of 102 samples for WES are used in the analysis. ****p < 1.0E–4, ***p < 1.0E–3, **p < 0.01, *p < 0.05, ns. > 0.05. Source data are provided as a Source data file.
Fig. 3
Fig. 3. Integrative omics analyses of early ESCC samples.
a The significant arm events of 102 samples in ESCC progression. The gain and loss events are highlighted in red and blue, respectively. b Volcano plot showing the cis- correlation of the SCNA (x-axis) and the associated –log10 (p value) (y-axis) on the genes at chr3q gain (two-sided Spearman’s correlation test). c The cis SCNA-protein regulations of significantly correlated genes (top) on their corresponding proteins expression (bottom) (two-sided Spearman’s correlation test, p < 0.05). d Dependency map-supported (https://depmap.org) panels showing relative survival averaged across all available ESCC cell lines after depletion of the indicated genes by RNAi or CRISPR. The right shows Pearson’s correlation and p value of these genes with PCNA and MKI67 at the protein level (two-sided Pearson’s correlation test). e A brief summary of the impacts of chr3q gain. f Volcano plot showing the impacts of the top ten mutations of ESCC progression on proteins expression (log2-transformed Intensity) (x-axis) and the associated –log10 (FDR) (y-axis) (two-sided Student’s t-test). g Scatterplot showing the relationship between log10 GSK3A and log10 MACF1 expression at the protein level in the Fudan cohort (two-sided Pearson’s correlation test, mean ± SD). h Represented pathway enrichment of proteins that was positively correlated with MACF1 in the Fudan cohort (top) and the TCGA ESCC cohort (bottom). Biological pathways are analyzed from the GO/KEGG database. i Heatmap showing the impacts of the mutation of MACF1 on the expression of Wnt signaling-related proteins in ESCC progression (Kruskal–Wallis test, BH-adjusted *p < 0.05). The square directs to a subset of patient samples used for WES (n = 102). j A brief summary of the impacts of the mutation of MACF1. ****p < 1.0E–4, ***p < 1.0E–3, **p < 0.01, *p < 0.05, ns. > 0.05. Source data are provided as a Source data file.
Fig. 4
Fig. 4. The temporal driver pathway waves in ESCC progression.
a Principal component analysis (PCA) of the Fudan cohort. Left: PCA of all 786 ESCC samples (including NT phase, IEN phase, and A-ESCC phase); Right: PCA of 746 early ESCC samples (NT phase and IEN phase). b Heatmap analysis of the dynamic switches during the carcinogenesis of ESCC (Kruskal–Wallis test). Left: heatmap analysis of DEPs of the 22 substages in ESCC progression. Right: the driver pathway waves of 8 panels in ESCC progression. c The mutations are significantly associated with stages in ESCC progression (two-sided Fisher’s exact test). The highlighted mutations (right) are exclusively co-mutations (two-sided Fisher’s exact test). The square directs to a subset of patient samples used for WES (n = 102). p values of the co-mutations with AKAP9: ****p = 3.7E–5 (PCDHB16), ****p = 3.7E–5 (BOC), **p = 1.7E–3 (STAG2). d The number of the proteins regulated by the co-mutations and e the associated biological pathways. f Heatmap showing the impacts of the co-mutations of PCDHB16, BOC, SYNE2, BCL9L, and STAG2 (top, two-sided Fisher’s exact test), on the protein level (bottom) in ESCC progression (Kruskal–Wallis test). *p = 0.038 (PCDHB16), *p = 0.038 (BOC), *p = 0.048 (SYNE2), *p = 0.048 (BCL9L), *p = 0.048 (STAG2). The square directs to a subset of patient samples used for WES (n = 102). g The kinase-substrate interactions in ESCC progression (Kruskal–Wallis test). A total of 145 samples for phosphoproteomic profiling are used in this analysis. *p = 0.015 (PRKCD), ***p = 2.4E–4 (SRC), **p = 9.6E–3 (CDK7), ****p = 8.0E–6 (PAK1), ****p = 5.3E–9 (AKT1), ****p = 2.8E–10 (CDK1). ****p < 1.0E–4, ***p < 1.0E–3, **p < 0.01, *p < 0.05, ns. > 0.05. Source data are provided as a Source data file.
Fig. 5
Fig. 5. Proteomic clusters and the impacts of AKAP9 mutation in ESCC progression.
a Consensus clustering analysis of 786 samples (two-sided Fisher’s exact test). Left: the percentages of the two clusters in 22 substages; Right: 786 samples were classified into two clusters based on proteomic patterns. *p = 0.029 (Age), ****p < 2.2E–16 (Phases), ****p < 2.2E–16 (Substages). b Volcano analysis of DEPs (left) in the two clusters and their associated biological pathways (right) in the two clusters (two-sided Student’s t-test). Biological pathways were analyzed from the Reactome database. C1: the Cluster 1. C2: Cluster 2. c Venn diagram depicting the number of the genes both detected in the genome and proteome in C2. The right shows the significant C2 mutations with mutation frequency over 10%. d Heatmap showing the impacts of AKAP9 mutation on the protein level of AKAP9 (two-sided Student’s t-test, BH-adjusted **p = 8.4E–3). e Scatterplot showing the relationship between log10 PRKACA and log10 AKAP9 expression at the protein level (two-sided Pearson’s correlation test, mean ± SD). f GSEA plot (KEGG gene sets) for glycolysis in AKAP9 mutation and WT comparison. g Heatmap depicting the impacts of AKAP9 mutation on glycolysis in ESCC progression (two-sided Student’s t-test, BH-adjusted *p < 0.05). The square directs to a subset of patient samples used for WES (n = 102). h Scatterplots showing the relationship between log10 G6PD (left)/HK1 (right) and log10 GPI expression at the protein level (two-sided Pearson’s correlation test, mean ± SD). i A brief summary of the impacts of AKAP9 mutation. ****p < 1.0E–4, ***p < 1.0E–3, **p < 0.01, *p < 0.05, ns. > 0.05. Source data are provided as a Source data file.
Fig. 6
Fig. 6. Personalized trajectory reveals six major carcinogenesis tracks of the early ESCCs.
a The trajectory of 746 samples (top) and 114 early ESCC cases were grouped into 9 (bottom). b Sankey diagram analysis of 114 early ESCC cases (top, main cohort) and 49 early ESCC cases (bottom, validation cohort). c Venn diagram showing the track mutations (top) and the CAGs (bottom) (two-sided Fisher’s exact test). CAGs: cancer-associated genes. The overlapped mutations are shown in the box. d The CAG-associated track mutations in the early ESCCs. The co-mutations are highlighted on the left (two-sided Fisher’s exact test), and the mutation frequency is shown on the right. The square directed to a subset of patient samples used for WES (n = 68) in early ESCCs. Co-mutations: *p = 0.032 (TP53 and EPAS1), *p = 0.032 (TP53 and EPHA3), ****p = 9.3E–6 (EPAS1 and EPHA3), *p = 2.2E–7 (STAG2 and USP6), ****p = 9.3E–6 (USP6 and AKAP9), ****p = 3.2E–5 (STAG2 and AKAP9). e GSEA plot (KEGG gene sets) for ECM signaling in EPAS1 mutation and WT comparison. f Venn diagram depicting the number of the overlapped proteins enhanced by the mutation of EPAS1 and T2 enhanced phosphoprotein (top), and the associated biological pathways (bottom). SUPs: the significantly upregulated proteins. g Heatmap showing the represented protein in the cell–cell adhesion positive associated with EPAS1 mutation (two-sided Fisher’s exact test). The square directs to a subset of patient samples used for WES (n = 68) in early ESCCs. Co-mutations: *p = 0.032 (TP53 and EPAS1), *p = 0.032 (TP53 and EPHA3), ****p = 9.3E–6 (EPAS1 and EPHA3). h Heatmap showing the phosphorylation of the phosphoproteins in cell–cell adhesion (Kruskal–Wallis test). The square directs to a subset of patient samples used for phosphoproteome (n = 119) in early ESCCs. ****p < 1.0E–4, ***p < 1.0E–3, **p < 0.01, *p < 0.05, ns. > 0.05. Source data are provided as a Source data file.
Fig. 7
Fig. 7. Aberrant glycolytic metabolism in ESCC and alterations in the activities of its key enzyme, PGK1.
a Aberrant glycolysis in ESCC progression at the multi-omics level (Kruskal–Wallis test, BH-adjusted *p < 0.05). A total of 786 samples for proteomic profiling and 145 samples for phosphoproteomic profiling are used. b Highly expressed PGK1 is negatively correlated to prognosis (two-sided log-rank test). c Boxplots showing the increased expression (log10-transformed Intensity) of PGK1 in ESCC at the protein (left) and phosphoprotein (right) levels (Kruskal–Wallis test). Boxplots show median (central line), upper and lower quartiles (box limits), 1.5× interquartile range (whiskers). A total of 786 samples and 145 samples were used for proteome and phosphoproteome, respectively. Proteome: n (stage 1) = 114, n (stage 2) = 206, n (stage 3) = 259, n (stage 4) = 86, n (stage 5) = 32, n (stage 6) = 17, n (stage 7) = 32, n (stage 8) = 16, n (stage 9) = 24 biologically independent samples examined. Phosphoproteome: n (stage 1) = 20, n (stage 2) = 37, n (stage 3) = 31, n (stage 4) = 14, n (stage 5) = 5, n (stage 6) = 3, n (stage 7) = 9, n (stage 8) = 10, n (stage 9) = 16 biologically independent samples examined. d Immunohistochemistry analysis of PGK1 expression in normal (T0), Tis (T1), SM2 (T1), and advanced stage (T2/T3) tissues. The zone with the dotted lines and red arrow represents PGK1 positive staining. The scale bar indicates 50 µm. e Analysis of the serine motif of PGK1 (sP). The top shows the sequence and phosphorylated sites of PGK1 (S203). The bottom presents that PGK1 S203 is detected at almost samples in ESCC (125/145) and the kinases associated with the motif of PGK1 S203 (“sP”). f The expression of the kinases and the substrates in ESCC progression at the phosphoprotein level. The square directs to a subset of patient samples used for phosphoproteome. g Volcano plot displaying the ERK2-substrates (top) and CDK2-substrates (bottom) regulation results (two-sided Wilcoxon rank-sum test). The red marks the overrepresented substrates (left) and phosphorylations (right) in the kinases highly expressed group. h Histogram showing the Z-score and FDR of the KSEA results. A total of 145 samples for phosphoproteomic profiling are used in the analysis. i The SCNAs of CDK2 have positive effects on PGK1 expression (two-sided Wilcoxon signed-rank test). j The impacts of the SCNAs of CDK2 (middle) on the substrates expression of the kinases (bottom), associated with the PGK1 motif (sP). The square directs to a subset of patient samples used for WES (n = 102). ****p < 1.0E–4, ***p < 1.0E–3, **p < 0.01, *p < 0.05, ns. > 0.05. Source data are provided as a Source data file.
Fig. 8
Fig. 8. PGK1 reprograms glucose metabolism and contributes to ESCC progression.
a Pan Serine/Threonine/Tyrosine-phosphorylation levels of PGK1 in KYSE150 cells, KYSE70 cells, ECA109 cells, and TE-8 cells. b PGK1 level in mitochondria and cytosol fraction of in KYSE150 cells, KYSE70 cells, ECA109 cells, and TE-8 cells. c The impacts of PGK1 and/or ERK2 on PDHK1 T338 phosphorylation levels in KYSE150 cells, KYSE70 cells, ECA109 cells, and TE-8 cells. d The impacts of PGK1 and/or ERK2 on PDH activity in KYSE150 cells (n = 36) and ECA109 cells (n = 36) (two-sided Student’s t-test, mean ± SD). KYSE150: p = 0.088, *p = 0.031, ****p = 7.7E–6, p = 0.81, p = 0.66 from left to right. ECA109: *p = 0.043, p = 0.052, ****p = 1.3E–7, p = 0.78, p = 0.058 from left to right. e The impacts of overexpressed and knockdown PGK1 and ERK2 on OCR and ATP production (two-sided Student’s t-test, mean ± SD). Twenty-four cell samples were used in the analysis. Top: ****p = 1.6E–8 (PGK1), ****p = 2.6E–12 (PGK1 + ERK2). Bottom: ***p = 7.7E–4. OCR: oxygen consumption rate. f The impacts of overexpressed and knockdown PGK1 and ERK2 on ECAR (two-sided Student’s t-test, mean ± SD). Sixteen cell samples are used in the analysis. Top: **p = 1.2E–3 (PGK1), ****p = 1.0E–11 (PGK1 + ERK2). Bottom: ***p = 3.9E–7. ECAR: extracellular acidification rate. g The impacts of PGK1-overexpression (OE) and/or ERK2-OE on cell proliferation in KYSE150 cells, KYSE70 cells, ECA109 cells, and TE-8 cell (two-sided Student’s t-test, mean ± SD). A total of 320 cell samples were used in the analysis. KYSE150: ****p = 1.5E–7 (PGK1), ****p = 1.6E–5 (ERK2), ****p = 2.9E–9 (PGK1 + ERK2). KYSE70: *p = 0.014 (PGK1), **p = 4.5E–3 (ERK2), ****p = 6.8E–5 (PGK1 + ERK2). ECA109: ****p = 5.4E–7 (PGK1), ****p = 3.2E–6 (ERK2), ****p = 2.7E–9 (PGK1 + ERK2). TE-8: **p = 2.1E–3 (PGK1), ***p = 5.0E–4 (ERK2), ***p = 3.2E–4 (PGK1 + ERK2). h Gemcitabine inhibits cell proliferation (n = 30, two-sided Student’s t-test, **p = 4.8E–3, mean ± SD). i The impacts of PGK1-OE (left) and PGK1 knockdown (right) on the weight of the xenografts in the KYSE150 cells, ECA109 cells, and TE-8 cells (two-sided Student’s t-test, mean ± SD). A total of 130 samples are used in the analysis. Left: KYSE150: ****p = 5.9E–8 (Control and PGK1-OE), ****p = 4.4E–9 (PGK1-OE and PGK1-OE-inhibitor), p = 0.17 (Control and PGK1-OE-inhibitor). ECA109: ****p = 2.1E–8 (Control and PGK1-OE), ****p = 4.4E–9 (PGK1-OE and PGK1-OE-inhibitor), p = 0.17 (Control and PGK1-OE-inhibitor). TE-8: ****p = 1.3E–7 (Control and PGK1-OE), ****p = 4.0E–8 (PGK1-OE and PGK1-OE-inhibitor), p = 1.7E–3 (Control and PGK1-OE-inhibitor). Right: ****p = 8.6E–8 (KYSE150), ****p = 3.4E–7 (ECA109), ****p = 7.6E–8 (TE-8). ****p < 1.0E–4, ***p < 1.0E–3, **p < 0.01, *p < 0.05, ns. > 0.05. Source data are provided as a Source data file.

References

    1. Bray F, et al. Global cancer statistics 2018: GLOBOCAN estimates of incidence and mortality worldwide for 36 cancers in 185 countries. CA Cancer J. Clin. 2018;68:394–424. doi: 10.3322/caac.21492. - DOI - PubMed
    1. Brown LM, Devesa SS, Chow WH. Incidence of adenocarcinoma of the esophagus among white Americans by sex, stage, and age. J. Natl Cancer Inst. 2008;100:1184–1187. doi: 10.1093/jnci/djn211. - DOI - PMC - PubMed
    1. Sawada G, et al. Genomic landscape of esophageal squamous cell carcinoma in a Japanese population. Gastroenterology. 2016;150:1171–1182. doi: 10.1053/j.gastro.2016.01.035. - DOI - PubMed
    1. Daly JM, et al. Esophageal cancer: results of an American College of Surgeons Patient Care Evaluation Study. J. Am. Coll. Surg. 2000;190:562–572. doi: 10.1016/S1072-7515(00)00238-6. - DOI - PubMed
    1. Ishiguro S, et al. Effect of alcohol consumption, cigarette smoking and flushing response on esophageal cancer risk: a population-based cohort study (JPHC study) Cancer Lett. 2009;275:240–246. doi: 10.1016/j.canlet.2008.10.020. - DOI - PubMed

Publication types

MeSH terms

LinkOut - more resources