. 2023 Mar 25;14(1):1677.
doi: 10.1038/s41467-023-37092-w.

Genomic characterization of DICER1-associated neoplasms uncovers molecular classes

Affiliations

Genomic characterization of DICER1-associated neoplasms uncovers molecular classes

Felix K F Kommoss et al. Nat Commun. .

Abstract

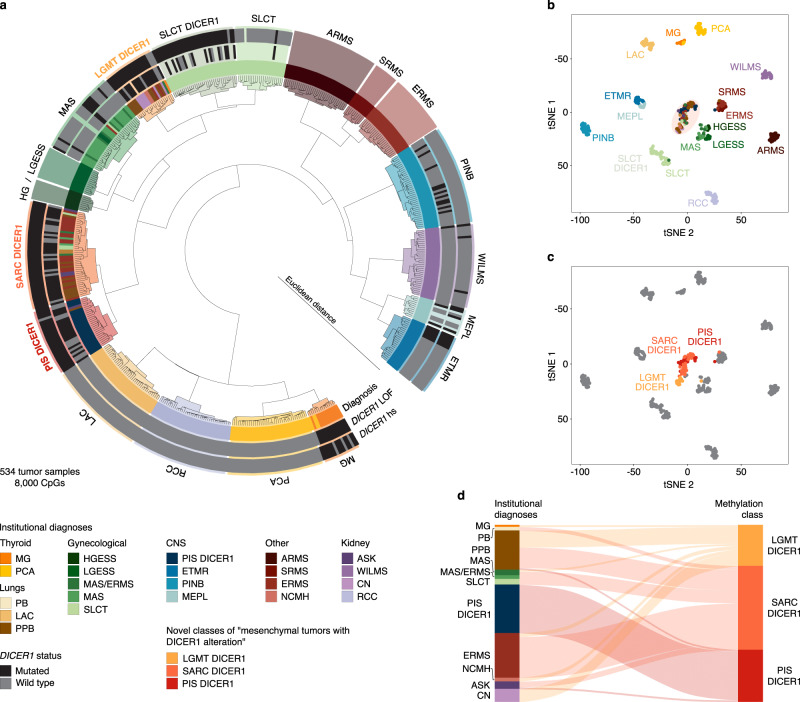
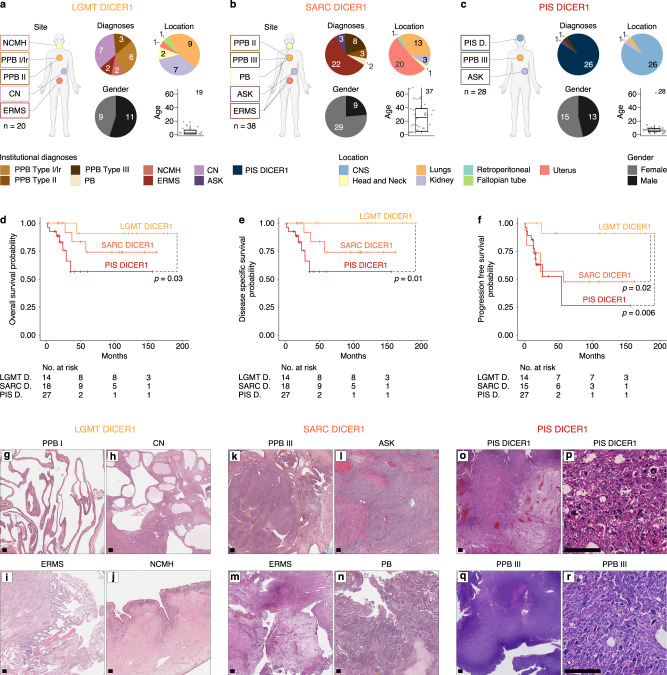
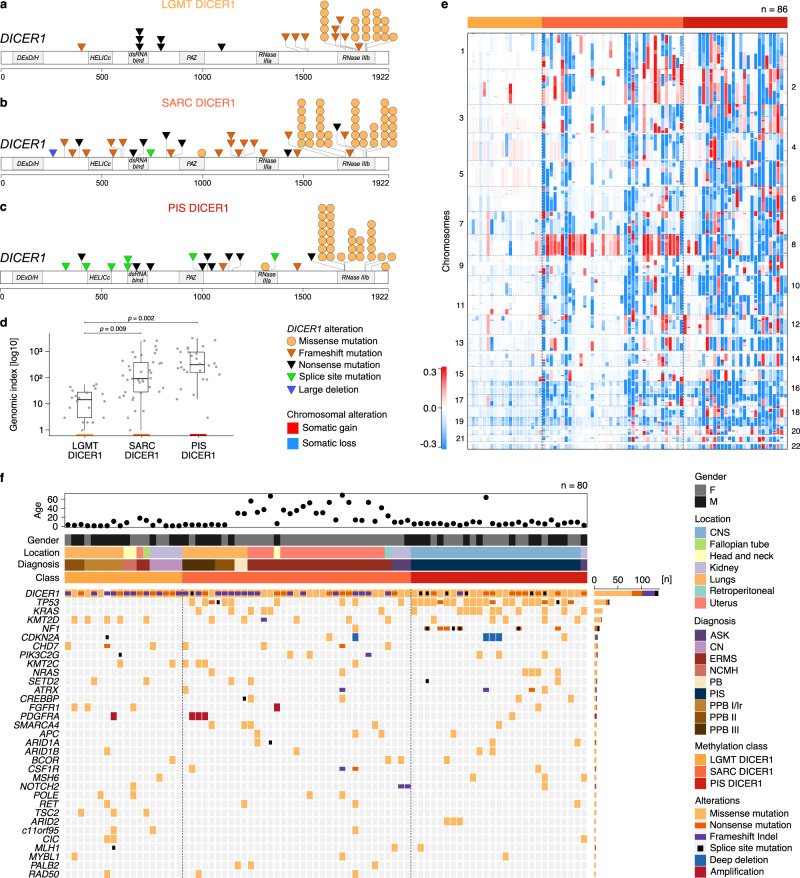
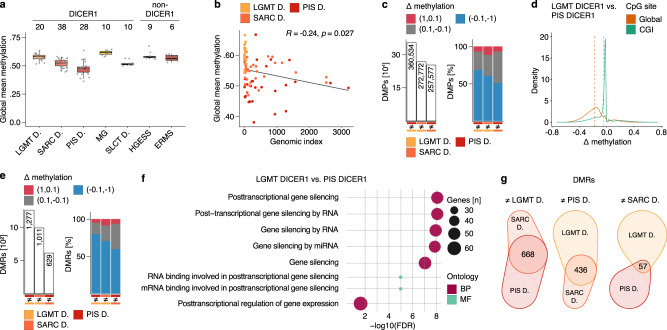
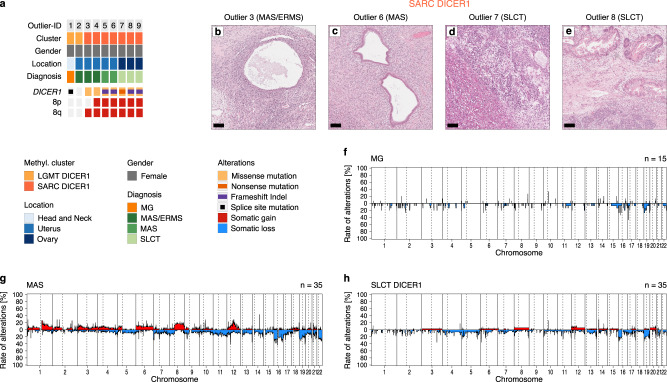
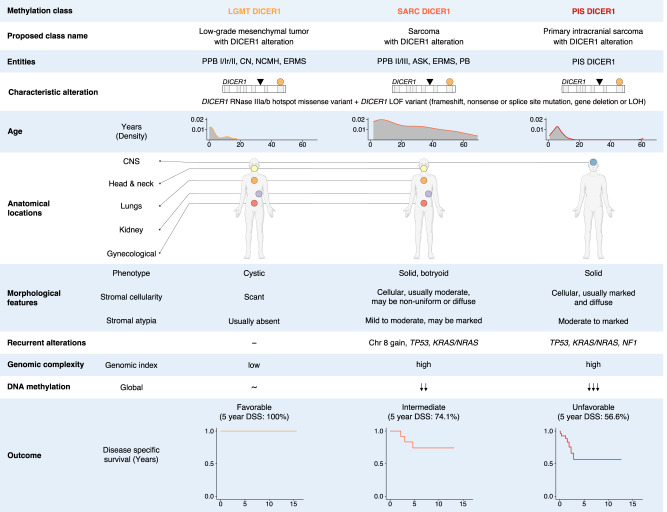
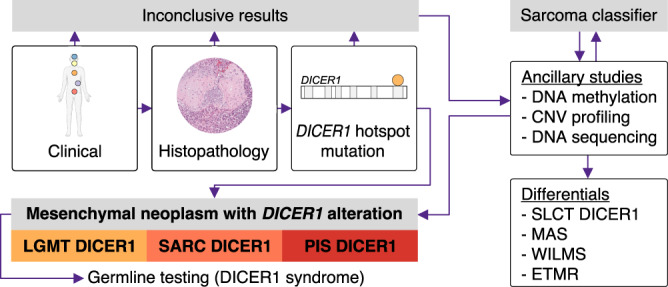
DICER1 syndrome is a tumor predisposition syndrome that is associated with up to 30 different neoplastic lesions, usually affecting children and adolescents. Here we identify a group of mesenchymal tumors which is highly associated with DICER1 syndrome, and molecularly distinct from other DICER1-associated tumors. This group of DICER1-associated mesenchymal tumors encompasses multiple well-established clinicopathological tumor entities and can be further divided into three clinically meaningful classes designated "low-grade mesenchymal tumor with DICER1 alteration" (LGMT DICER1), "sarcoma with DICER1 alteration" (SARC DICER1), and primary intracranial sarcoma with DICER1 alteration (PIS DICER1). Our study not only provides a combined approach to classify DICER1-associated neoplasms for improved clinical management but also suggests a role for global hypomethylation and other recurrent molecular events in sarcomatous differentiation in mesenchymal tumors with DICER1 alteration. Our results will facilitate future investigations into prognostication and therapeutic approaches for affected patients.


Conflict of interest statement

The authors declare no competing interests.

Figures

Fig. 1
Fig. 1. Molecular classification of DICER1-associated neoplasms by DNA methylation analysis.
a Unsupervised hierarchical clustering (Euclidean ward) of the 8000 most differentially methylated CpGs of 534 neoplasms (related to Supplementary Fig. 1a). Samples are colored according to their institutional diagnoses. Known DICER1 variants are denoted in black, DICER1 wild-type alleles are indicated in dark-gray, blank annotation indicates unknown DICER1 status. Clusters are colored according to their molecular class by DNA methylation. b, c 2D representation of pairwise sample correlation using the 8000 most variable methylated probes by t-SNE dimensionality reduction (related to Supplementary Fig. 1b, c). b Samples are colored according to their institutional diagnoses. c Samples are colored according to their cluster assignment of LGMT DICER1, SARC DICER1 and PIS DICER1 by unsupervised hierarchical clustering (a). Tumors falling into other clusters are depicted in gray. d Reclassification of neoplasms into three molecular classes of mesenchymal neoplasms with DICER1 alteration (LGMT DICER1, SARC DICER1 and PIS DICER1) corresponding to their institutional diagnoses. Institutional diagnoses and methylation clusters are depicted by colors as indicated.
Fig. 2
Fig. 2. Clinicopathological features of mesenchymal neoplasms with DICER1 alteration.
Institutional diagnoses, tumor location, gender distribution and patient age of a LGMT DICER1, b SARC DICER1 and c PIS DICER1 (related to Supplementary Fig. 3). Black lines mark the median, edges of boxes denote interquartile range (IQR), and vertical lines indicate 1.5 × IQR. The number of independent samples is indicated. Kaplan–Meier survival curves (Kaplan–Meier estimates) indicating (d) overall survival, (e) disease specific survival and (e) progression free survival for LGMT DICER1, SARC DICER1 and PIS DICER1. Significant differences are indicated by dashed lines. gr, Representative histological characteristics of LGMT DICER1 (gj) showing predominantly cystic or glandular configuration with no or only sparse adjacent primitive, hypo-cellular mesenchyme, SARC DICER1 (kn) predominantly consisting of atypical mesenchyme with variable cellularity and a mostly diffuse and patternless growth, as well as PIS DICER1 (or) displaying a purely mesenchymal phenotype with a markedly increased cellularity and signs of anaplasia and coagulative necrosis in a subset of tumors (related to Supplementary Fig. 4 and Supplementary Table 3). Hematoxylin & Eosin, scale bar equals 250 μm.
Fig. 3
Fig. 3. Molecular characteristics of mesenchymal neoplasms with DICER1 alteration.
DICER1 variants identified in a LGMT DICER1, b SARC DICER1 and c PIS DICER1. d Genomic index (total number of segmental gains or losses2/number of involved chromosomes) of LGMT DICER1, SARC DICER1 and PIS DICER1, indicative of genomic complexity (n = 86). Black lines mark the median, edges of boxes denote interquartile range (IQR), and vertical lines indicate 1.5 × IQR. Statistical significance was determined by the Games-Howell post-hoc test. e Case-by-case copy number profiles of LGMT DICER1, SARC DICER1 and PIS DICER1 with chromosomal gains depicted in red and losses shown in blue. f Variants called by panel-based DNA sequencing of 80 tumors from the three classes of mesenchymal neoplasms with DICER1 alteration. Above DNA sequencing results, patients age, gender, tumor location, institutional diagnoses and DNA methylation class assignment are annotated as indicated by the figure’s legend.
Fig. 4
Fig. 4. Sarcomas with DICER1 alteration show a genome-wide hypomethylation signature.
a Global mean DNA methylation levels per sample across CpGs outside of CGIs (CpG-dense regions in CGIs are excluded for global quantifications) for LGMT DICER1, SARC DICER1 and PIS DICER1, MG and SLCT DICER1, as well as ERMS and HGESS (Supplementary Table 4). Black lines mark the median, edges of boxes denote interquartile range (IQR), and vertical lines indicate 1.5 × IQR. Number of samples analyzed, and DICER1-association are indicated at the top. b Global mean methylation and genomic index show an inverse correlation in LGMT DICER1, SARC DICER1 and PIS DICER1. Correlation was determined using the Pearson correlation coefficient. c Absolute number, and difference (Δ) in methylation of differentially methylated probes (DMPs) identified in a group-wise comparison of clusters of mesenchymal neoplasms with DICER1 alteration (LGMT DICER1, SARC DICER1 and PIS DICER1) (Supplementary Table 5). Δ in methylation indicates the difference between individual beta values: Red indicates a positive Δ in methylation of 1 to 0.1 (hypermethylation), gray indicates a Δ in methylation between 0.1 and −0.1, and blue indicates a negative Δ in methylation of −0.1 to −1 (hypomethylation). d Difference (Δ) in methylation according to genome-wide distribution of DMPs identified in a group-wise comparisons between LGMT DICER1 and PIS DICER1 (related to Supplementary Fig. 5f, g). Dashed lines mark the mean difference in methylation according to genome-wide distribution of DMPs. e Absolute numbers, and difference (Δ) in methylation of differentially methylated regions (DMRs) identified in a group-wise comparison of LGMT DICER1, SARC DICER1 and PIS DICER1 (Supplementary Table 5). f Visualization of functional enrichment (gene ontology) analysis of genes overlapping with DMRs identified in a group wise comparison between LGMT DICER1 and PIS DICER1 (related to Fig. S5h, i). BP biological process, MF molecular function, FDR false discovery rate. g Venn diagram showing the overlap of DMRs identified in group-wise comparisons of LGMT DICER1, SARC DICER1 and PIS DICER1. Venn-diagrams are plotted to scale.
Fig. 5
Fig. 5. Characteristics of DNA methylation outlier in clusters of mesenchymal neoplasms with DICER1 alteration.
a DICER1 variants and chromosome 8 copy number status of 9 thyroid, uterine and ovarian tumors, that clustered with LGMT DICER1 or SARC DICER1 in DNA methylation analysis (Fig. 1a). Above outlier ID, DNA methylation class assignment, gender, tumor location and institutional diagnoses are annotated as indicated by the figure’s legend. be Limited histomorphological evaluation of individual outliers diagnosed as MAS, MAS/ERMS or SLCT revealed (d) rhabdomyosarcomatous differentiation in a subset (n = 2) of tumors. Hematoxylin & Eosin, scale bar equals 100 μm. Cumulative copy number profiles of molecular classes of f MG, g MAS and h SLCT DICER1 showing the frequency of any chromosomal aberration at the respective loci (related to Supplementary Fig. 2). Chromosomal gains are depicted in red, and losses shown in blue.
Fig. 6
Fig. 6. Summary of clinicopathological and molecular characteristics of classes of mesenchymal neoplasms with DICER1 alteration.
LOF Loss of function, LOH Loss of heterozygosity.
Fig. 7
Fig. 7. Proposed diagnostic algorithm for mesenchymal tumors with DICER1 alteration.
Consideration of clinical features and histopathology together with the identification of a DICER1 hotspot pathogenic variant is usually sufficient to classify DICER1-associated mesenchymal neoplasms. However, in diagnostically challenging cases ancillary molecular studies may aid tumor classification. Diagnosis of a mesenchymal tumor with DICER1 alteration should always promt germline testing for DICER1 syndrome.

References

    1. Bernstein E, Caudy AA, Hammond SM, Hannon GJ. Role for a bidentate ribonuclease in the initiation step of RNA interference. Nature. 2001;409:363–366. doi: 10.1038/35053110. - DOI - PubMed
    1. Macrae IJ, et al. Structural basis for double-stranded RNA processing by Dicer. Science. 2006;311:195–198. doi: 10.1126/science.1121638. - DOI - PubMed
    1. Heravi-Moussavi A, et al. Recurrent somatic DICER1 mutations in nonepithelial ovarian cancers. N. Engl. J. Med. 2012;366:234–242. doi: 10.1056/NEJMoa1102903. - DOI - PubMed
    1. Foulkes WD, Priest JR, Duchaine TF. DICER1: mutations, microRNAs and mechanisms. Nat. Rev. Cancer. 2014;14:662–672. doi: 10.1038/nrc3802. - DOI - PubMed
    1. Hill DA, et al. DICER1 mutations in familial pleuropulmonary blastoma. Science. 2009;325:965. doi: 10.1126/science.1174334. - DOI - PMC - PubMed

Publication types

Grants and funding