. 2023 Jun;30(6):1472-1487.
doi: 10.1038/s41418-023-01146-9. Epub 2023 Mar 25.

SIM2s directed Parkin-mediated mitophagy promotes mammary epithelial cell differentiation

Affiliations

SIM2s directed Parkin-mediated mitophagy promotes mammary epithelial cell differentiation

Lilia Sanchez et al. Cell Death Differ. 2023 Jun.

Abstract

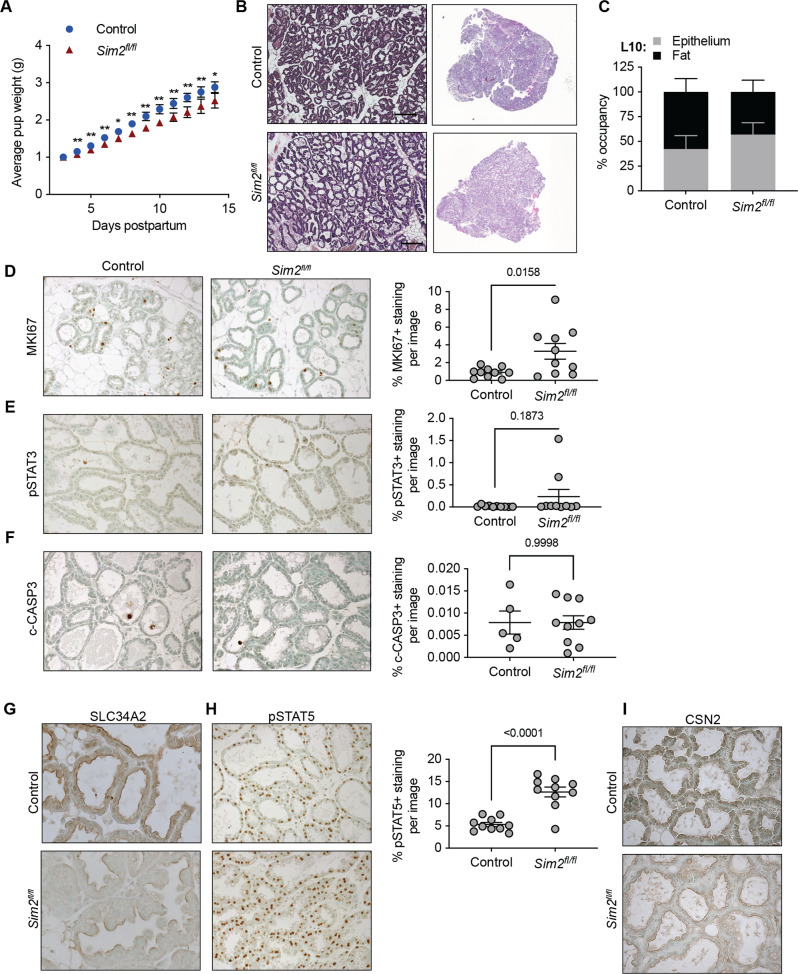
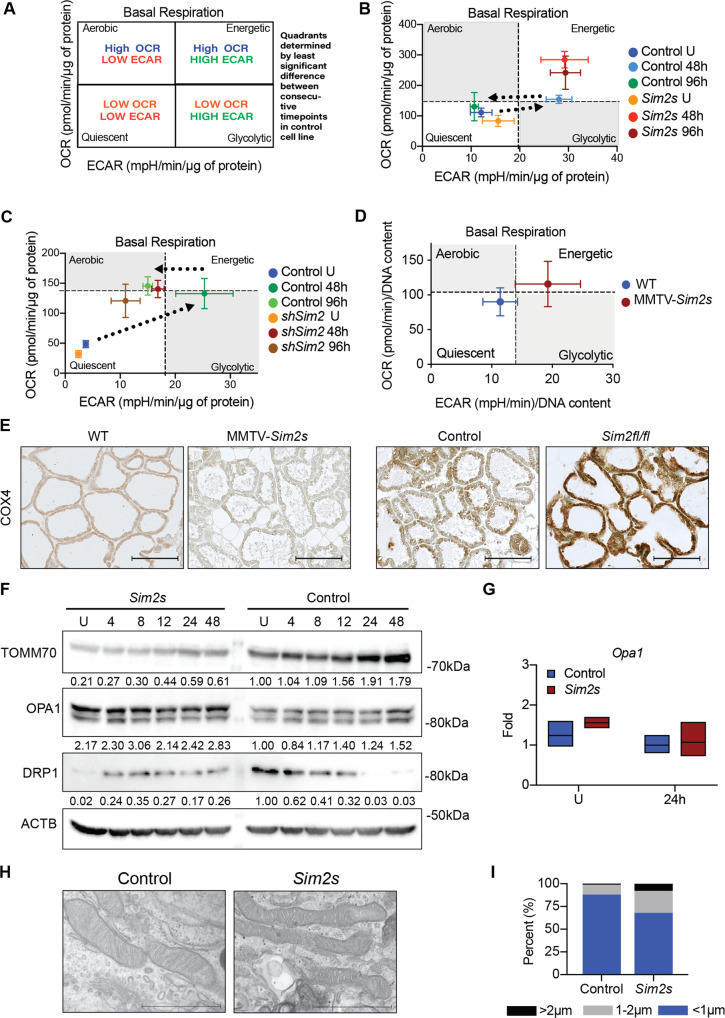
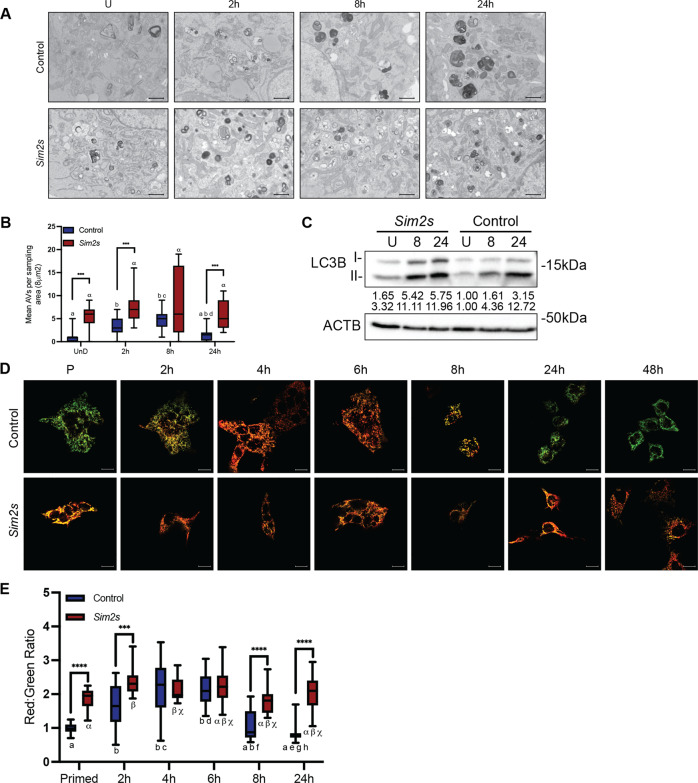
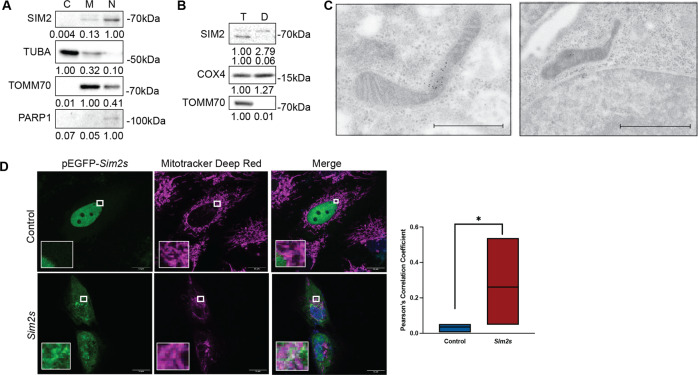
The functionally differentiated mammary gland adapts to extreme levels of stress from increased demand for energy by activating specific protective mechanisms to support neonatal health. Here, we identify the breast tumor suppressor gene, single-minded 2 s (SIM2s) as a novel regulator of mitophagy, a key component of this stress response. Using tissue-specific mouse models, we found that loss of Sim2 reduced lactation performance, whereas gain (overexpression) of Sim2s enhanced and extended lactation performance and survival of mammary epithelial cells (MECs). Using an in vitro model of MEC differentiation, we observed SIM2s is required for Parkin-mediated mitophagy, which we have previously shown as necessary for functional differentiation. Mechanistically, SIM2s localizes to mitochondria to directly mediate Parkin mitochondrial loading. Together, our data suggest that SIM2s regulates the rapid recycling of mitochondria via mitophagy, enhancing the function and survival of differentiated MECs.


Conflict of interest statement

The authors declare no competing interests.

Figures

Fig. 1
Fig. 1. Loss of Sim2 impairs lactation performance in mice.
A Average weight of cross-fostered pups nursed by control and Sim2fl/fl mice (n = 5 control, n = 4 Sim2fl/fl). B Representative H&E-stained mammary sections at lactation day 10. C Quantitation of epithelial content and fat pad occupancy in slide scans of H&E stained mammary gland sections (n = 5 control, n = 4 Sim2fl/fl). D Immunostaining for MKI67 at lactation day 2 and quantitation of positive staining (n = 2 mice per group). Immunostaining at lactation day 10 and quantitation of positive staining for pSTAT3 (E) and c-CASP3 (F) (n = 2 mice per group). G Immunostaining for SLC34A2 at lactation day 10. H Immunostaining for pSTAT5 at lactation day 10 and quantitation of positive staining (n = 2 mice per group). I Immunostaining for CSN2 at lactation day 10. Error bars indicate the mean ± SD. *p < 0.05, **p < 0.01, scale bars: 100 μm.
Fig. 2
Fig. 2. Moderate overexpression of Sim2s extends lactation performance.
A Cross-fostered pups were weighed daily to assess weight gain when nursed by WT and MMTV-Sim2s mice (n = 3 WT, n = 7 MMTV-Sim2s). B Representative H&E staining in mouse mammary gland sections at lactation day 10. C Experimental design for extended lactation studies. D Weekly weight gain of cross-fostered litters nursed by WT and MMTV-Sim2s mice during extended lactation study (n = 4 mice per group). E Crude milk fat percentage of milk collected from WT and MMTV-Sim2s mice during extended lactation study (n = 3 WT, n = 6 MMTV-Sim2s, milk could not be collected from every mouse at every timepoint). F Whole slide scans of H&E-stained mammary gland sections at day 42 of lactation. G Quantitation of epithelial and fat pad occupancy from whole slide scan H&E images (n = 4 mice per group). H Immunostaining for pSTAT3 in WT and MMTV-Sim2s mice mammary gland tissue at lactation day 42, and quantitation of pSTAT3-positive nuclei per image. Ten images per mouse were assessed (n = 2 mice per group). I Immunostaining for 8-OHdG at lactation day 28 in WT and MMTV-Sim2s mammary sections with quantification of 8-OHdG staining intensity normalized to number of nuclei. Error bars indicate the mean ± SD. *p < 0.05, **p < 0.01, scale bars: 100 μm.
Fig. 3
Fig. 3. SIM2s influences the energetic phenotype and mitochondrial homeostasis of MECs.
A Energy phenotype model. ECAR extracellular acidification rate, OCR oxygen consumption rate. B Basal energy phenotype of control and Sim2s overexpressing HC11 cells at an undifferentiated state as well as at 48 and 96 h of differentiation. (n = 3 independent experiments with ≥6 technical replicates each). C Basal energy phenotype of shControl and shSim2 HC11 cells at an undifferentiated state as well as at 48 and 96 h of differentiation (n = 2 independent experiments with ≥10 technical replicates each). Superimposed dotted arrows indicate the control cell trend across differentiation. D Basal energy phenotype of primary MECs isolated from virgin control or MMTV-Sim2s mice and subjected to hormonal induction for 24 h. (n = 3 independent experiments with ≥11 technical replicates each). E Immunostaining for mitochondrial marker COX4 in WT and MMTV-Sim2s mice as well as control and Sim2fl/fl mice at lactation day 10 (n = 2 mice per group). F Protein levels of mitochondrial homeostasis markers in control and Sim2s overexpressing HC11 cells across differentiation. G Opa1 expression in undifferentiated and 24 h differentiated control and Sim2s HC11 cells (n = 3 independent experiments with biological triplicates and technical duplicates). H TEM images of mitochondria in control and Sim2s HC11 cells at 24 h of differentiation. I Quantification of mitochondrial lengths from TEM images. Lengths were divided into three categories corresponding to punctate/round mitochondria (<1 μm), mid-length mitochondria (1–2 μm), and elongated mitochondria (>2 μm) and presented as percentages of total mitochondria. Error bars indicate the mean ± SD. Scale bars: 100 μm in E and 1 μm in H.
Fig. 4
Fig. 4. Sim2s enhances mitophagy in vitro.
A TEM images of control and Sim2s overexpressing HC11 cells across differentiation. Hours indicate differentiation time points. B Quantification of mean autophagic vesicles per sampling area (approximately 8 μm2). C Protein levels of MAP1LC3B I and II in control and Sim2s HC11 cells across differentiation. D MitoTimer images of live control and Sim2s HC11 cells across differentiation. E Quantification of the red to green fluorescent ratio from the MitoTimer images in D (n = 10 images per time point per cell line, representative of three independent experiments). Box and whisker graphs center around the mean, and whiskers extend to the minimum and maximum values. U undifferentiated, P primed 24 h.**p < 0.01, For all variables with the same letter, the difference between the means is not statistically significant; scale bars: 1  μm in A and 100 μm in D.
Fig. 5
Fig. 5. Hormone-mediated ATM activation impacts SIM2s function.
A Expression of activated (phosphorylated) ATM in HC11 cells at an undifferentiated state and 24 h after adding hydrocortisone alone, prolactin alone, or hydrocortisone + prolactin. B ATM consensus phosphorylation sites on SIM2s. C Co-immunoprecipitation of ATM and FLAG in Sim2s or Sim2s-pATMΔ HC11 cells at 24 h differentiation. D mRNA expression of differentiation-dependent Csn2 in control, Sim2s, and Sim2s-pATMΔ HC11 cell lines (n = 2 independent experiments with biological triplicates and technical duplicates). E Protein levels of MAP1LC3B I and II in control and Sim2s-pATMΔ HC11 across differentiation. F Basal energy phenotype in control, Sim2s, and Sim2s-pATMΔ HC11 cells across differentiation (n = 2 independent experiments with ≥10 technical replicates each). G Proposed model of ATM-mediated phosphorylation of SIM2s and its downstream effects. bHLH basic helix-loop-helix, ECAR extracellular acidification rate, H hydrocortisone, NLS nuclear localization sequence, OCR oxygen consumption rate, P prolactin, PAS PER-ARNT-SIM, U undifferentiated. Error bars indicate the mean ± SD. **p < 0.01.
Fig. 6
Fig. 6. SIM2s localizes to mitochondria.
A Cytoplasmic, mitochondrial, and nuclear cell fractions in 24 h differentiated HC11 cells showing protein levels of SIM2, TUBA, TOMM70, and PARP1 in each fraction. B Immunogold staining for SIM2 in 24 h differentiated HC11 cells. Black particles indicate gold labeling of SIM2 in mitochondria and nuclei. C Total and digested mitochondrial fractions in 24 h differentiated HC11 cells showing SIM2, COX4, and TOMM70 protein levels. D Representative live-cell images of control and SUM159-Sim2s cells transiently transfected with pEGFP-Sim2s and stained with Mitotracker DeepRed with quantification by Pearson’s correlation coefficient. C cytoplasmic, D digested, M mitochondrial, N nuclear. T total, D Digested. Scale bars in C: 1 μm. Error bars indicate the mean *p < 0.05.
Fig. 7
Fig. 7. SIM2s interacts with and regulates Parkin mitochondrial loading.
A Mitochondrial fractions showing accumulation of SIM2, PRKN, and VDAC1 protein levels across HC11 cell differentiation. VDAC1 was used as a protein loading control, all differentiated timepoints were normalized to the undifferentiated timepoint. B Mitochondrial fractions from control and Sim2s HC11 cells at 24 h of differentiation with protein levels of PRKN and VDAC1. C Mitochondrial fractions from shControl and shSim2 HC11 cells at 24 h of differentiation showing protein levels of PRKN and COX4. D Co-immunoprecipitation of HA-PRKN and FLAG in control, Sim2s, or Sim2s-pATMΔ SUM159 cells. E Interaction of FLAG (tagged to SIM2s) and PRKN visualized by PLA in SUM159 cells. Interactions were detected as a fluorescent red dot and quantified as puncti per cell. PINK1:PRKN interactions were used as a positive assay control (n = 3–6 images per cell line per antibody, representative of two independent experiments). F Mitochondrial fractions from control, Sim2s, and Sim2s-pATMΔ HC11 cells at 24 h of differentiation with protein levels of PRKN and VDAC1. G Model of SIM2-PRKN interaction in response to hormonal stimuli; P primed for 24 h, PLA proximity ligation assay, U undifferentiated. Error bars indicate the mean ± SD. **p < 0.01. Scale bars: 10 μm in E.

References

    1. Institute of Medicine (US) Committee on Nutritional Status During Pregnancy and Lactation. Nutrition During Lactation. Washington (DC): National Academies Press (US); 1991.
    1. Anderson SM, Rudolph MC, McManaman JL, Neville MC. Key stages in mammary gland development. Secretory activation in the mammary gland: it’s not just about milk protein synthesis! Breast cancer research. BCR. 2007;9:204. doi: 10.1186/bcr1653. - DOI - PMC - PubMed
    1. Hadsell DL, Olea W, Wei J, Fiorotto ML, Matsunami RK, Engler DA, et al. Developmental regulation of mitochondrial biogenesis and function in the mouse mammary gland during a prolonged lactation cycle. Physiol Genomics. 2011;43:271–85. doi: 10.1152/physiolgenomics.00133.2010. - DOI - PubMed
    1. Davis KR, Giesy SL, Long Q, Krumm CS, Harvatine KJ, Boisclair YR. XBP1 regulates the biosynthetic capacity of the mammary gland during lactation by controlling epithelial expansion and endoplasmic reticulum formation. Endocrinology. 2016;157:417–28. doi: 10.1210/en.2015-1676. - DOI - PubMed
    1. Invernizzi G, Naeem A, Loor JJ. Short communication: endoplasmic reticulum stress gene network expression in bovine mammary tissue during the lactation cycle. J Dairy Sci. 2012;95:2562–6. doi: 10.3168/jds.2011-4806. - DOI - PubMed

Publication types

Substances