

Identification of pre-infection markers and differential plasma protein expression following SARS-CoV-2 infection in people living with HIV
- PMID: 36966617
- PMCID: PMC10037041
- DOI: 10.1016/j.ebiom.2023.104538
Identification of pre-infection markers and differential plasma protein expression following SARS-CoV-2 infection in people living with HIV
Abstract
Background: Mechanisms contributing to COVID-19 severity in people with HIV (PWH) are poorly understood. We evaluated temporal changes in plasma proteins following SARS-CoV-2 infection and identified pre-infection proteomic markers associated with future COVID-19.
Methods: We leveraged data from the global Randomized Trial to Prevent Vascular Events in HIV (REPRIEVE). Antiretroviral therapy (ART)-treated PWH with clinical, antibody-confirmed COVID-19 as of September 2021 were matched on geographic region, age, and sample timing to antibody negative controls. For cases and controls, pre COVID-19 pandemic specimens were obtained prior to January 2020 to assess change over time and relationship to COVID-19 severity, using false-discovery adjusted mixed effects modeling.
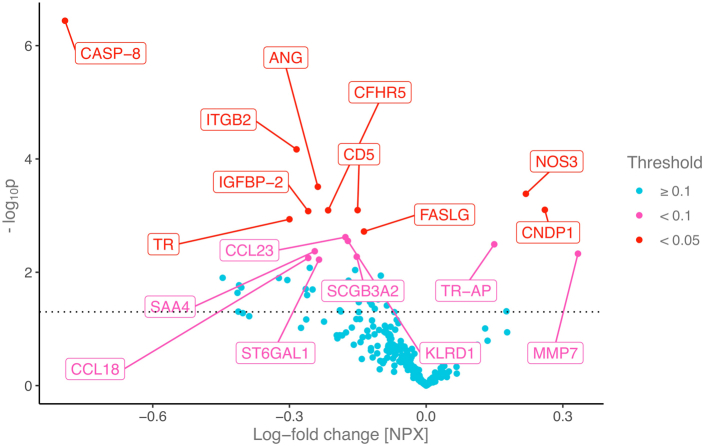
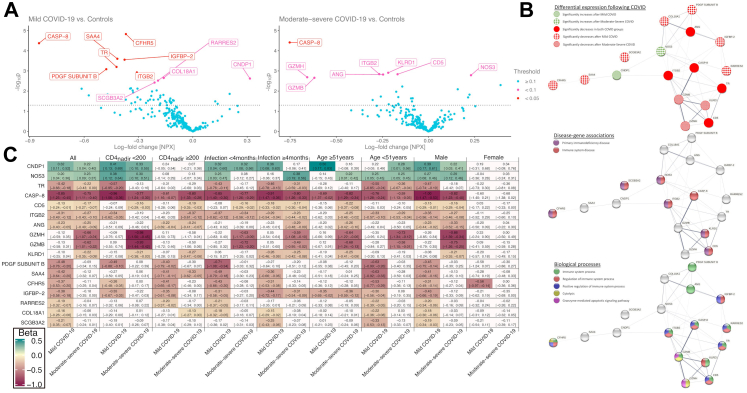
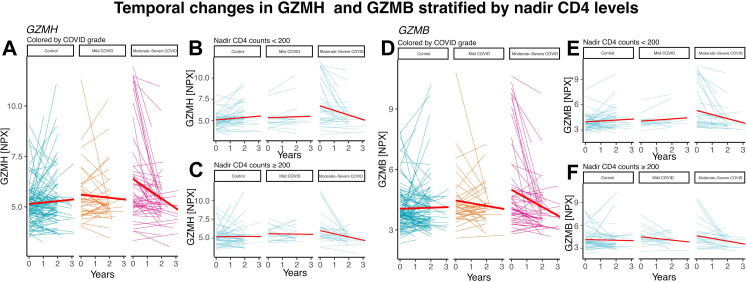
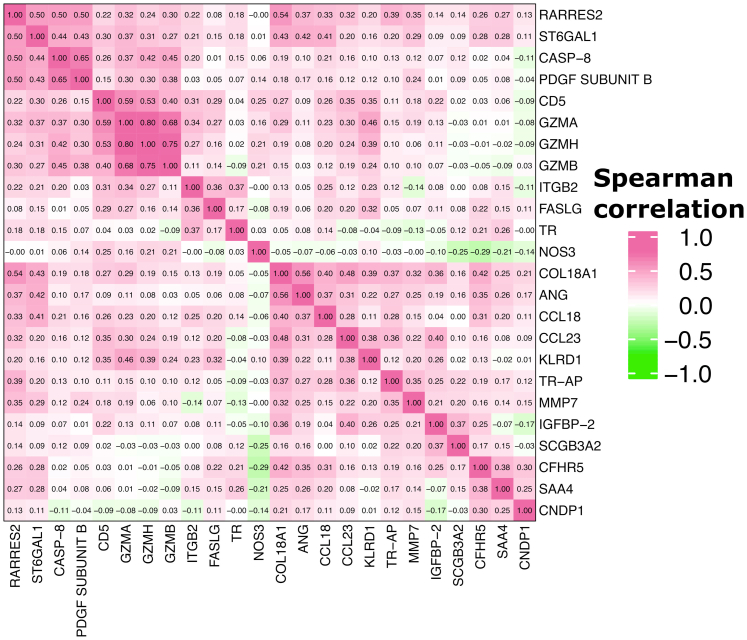
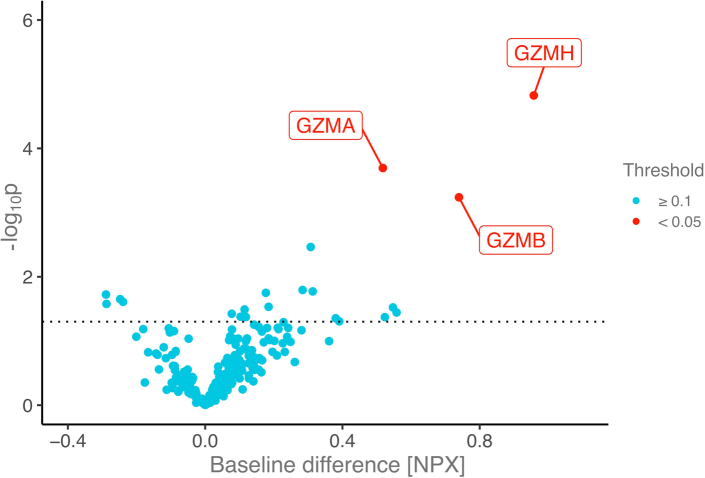
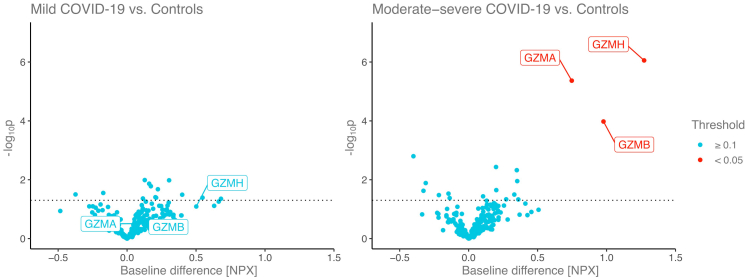
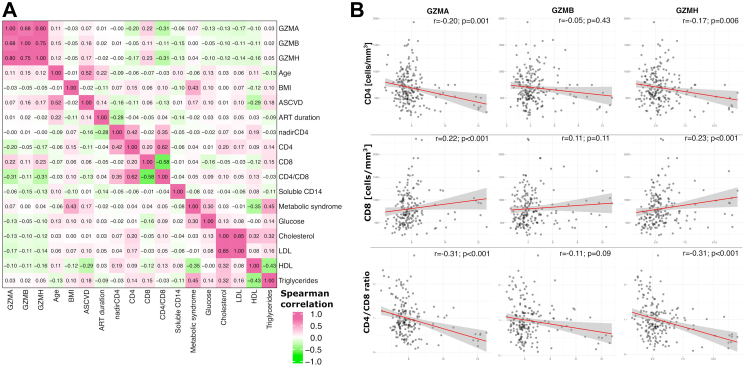
Findings: We compared 257 unique plasma proteins in 94 COVID-19 antibody-confirmed clinical cases and 113 matched antibody-negative controls, excluding COVID-19 vaccinated participants (age 50 years, 73% male). 40% of cases were characterized as mild; 60% moderate to severe. Median time from COVID-19 infection to follow-up sampling was 4 months. Temporal patterns of protein changes differed based on COVID-19 disease severity. Among those experiencing moderate to severe disease vs. controls, NOS3 increased whereas ANG, CASP-8, CD5, GZMH, GZMB, ITGB2, and KLRD1 decreased. Higher pre-pandemic levels of granzymes A, B and H (GZMA, GZMB and GZMH) were associated with the future development of moderate-severe COVID-19 and were related to immune function.
Interpretation: We identified temporal changes in proteins closely linked to inflammatory, immune, and fibrotic pathways which may relate to COVID-19-related morbidity among ART-treated PWH. Further we identified key granzyme proteins associated with future COVID-19 in PWH.
Funding: This study is supported through NIH grants U01HL123336, U01HL123336-06 and 3U01HL12336-06S3, to the clinical coordinating center, and U01HL123339, to the data coordinating center as well as funding from Kowa Pharmaceuticals, Gilead Sciences, and a grant award through ViiV Healthcare. The NIAID supported this study through grants UM1 AI068636, which supports the AIDS Clinical Trials Group (ACTG) Leadership and Operations Center, and UM1 AI106701, which supports the ACTG Laboratory Center. This work was also supported by NIAID through grant K24AI157882 to MZ. The work of IS was supported by the intramural research program of NIAID/NIH.
Keywords: COVID-19; Granzyme; Human immunodeficiency virus; SARS-CoV-2.
Copyright © 2023 The Author(s). Published by Elsevier B.V. All rights reserved.
Conflict of interest statement
Declaration of interests MK received financial support from the Ralph Schlaeger Fellowship Award from the Department of Radiology at Mass General Hospital (Boston, USA) outside of this project, and was also supported by the T32 fellowship 5T32HL076136 of the NIH. CD reports no disclosures. SM reports no disclosures. KVF reports no disclosures. MRD reports no disclosures. ESF reports no disclosures. HJR reports grant support from NIH/NIAID and NIH/NHLBI related to the conduct of the study, as well as grant support from NIH/NIAID, NIH/NHLBI, NIH/NIDDK, and NIH/NIA, outside the submitted work. CJF reports grant support through his institution from Gilead Sciences, ViiV Healthcare, GSK, Janssen, Abbvie, Merck, Amgen, and Cytodyn, outside the submitted work; and personal fees from Theratechnologies and ViiV for consulting and participation on Advisory Board unrelated to REPRIEVE with Theratechnologies and ViiV, and role as Chair on DSMB for Intrepid Study, outside the submitted work. JAA reports institutional research support for clinical trials from Atea, Emergent Biosolutions, Frontier Technologies, Gilead Sciences, GlaxoSmithKline, Janssen, MacroGenics, Merck, Pfizer, Regeneron, and ViiV Healthcare and personal fees for advisory boards from Glaxo Smith Kline/Viiv and Merck and participation on DSMB for Kintor Pharmaceuticals; all outside the submitted work. CDM reports institutional research support by Lilly and honoraria from ViiV Healthcare and Gilead Sciences for Advisory Board membership, outside the submitted work. JSC reports consulting fees from Merck and Company. JLC reports honoraria for presentations for Gilead, MSD, and Janssen, and honoraria from Viiv Healthcare and Gilead Sciences for Advisory Board membership, all outside the submitted work. FG has received compensation for lectures, presentations, speaker bureaus, educational events or advisory boards from Janssen-Cilag, Gilead Sciences and ViiV Healthcare, and support for attending meetings and/or travel from Janssen-Cilag and ViiV Healthcare, and participation on a DSMB or Advisory Board for Janssen-Cilag and ViiV Healthcare. IS reports no disclosures. PSD reports no disclosures. MVZ reports being Principal Investigator of research grants from NIH (NIAID and NHLBI) and from Gilead Sciences to her institution, receiving support from CROI and International Workshop for HIV and Women Conferences when invited to be an abstract reviewer and/or speaker, and participating in a DSMB for NIH-funded studies involving no compensation. SKG reports grant support through his institution from Kowa Pharmaceuticals America, Inc., Gilead Sciences, Inc., and ViiV Healthcare for the conduct of the study, as well as grants from Theratechnologies and Navidea and personal fees from Theratechnologies and ViiV, all outside the submitted work. He is a member of the Scientific Advisory Board of Marathon Asset management.
Figures

References
-
- WHO Coronavirus disease (COVID-19) dashboard. 2022. https://covid19.who.int/ Available from:
-
- Al-Aly Z., Xie Y., Bowe B. High-dimensional characterization of post-acute sequelae of COVID-19. Nature. 2021;594(7862):259–264. - PubMed
MeSH terms
Substances
Grants and funding
- UM1 AI069501/AI/NIAID NIH HHS/United States
- UG3 HL164285/HL/NHLBI NIH HHS/United States
- UM1 AI069456/AI/NIAID NIH HHS/United States
- K24 AI157882/AI/NIAID NIH HHS/United States
- U01 HL123339/HL/NHLBI NIH HHS/United States
- UM1 AI069494/AI/NIAID NIH HHS/United States
- UM1 AI069423/AI/NIAID NIH HHS/United States
- UM1 AI069412/AI/NIAID NIH HHS/United States
- UM1 AI068634/AI/NIAID NIH HHS/United States
- U01 HL123336/HL/NHLBI NIH HHS/United States
- U24 HL164284/HL/NHLBI NIH HHS/United States
- UM1 AI068636/AI/NIAID NIH HHS/United States
- P30 AI050410/AI/NIAID NIH HHS/United States
LinkOut - more resources
Full Text Sources
Medical
Research Materials
Miscellaneous
