Observational Study
. 2023 Apr 22;401(10385):1341-1360.
doi: 10.1016/S0140-6736(23)00461-0. Epub 2023 Mar 23.

Assessing COVID-19 pandemic policies and behaviours and their economic and educational trade-offs across US states from Jan 1, 2020, to July 31, 2022: an observational analysis

Affiliations
Observational Study

Assessing COVID-19 pandemic policies and behaviours and their economic and educational trade-offs across US states from Jan 1, 2020, to July 31, 2022: an observational analysis

Thomas J Bollyky et al. Lancet. .

Abstract

Background: The USA struggled in responding to the COVID-19 pandemic, but not all states struggled equally. Identifying the factors associated with cross-state variation in infection and mortality rates could help to improve responses to this and future pandemics. We sought to answer five key policy-relevant questions regarding the following: 1) what roles social, economic, and racial inequities had in interstate variation in COVID-19 outcomes; 2) whether states with greater health-care and public health capacity had better outcomes; 3) how politics influenced the results; 4) whether states that imposed more policy mandates and sustained them longer had better outcomes; and 5) whether there were trade-offs between a state having fewer cumulative SARS-CoV-2 infections and total COVID-19 deaths and its economic and educational outcomes.

Methods: Data disaggregated by US state were extracted from public databases, including COVID-19 infection and mortality estimates from the Institute for Health Metrics and Evaluation's (IHME) COVID-19 database; Bureau of Economic Analysis data on state gross domestic product (GDP); Federal Reserve economic data on employment rates; National Center for Education Statistics data on student standardised test scores; and US Census Bureau data on race and ethnicity by state. We standardised infection rates for population density and death rates for age and the prevalence of major comorbidities to facilitate comparison of states' successes in mitigating the effects of COVID-19. We regressed these health outcomes on prepandemic state characteristics (such as educational attainment and health spending per capita), policies adopted by states during the pandemic (such as mask mandates and business closures), and population-level behavioural responses (such as vaccine coverage and mobility). We explored potential mechanisms connecting state-level factors to individual-level behaviours using linear regression. We quantified reductions in state GDP, employment, and student test scores during the pandemic to identify policy and behavioural responses associated with these outcomes and to assess trade-offs between these outcomes and COVID-19 outcomes. Significance was defined as p<0·05.

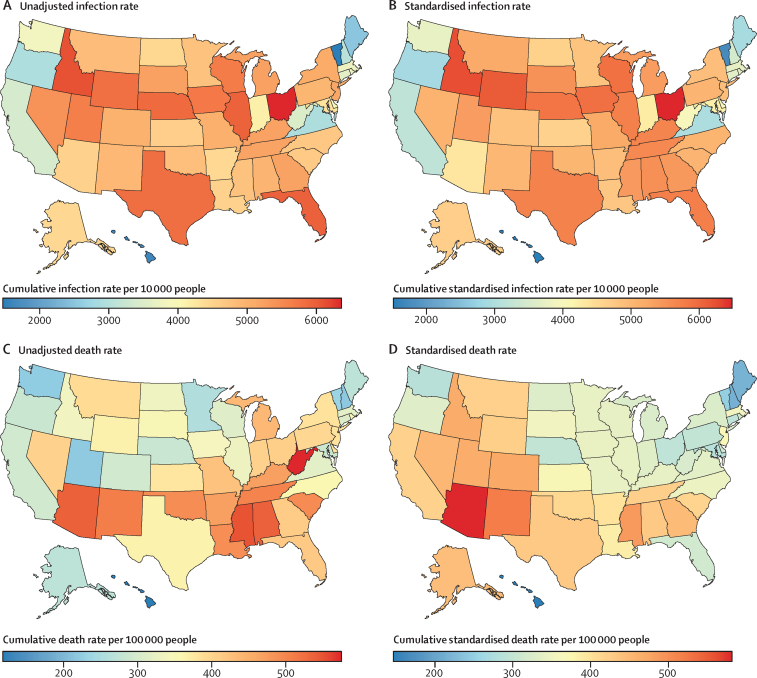
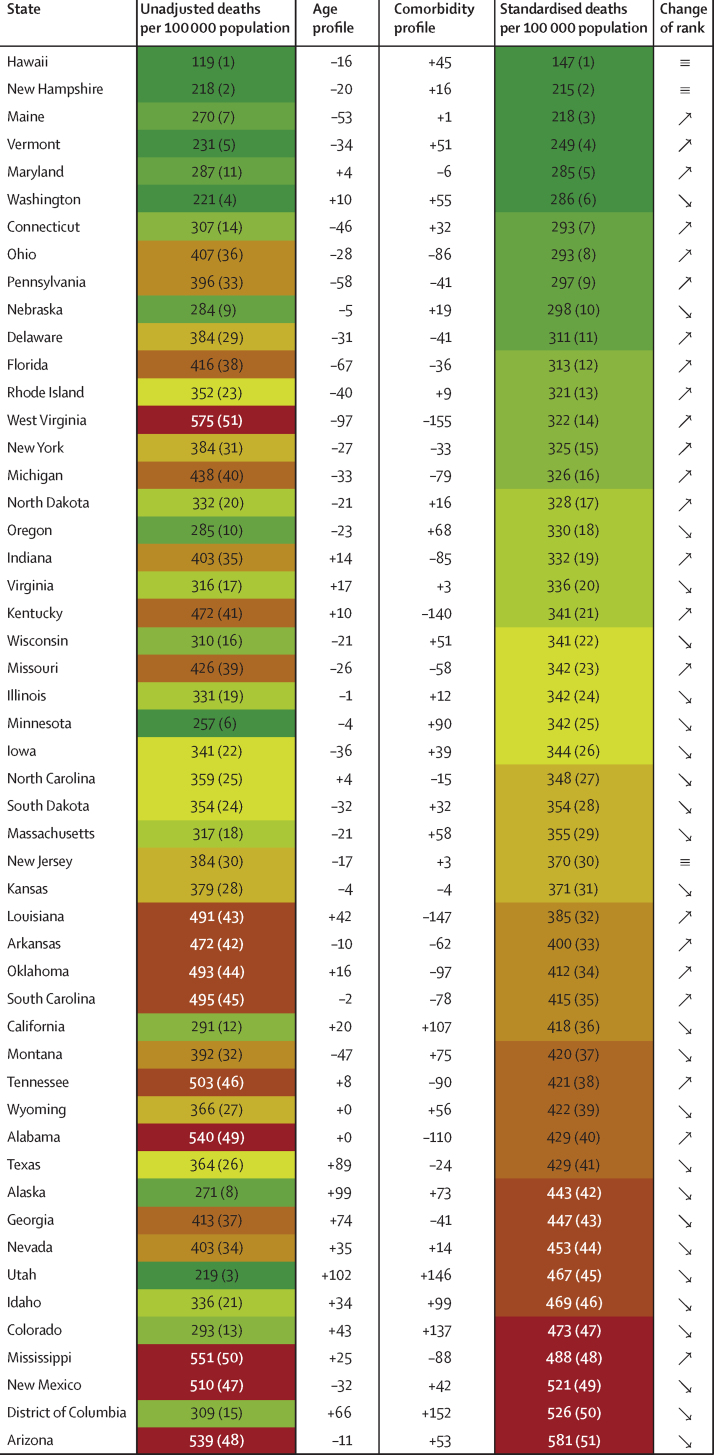
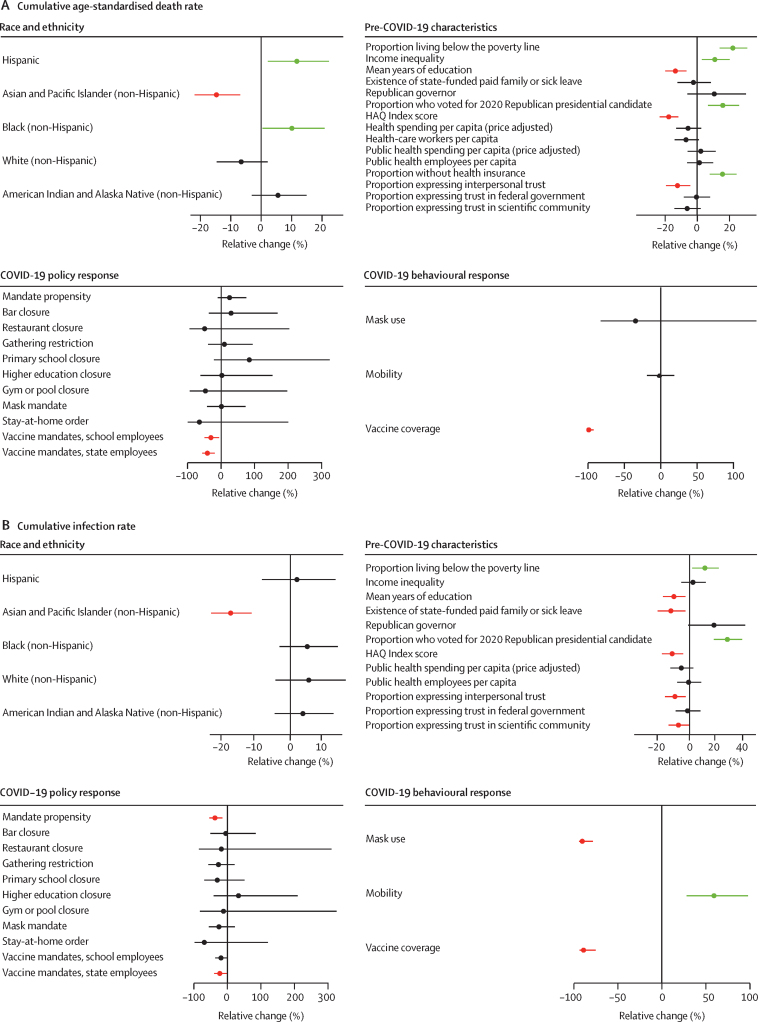
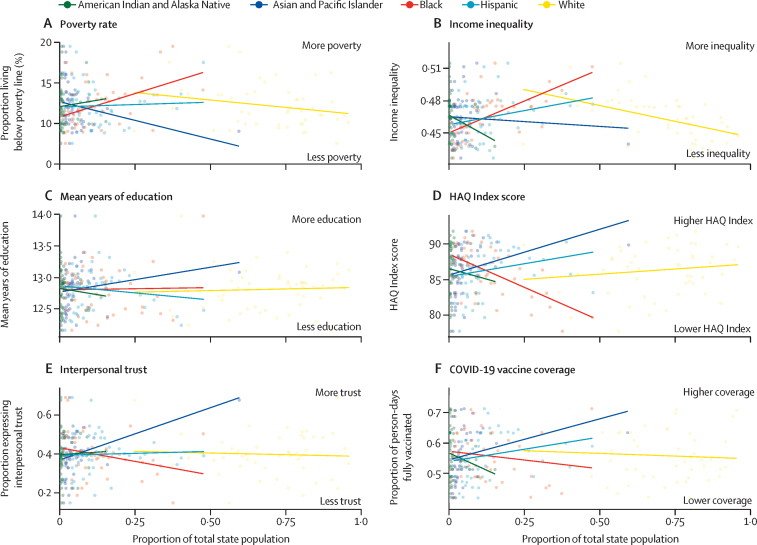
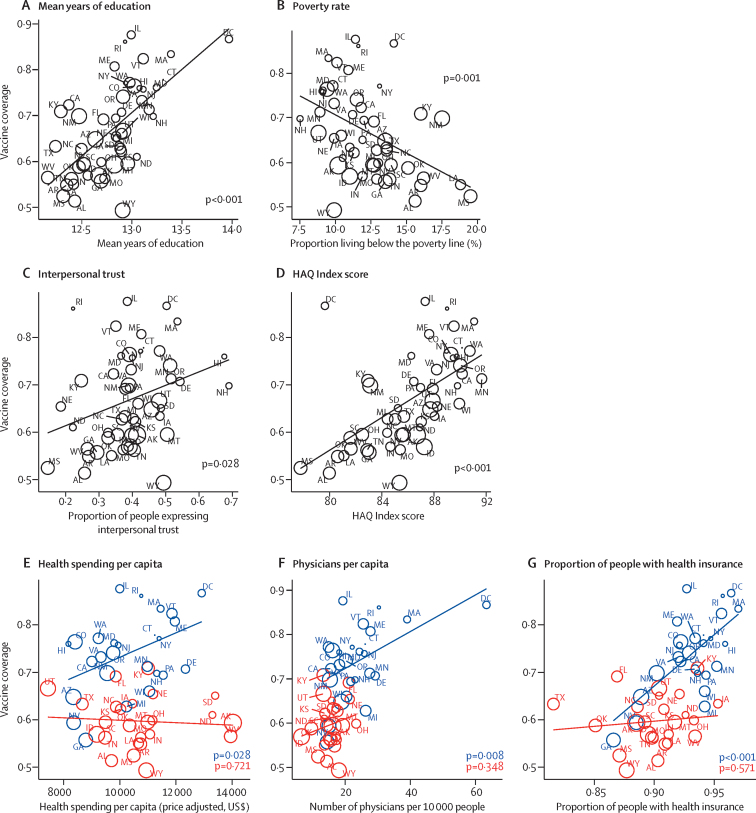
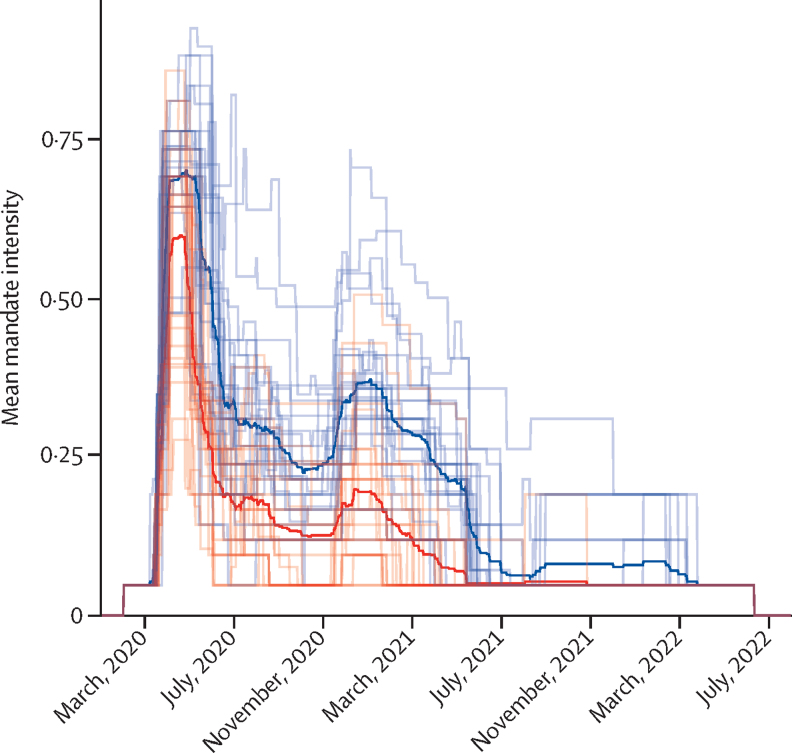
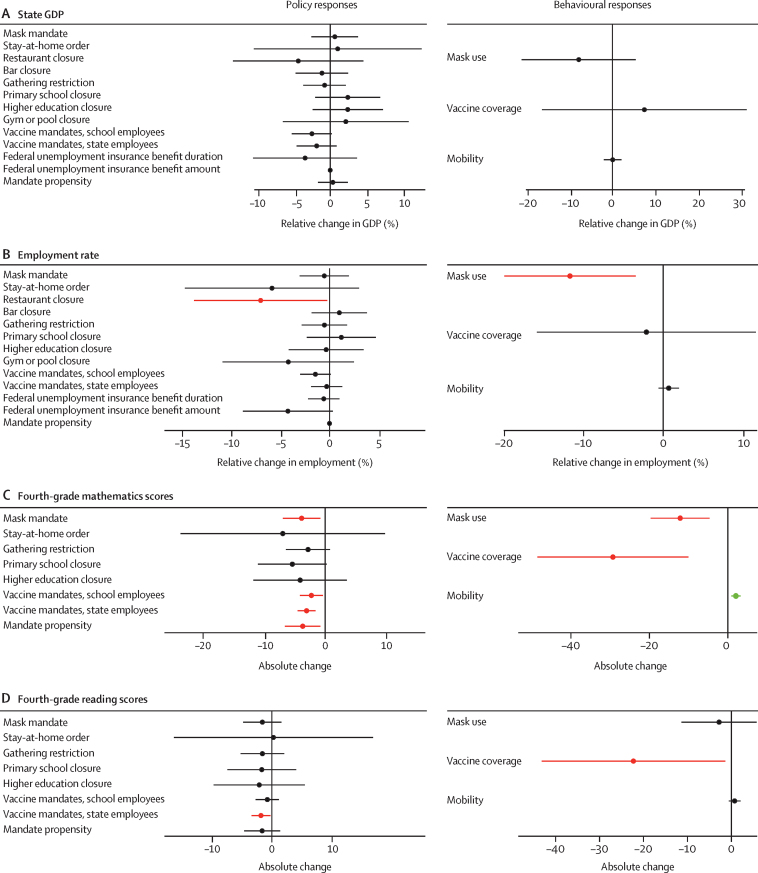
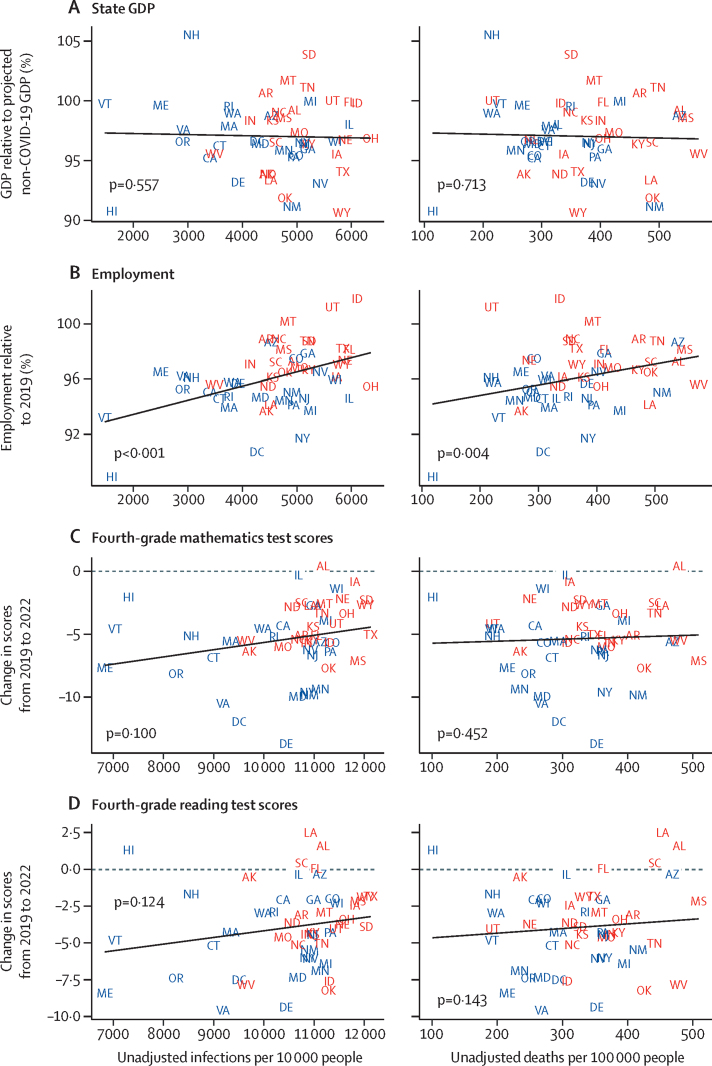
Findings: Standardised cumulative COVID-19 death rates for the period from Jan 1, 2020, to July 31, 2022 varied across the USA (national rate 372 deaths per 100 000 population [95% uncertainty interval [UI] 364-379]), with the lowest standardised rates in Hawaii (147 deaths per 100 000 [127-196]) and New Hampshire (215 per 100 000 [183-271]) and the highest in Arizona (581 per 100 000 [509-672]) and Washington, DC (526 per 100 000 [425-631]). A lower poverty rate, higher mean number of years of education, and a greater proportion of people expressing interpersonal trust were statistically associated with lower infection and death rates, and states where larger percentages of the population identify as Black (non-Hispanic) or Hispanic were associated with higher cumulative death rates. Access to quality health care (measured by the IHME's Healthcare Access and Quality Index) was associated with fewer total COVID-19 deaths and SARS-CoV-2 infections, but higher public health spending and more public health personnel per capita were not, at the state level. The political affiliation of the state governor was not associated with lower SARS-CoV-2 infection or COVID-19 death rates, but worse COVID-19 outcomes were associated with the proportion of a state's voters who voted for the 2020 Republican presidential candidate. State governments' uses of protective mandates were associated with lower infection rates, as were mask use, lower mobility, and higher vaccination rate, while vaccination rates were associated with lower death rates. State GDP and student reading test scores were not associated with state COVD-19 policy responses, infection rates, or death rates. Employment, however, had a statistically significant relationship with restaurant closures and greater infections and deaths: on average, 1574 (95% UI 884-7107) additional infections per 10 000 population were associated in states with a one percentage point increase in employment rate. Several policy mandates and protective behaviours were associated with lower fourth-grade mathematics test scores, but our study results did not find a link to state-level estimates of school closures.

Interpretation: COVID-19 magnified the polarisation and persistent social, economic, and racial inequities that already existed across US society, but the next pandemic threat need not do the same. US states that mitigated those structural inequalities, deployed science-based interventions such as vaccination and targeted vaccine mandates, and promoted their adoption across society were able to match the best-performing nations in minimising COVID-19 death rates. These findings could contribute to the design and targeting of clinical and policy interventions to facilitate better health outcomes in future crises.

Funding: Bill & Melinda Gates Foundation, J Stanton, T Gillespie, J and E Nordstrom, and Bloomberg Philanthropies.


Conflict of interest statement

Declaration of interests CA reports support for the current work from the Benificus Foundation. ADF reports other financial or non-financial support from Johnson & Johnson, Sanofi, and SwissRe outside of the submitted work. NF reports financial support from WHO and Gates Ventures outside of the submitted work. All other authors declare no competing interests.

Figures

Figure 1
Figure 1
Cumulative COVID-19 infection and death rates by US state Daily infection (Jan 1, 2020, to Dec 15, 2021) and death rates (Jan 1, 2020, to July 31, 2022) that were further adjusted for under-reporting were extracted from the Institute for Health Metrics and Evaluation's COVID-19 database. Standardised cumulative infection rates were adjusted to approximate what the cumulative infection rate would have been if every state had the population density of the USA. Standardised cumulative death rates were adjusted to approximate what the cumulative death rate would have been if every state had the age profile and comorbidity prevalence of the USA. Age standardisation was done using indirect age standardisation. All other standardisation was done with linear regression.
Figure 2
Figure 2
Cumulative death rate standardisation, Jan 1, 2020, to July 31, 2022 Cumulative death rates were adjusted for age profile and prevalence of key comorbidities. The resulting standardised cumulative rates reflect the cumulative death rate if each state had the national age profile and prevalence of comorbidities. Ranks are shown in parentheses. Comorbidities were proxied using the first component of a principal component analysis of asthma, cancer, chronic obstructive pulmonary disease, cardiovascular disease, diabetes, BMI, and smoking prevalence. The values expressed in the age and comorbidity profile columns represent the size of the adjustment (in deaths per 100 000) had a state exhibited the national pattern; positive values indicate that a state is younger or healthier than the nation as a whole, such that standardising the cumulative death rate to the national mean is associated with an increase in the cumulative death rate. The estimates were standardised for age by indirect age-standardisation, while comorbidities were adjusted with use of linear regression.
Figure 3
Figure 3
Factors associated with age-adjusted cumulative death rates (A) and infection rates (B) Graphs show the relative change in cumulative age-adjusted deaths or infections per capita that were associated with race and ethnicity (proportions of state population), pre-COVID-19 state characteristics, COVID-19 policy responses, and COVID-19 behavioural responses (values of each are provided in the appendix pp 67–71). For continuous pre-COVID-19 state characteristics, the reported relative change is that associated with a standard deviation increase from the national mean and age-standardised cumulative death rates. For continuous COVID-19 policy measures, the relative change is that associated with a state never having implemented a mandate versus implementing for the entire study period (see appendix pp 67–71 for further detail on all factors). All mortality models included that control and one of the variable of interest factors, meaning that each variable of interest was assessed separately. All infection models include population density as a control and one factor of interest. The comorbidity variable that was used as a control in the cumulative death rate models was constructed as the first principal component of asthma, cancer, chronic obstructive pulmonary disease, cardiovascular disease, diabetes, BMI, and smoking prevalence. The models assessing COVID-19 policy responses (other than mandate propensity) also include an additional control variable that was the first component of all the other policy responses. These estimated associations are not reported. The reported associations for the policy response should be interpreted as additional to the association tied to the mandate propensity variable. The analysis period is tailored to each independent variable (full details are provided in the appendix pp 67–71). Error bars are 95% CIs that account for uncertainty in death or infection data as well as modelling uncertainty. Statistical significance at the 95% level is indicated by green bars (significant increase) or red bars (significant decrease). HAQ=Healthcare Access and Quality.
Figure 4
Figure 4
Associations of race or ethnicity with factors shown to be statistically associated with cumulative death rates Graphs show how the proportion of each state identifying as each racial or ethnic category is associated with poverty rate (A), income inequality (B), mean years of education (C), HAQ Index score (D), proportion of people expressing interpersonal trust (E) in 2019, and vaccine coverage (vaccinated person-days per total person-days) from March 15, 2021, to July 31, 2022 (F). HAQ=Healthcare Access and Quality.
Figure 5
Figure 5
Associations between key pre-COVID-19 state characteristics and vaccine coverage, March 15, 2021, to July 31, 2022 Association of cumulative vaccine coverage (measured as the proportion of person-days a population was fully vaccinated between March 15, 2021, and July 31, 2022) with pre-COVID-19 state and health-system characteristics that were significantly associated with cumulative age-adjusted death rates and cumulative infection rates. For panels A–D, the fitted simple linear regression is shown and p values reflect the statistical significance of the relationship between the pre-COVID-19 factor and vaccine coverage. Initials identify each US state, and the size of a bubble reflects the standardised cumulative death rate for the same period. For panels E–G, states shown in blue voted for the Democratic Party's presidential candidate in 2020, while states shown in red voted for the Republican Party's presidential candidate in 2020; linear relationships between key health system variables and vaccine coverage (and corresponding p values) are shown separately for states that voted for the Democratic (blue) or Republican (red) presidential candidates in 2020. HAQ=Healthcare Access and Quality.
Figure 6
Figure 6
Timing and intensity of mandate adoption in Republican-leaning and Democratic-leaning states, Jan 1, 2020, to July 31, 2022 State-specific measures of mandate intensity over time. The mandate intensity variable combines information across 23 mandates covering seven categories: education closures, travel restrictions, gathering restrictions, stay-at-home orders, business closures, mask mandates, and curfews. Daily mandate variables are binary such that a value of 1 indicates the mandate was in effect for a particular location-day and a 0 indicates the mandate was not in effect on that location-day. To summarise overall mandate intensity, we took the mean by location-day within each of the seven mandate groups and then took the mean of those seven means to generate a single value for each location-day. Mandate intensity is presented as continuous values that vary from 0 to 1, where a 1 means all mandates were in effect on a given location-day and a 0 means no mandates were in effect on that location-day. Blue lines represent states that voted for the Democratic Party's presidential candidate in 2020, with the dark blue line representing the mean of those states. Red lines represent states that voted for the Republican Party's presidential candidate in 2020, with the dark red line representing the mean of those states.
Figure 7
Figure 7
Factors associated with reduction in standardised GDP, employment rate, and mathematics and reading test scores Graphs show estimated associations of COVID-19 policy and behavioural responses with state GDP, sector-standardised and defined as the ratio of expected to actual GDP (A); employment per capita, sector-standardised and defined as the ratio of expected to actual employment (B); changes in fourth-grade mathematics test scores (C); and changes in fourth-grade reading test scores (D). For continuous COVID-19 policy measures, the relative change is that associated with a state never having implemented a mandate versus implementing for the entire study period. Values and more information about interpreting these results are provided in the appendix (pp 72–77). In panels A and B, all regressions include controls for education, proportion of the population older than 65 years, proportion of the population younger than 20 years, mean weekly state unemployment benefits, and mean state unemployment benefit duration. All regressions assessing specific policy interventions also control for mandate propensity and the individual estimates should be interpreted as estimates in addition to the general propensity to impose policy interventions. Error bars are 95% CIs. Statistical significance at the 95% level is indicated by green bars (significant increase) or red bars (significant decrease). GDP=gross domestic product.
Figure 8
Figure 8
Economic indicators and education scores versus cumulative infection and death rates by state On the vertical axis of each figure is reduction in relative standardised GDP from Jan 1, 2020, to July 31, 2022 (A); relative standardised employment from Jan 1, 2020, to July 31, 2022 (B); change in the mean fourth-grade mathematics scores (possible scores range from 0 to 500) from autumn 2019 to autumn 2022 (C); and change in the mean of fourth-grade reading scores (possible scores range from 0 to 500) from autumn 2019 to autumn 2022 (D). Horizontal axes are cumulative infections per 10 000 people (Jan 1, 2020, to July 31, 2022) and cumulative deaths per 100 000 people (Jan 1, 2020, to July 31, 2022). p values show the statistical significance of the relationship between the two variables, with lines illustrating the association. Initials represent each state; those shown in blue voted for the Democratic Party's presidential candidate in 2020, and those shown in red voted for the Republican Party's presidential candidate in 2020. GDP=gross domestic product.

Comment in

References

    1. Yong E. How the pandemic defeated America. Aug 3, 2020. https://www.theatlantic.com/magazine/archive/2020/09/coronavirus-america...
    1. Holder J. Tracking coronavirus vaccinations around the world. Jan 29, 2021. https://www.nytimes.com/interactive/2021/world/covid-vaccinations-tracke...
    1. Isaac C. The U.S. and COVID-19: leading the world by GHS Index score, not by response. April 27, 2020. https://www.ghsindex.org/news/the-us-and-covid-19-leading-the-world-by-g...
    1. Crosby S, Dieleman JL, Kiernan S, Bollyky TJ. All bets are off for measuring pandemic preparedness. June 30, 2020. https://www.thinkglobalhealth.org/article/all-bets-are-measuring-pandemi...
    1. VoPham T, Weaver MD, Hart JE, Ton M, White E, Newcomb PA. Effect of social distancing on COVID-19 incidence and mortality in the US. medRxiv. 2020 doi: 10.1101/2020.06.10.20127589. published online June 12. (preprint). - DOI

Publication types