

Quantifying progression and regression across the spectrum of pulmonary tuberculosis: a data synthesis study
- PMID: 36966785
- PMCID: PMC10126316
- DOI: 10.1016/S2214-109X(23)00082-7
Quantifying progression and regression across the spectrum of pulmonary tuberculosis: a data synthesis study
Abstract
Background: Prevalence surveys show a substantial burden of subclinical (asymptomatic but infectious) tuberculosis, from which individuals can progress, regress, or even persist in a chronic disease state. We aimed to quantify these pathways across the spectrum of tuberculosis disease.
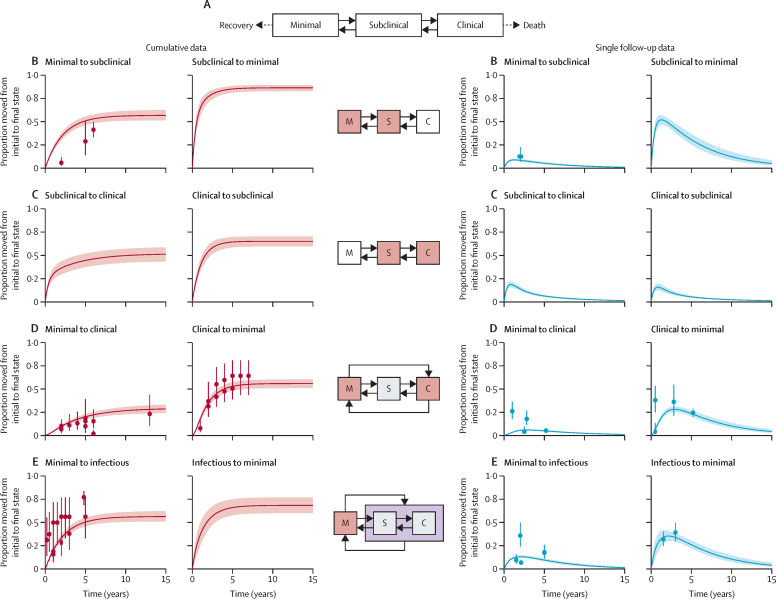
Methods: We created a deterministic framework of untreated tuberculosis disease with progression and regression between three states of pulmonary tuberculosis disease: minimal (non-infectious), subclinical (asymptomatic but infectious), and clinical (symptomatic and infectious). We obtained data from a previous systematic review of prospective and retrospective studies that followed and recorded the disease state of individuals with tuberculosis in a cohort without treatment. These data were considered in a Bayesian framework, enabling quantitative estimation of tuberculosis disease pathways with rates of transition between states and 95% uncertainty intervals (UIs).
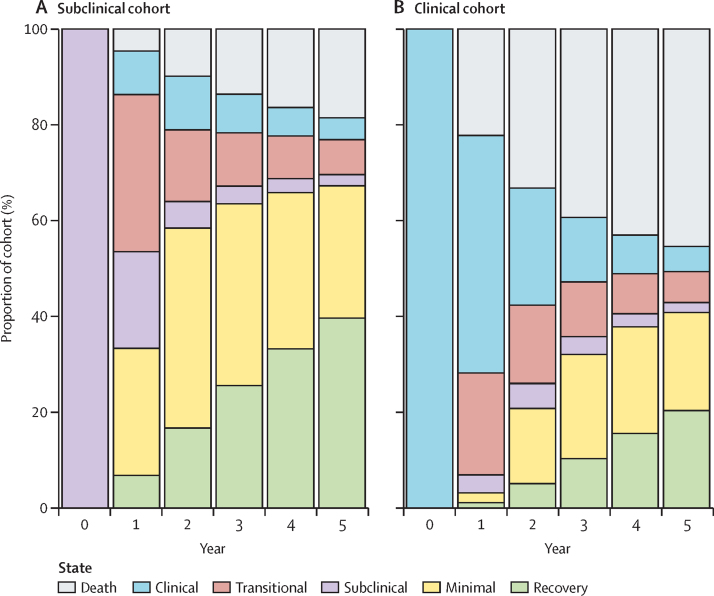
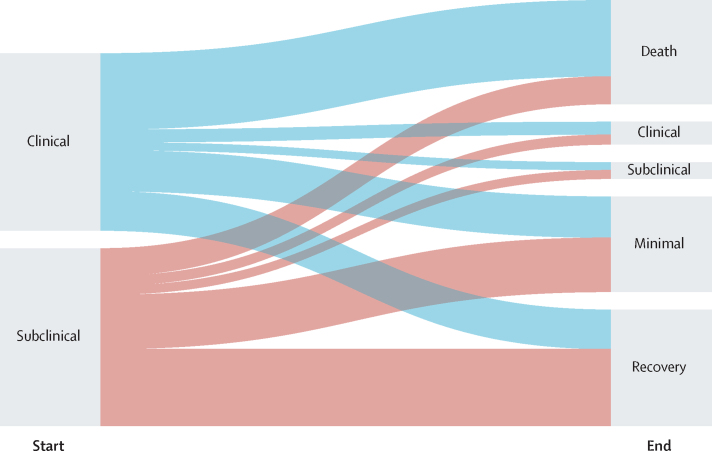
Findings: We included 22 studies with data from 5942 individuals in our analysis. Our model showed that after 5 years, 40% (95% UI 31·3-48·0) of individuals with prevalent subclinical disease at baseline recover and 18% (13·3-24·0) die from tuberculosis, with 14% (9·9-19·2) still having infectious disease, and the remainder with minimal disease at risk of re-progression. Over 5 years, 50% (40·0-59·1) of individuals with subclinical disease at baseline never develop symptoms. For those with clinical disease at baseline, 46% (38·3-52·2) die and 20% (15·2-25·8) recover from tuberculosis, with the remainder being in or transitioning between the three disease states after 5 years. We estimated the 10-year mortality of people with untreated prevalent infectious tuberculosis to be 37% (30·5-45·4).
Interpretation: For people with subclinical tuberculosis, classic clinical disease is neither an inevitable nor an irreversible outcome. As such, reliance on symptom-based screening means a large proportion of people with infectious disease might never be detected.
Funding: TB Modelling and Analysis Consortium and European Research Council.
Copyright © 2023 The Author(s). Published by Elsevier Ltd. This is an Open Access article under the CC BY 4.0 license. Published by Elsevier Ltd.. All rights reserved.
Conflict of interest statement
Declaration of interests FC coordinates a research project that received Xpert HR cartridges from Cepheid for evaluation of their utility for incipient tuberculosis. HE has participated on an advisory board for Cepheid concerning novel diagnostics with no payment or any other form of compensation received. All other authors declare no competing interests.
Figures
Comment in
-
Do chest x-ray-positive, sputum-negative individuals warrant more attention during tuberculosis screening?Lancet Respir Med. 2023 Apr;11(4):304-306. doi: 10.1016/S2213-2600(23)00085-1. Epub 2023 Mar 23. Lancet Respir Med. 2023. PMID: 36966790 No abstract available.
References
-
- WHO . World Health Organization; Geneva: 2022. Global tuberculosis report 2022.https://apps.who.int/iris/handle/10665/363752
-
- Gothi GD. Natural history of tuberculosis. Indian J Tuberc. 1978;25(suppl)
Publication types
MeSH terms
Grants and funding
LinkOut - more resources
Full Text Sources
Medical
Research Materials
