. 2023 May;22(5):e13806.
doi: 10.1111/acel.13806. Epub 2023 Mar 26.

Immunotherapeutic approach to reduce senescent cells and alleviate senescence-associated secretory phenotype in mice

Affiliations

Immunotherapeutic approach to reduce senescent cells and alleviate senescence-associated secretory phenotype in mice

Niraj Shrestha et al. Aging Cell. 2023 May.

Abstract

Accumulation of senescent cells (SNCs) with a senescence-associated secretory phenotype (SASP) has been implicated as a major source of chronic sterile inflammation leading to many age-related pathologies. Herein, we provide evidence that a bifunctional immunotherapeutic, HCW9218, with capabilities of neutralizing TGF-β and stimulating immune cells, can be safely administered systemically to reduce SNCs and alleviate SASP in mice. In the diabetic db/db mouse model, subcutaneous administration of HCW9218 reduced senescent islet β cells and SASP resulting in improved glucose tolerance, insulin resistance, and aging index. In naturally aged mice, subcutaneous administration of HCW9218 durably reduced the level of SNCs and SASP, leading to lower expression of pro-inflammatory genes in peripheral organs. HCW9218 treatment also reverted the pattern of key regulatory circadian gene expression in aged mice to levels observed in young mice and impacted genes associated with metabolism and fibrosis in the liver. Single-nucleus RNA Sequencing analysis further revealed that HCW9218 treatment differentially changed the transcriptomic landscape of hepatocyte subtypes involving metabolic, signaling, cell-cycle, and senescence-associated pathways in naturally aged mice. Long-term survival studies also showed that HCW9218 treatment improved physical performance without compromising the health span of naturally aged mice. Thus, HCW9218 represents a novel immunotherapeutic approach and a clinically promising new class of senotherapeutic agents targeting cellular senescence-associated diseases.

Keywords: aging; cellular immunology; circadian genes; immunotherapy; inflammation; physical performance; senescence; senescent cell reduction; senomorphic; type 2 diabetes.


Conflict of interest statement

HCW9218 is protected under US Patent No. 11,518, 972 and other pending patent applications. Unrelated to this work, MMB‐E and TAF are inventors on patent/patent applications (15/983,275; 62/963,971, and PCT/US2019/060005) licensed to Wugen, Inc. and held/submitted by Washington University that covers aspects of ML NK cell biology. This results in potential royalties to MMB‐E, TAF, and Washington University from Wugen, Inc. MMB‐E, TAF consults for and has equity in Wugen Inc. Unrelated to this work, JAF is an inventor on patent/patent application (WO 2019/152387, US 63/018,108) licensed to Kiadis, Inc. and held/submitted by Nationwide Children's Hospital on TGF‐β resistant, expanded NK cells. Unrelated to this work, JAF has a monoclonal antibody unrelated to the present work licensed to EMD Millipore. Unrelated to this work, CCC reports equity in Pionyr Immunotherapeutics. Unrelated to this work, TAF consults for Affimed (SAB) and advises (equity interest) Indapta and OrcaBio.

Figures
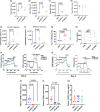
FIGURE 1
FIGURE 1
HCW9218 enhances immune‐mediated biological activities in db/db micee. (a–d). Representative flow cytometry data showing increase in immune cell surface makers on splenocytes of HCW9218‐treated mice at Day 4 compared to controls. Individual value plot show the mean (n = 6/group) from two independent experiments. (e, f) Representative flow cytometry data showing increase in central memory cell and effector memory cell numbers in splenocytes of mice treated with HCW9218 compared to PBS‐treated controls at Day 4. Individual value plot show the mean (n = 6/group) from two independent experiments. (g) Killing of Yac‐1 target cells by in vivo HCW9218 treated splenocytes compared to control splenocytes. Individual value plot shows the mean (n = 6/group) from two independent experiments. (h) Increase in interferon (IFN)‐γ released by CD3+ cells upon antigen‐independent stimulation by in vivo HCW9218 treated and ex vivo α‐CD3/α‐CD28 beads stimulated splenocytes compared to PBS control. Individual value plots show mean (n = 6/group) from one experiment. (i, j) Representative data for increase in extracellular acidification rates (ECAR) and oxygen consumption rates (OCR) data from splenocytes of HCW9218, HCW9228 or PBS‐treated mice and analyzed by Seahorse XFe Bioanalyzer (Agilent). (k‐m) ELISA data showing decrease in TGFβ1 and TGFβ2 but not TGFβ3 in plasma after HCW9218 or HCW9228 treatment. Individual value plot show the mean ± SEM (n = 5/group) from two independent experiments. p values were determined by ordinary one‐way ANOVA with Tukey's multiple comparisons test.
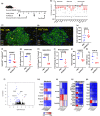
FIGURE 2
FIGURE 2
HCW9218 treatment reduces senescent pancreatic islet β cells and SASP factors to improve type‐2 diabetes of db/db mice. (a) Schema of HCW9218 treatment in db/db mouse model. (b) Expression of Aging, SASP, and β Cell index (related genes) in islet transcript was analyzed by quantitative PCR and normalized to control treatment. Individual value plot shows the mean  (n = 7/group) from two independent experiments. (c, d) Immunofluorescent staining of p21+ cells (yellow) and insulin+ β islet cells (green) in pancreatic tissue sections PBS (c), HCW9218 (d). (e) Number of insulin‐positive islet cells in tissue section. (f) Number of p21+ senescent cell in β islet cells in tissue section. (g–i) Relative comparison of Aging, SASP, and Beta Cell index in pancreas from HCW9218‐ and PBS‐treated mice was determined by quantitative PCR. Individual value plot show the mean (n = 6/group) from two independent experiments. (j) Fasting blood glucose after HCW9218 treatment. Graph shows mean (n = 5/group) from one experiment. (k) HOMA‐IR index after HCW9218 treatment. (l) Volcano plot for RNA‐seq analysis on the livers of db/db mice. (m–p) Heat Map for Metabolic, Senescence, Inflammation, and Vascular genes from bulk RNA‐Seq analysis of liver samples. p values were determined by Student's t tests.
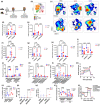
FIGURE 3
FIGURE 3
HCW9218 stimulates immune cell activity and metabolic functions in liver of naturally aged mice. (a) Schema of HCW9218 and HCW9228 treatment in young and aged mice model for Day 4 and Day 10. (b) Composite unbiased t‐SNE identifying B cells, T cells, and group 1 ILCs. (c) Representative viSNE plots colored by density from livers harvested at Day 4. Gates are colored by population and inset numbers represent frequency of I‐ILC (ILC1 cells). (d, e) Summary data from three independent experiments, (n = 6/group) demonstrating the increased total ILC‐1 cell frequency in the liver at Day 4 (d) and Day 10 (e). (f–i) Total NK cell frequency in the liver at Day 4 (f) and Day 10 (g) and in the spleen at Day 4 (h) and Day 10 (i) relative to control. (j) Percentage positive of Ki‐67 proliferation markers in liver. (k, l) Total CD8+ T‐cell frequency in the liver (k) and spleen (l) at Day 4 and Day 10. (m, n) Representative data for increase in extracellular acidification rates (ECAR) (m) and oxygen consumption rates (OCR) (n) data from splenocytes stimulated in vivo with HCW9218 from young and aged mice by Seahorse XFe bioanalyzer compared to control. (o) Measuring the ex vivo cytotoxic activity on Yac‐1 target cells by in vivo HCW9218‐stimulated splenocytes from young and aged mice compared to controls (PBS or HCW9228) by flow cytometry. Individual value plot shows the mean (n = 6/group) from two independent experiments. (p, q) Increase in IFN‐γ and TNF‐α released by CD3+ cells upon antigen‐independent stimulation by in vivo HCW9218 treated and ex vivo α‐CD3/α‐CD28 beads stimulated splenocytes compared to control aged and young mice measured by MAGPIX multiplexing system. Individual value plot show the mean (n = 5/group) from two independent experiments. (r) Representative flow cytometry data showing increase in percentage of intracellular Granzyme B markers in liver ILC‐1 and NK cells in young and aged mice treated with HCW9218 or controls. Individual value plot shows the mean (n = 6/group) from two independent experiments. p values were determined by ordinary one‐way ANOVA with Tukey's multiple comparisons test.
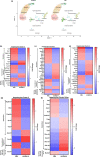
FIGURE 4
FIGURE 4
HCW9218 reduces inflammation (SASP) and cellular senescence markers of naturally aged mice in liver after one or two subcutaneous doses of HCW9218 or PBS. (a) HCW9218 treated aged mice liver cells bulk RNA‐Seq difference compared to control treatment in volcano plots after 60 days. (b, c) Heat maps of the differentially expressed senescence and inflammation, glucogenesis and fatty acid metabolism in liver after treatment with HCW9218 compared to control treatment by bulk RNA‐Seq plotted in fold change values (adjusted p value <0.05). (d) Heat maps of the differentially expressed circadian rhythm associated genes in liver after treatment with HCW9218 compared to control treatment by bulk RNA‐Seq. Scale shows the minimum and maximum normalized genes hit counts (adjusted p value <0.05).
FIGURE 5
FIGURE 5
Two‐dose HCW9218 stimulates metabolic functions and reduces inflammation (SASP) and cellular senescence markers in naturally aged mice liver for an extended time. (a) Schema of two‐dose HCW9218 treatment in naturally aged (76 weeks) female C57BL/6 mice that were subcutaneously injected with 3 mg/kg of HCW9218 (n = 5–8) or saline. Mice received second dose of HCW9218 at Day 60 and were euthanized at Day 120. (b, c) Relative mRNA expression of Il1α, Pai‐1, Il6, and Tnfα in kidney and Il1β, Il1α, PAI‐1, Il6, and Tnfα in liver was analyzed by quantitative PCR after treatment with HCW9218 compared to control at Day 10 and/or Day 60. Individual value plot shows the mean from two independent experiments. (d) Relative mRNA expression Il1α Cdkn1a, Pai‐1, Il1b, and Il6 in liver after treatment with HCW9218 one or two doses compared to control at Day 120 determined by quantitative PCR. Individual value plot shows the means  (n = 8/group). (e, f) ELISA data showing protein levels of IL‐1α, IL‐6, IL‐8, PAI‐1, and fibronectin in liver tissue by ELISA liver after treatment with HCW9218 one or two doses compared to control at Day 120. Individual value plot show the mean of 10 mice per group in an experiment. (g, h) Representative data for the increase in extracellular acidification rates (ECAR) and oxygen consumption rates (OCR) data from splenocytes stimulated in vivo with day 60 (g) and day 120 (h) measured by Seahorse XFe bioanalyzer compared to control. p values were determined by Student's t tests for two group comparison and p values were determined by ordinary one‐way ANOVA with Tukey's multiple comparisons test where there are more than two groups. (i‐k) Two‐dose HCW9218 stimulates metabolic functions and reduces inflammation (SASP) and cellular senescence markers in naturally aged mice liver for extended time by bulk RNA‐Seq analysis. Heat maps of the differentially expressed inflammation (i), senescence (j), and circadian rhythm (k) associated genes in liver after treatment with HCW9218 compared to control treatment plotted in fold changes (adjusted p value <0.05).
FIGURE 6
FIGURE 6
Uniform Manifold Approximation and Projection (UMAP) of single‐cell RNA‐Sequencing data with Seurat analysis. (a) Cells are clustered in 2 dimension using the UMAP dimensionality reduction technique and annotated by different cell types of liver cells after two‐dose treatment of either PBS or HCW9218. (b‐f) Heat maps of the differentially expressed metabolism associated, transcriptional regulators and signaling, cell cycle and senescence associated genes in different clusters of hepatocyte in liver after treatment with HCW9218 compared to control treatment plotted in fold changes (adjusted p value <0.05) Uniform Manifold Approximation and Projection (UMAP) of single‐cell RNA sequencing data with Seurat.
FIGURE 7
FIGURE 7
HCW9218 treatment provides significant maintenance of physical performance and was well tolerated by aged mice. (a) Grip strength test performed in aged mice treated with HCW9218 and HCW9228 compared to controls. Data show maintenance of grip strength (peak force) over time using Tukey's multiple comparisons test. (b) Rotarod performance in mice treated with saline, HCW9218 and HCW9228. (c) Open field test in the same mice mentioned above to measure total distance travelled (n = 5 for Control, HCW9218, and HCW9228; p values were determined by two‐way ANOVA with Tukey's multiple comparisons post hoc). (d) Probability of survival‐monitored for survival and analyzed using the log‐rank test. Summary data are from two experiments with n = 10 mice per group represented as mean. (e) Weight was measured after 5 months. (f, g) Representative flow cytometry data showing the percentage of NK cells and CD8+ T cells in blood of aged mice after HCW9218 or PBS treatment.

References

    1. Acosta‐Rodriguez, V. A. , Rijo‐Ferreira, F. , Green, C. B. , & Takahashi, J. S. (2021). Importance of circadian timing for aging and longevity. Nature Communications, 12, 2862. 10.1038/s41467-021-22922-6 - DOI - PMC - PubMed
    1. Aguayo‐Mazzucato, C. , Andle, J. , Lee, T. B., Jr. , Midha, A. , Talemal, L. , Chipashvili, V. , Hollister‐Lock, J. , van Deursen, J. , Weir, G. , & Bonner‐Weir, S. (2019). Acceleration of beta cell aging determines diabetes and Senolysis improves disease outcomes. Cell Metabolism, 30, 129–142.e4. 10.1016/j.cmet.2019.05.006 - DOI - PMC - PubMed
    1. Amor, C. , Feucht, J. , Leibold, J. , Ho, Y. J. , Zhu, C. , Alonso‐Curbelo, D. , Mansilla‐Soto, J. , Boyer, J. A. , Li, X. , Giavridis, T. , Kulick, A. , Houlihan, S. , Peerschke, E. , Friedman, S. L. , Ponomarev, V. , Piersigilli, A. , Sadelain, M. , & Lowe, S. W. (2020). Senolytic CAR T cells reverse senescence‐associated pathologies. Nature, 583, 127–132. 10.1038/s41586-020-2403-9 - DOI - PMC - PubMed
    1. Baker, D. J. , Childs, B. G. , Durik, M. , Wijers, M. E. , Sieben, C. J. , Zhong, J. , A. Saltness, R. , Jeganathan, K. B. , Verzosa, G. C. , Pezeshki, A. , Khazaie, K. , Miller, J. D. , & van Deursen, J. M. (2016). Naturally occurring p16(Ink4a)‐positive cells shorten healthy lifespan. Nature, 530, 184–189. 10.1038/nature16932 - DOI - PMC - PubMed
    1. Bal, S. M. , Golebski, K. , & Spits, H. (2020). Plasticity of innate lymphoid cell subsets. Nature Reviews. Immunology, 20, 552–565. 10.1038/s41577-020-0282-9 - DOI - PubMed

Publication types

LinkOut - more resources