. 2023 Mar;13(3):e1210.
doi: 10.1002/ctm2.1210.

Destabilization of microrchidia family CW-type zinc finger 2 via the cyclin-dependent kinase 1-chaperone-mediated autophagy pathway promotes mitotic arrest and enhances cancer cellular sensitivity to microtubule-targeting agents

Affiliations

Destabilization of microrchidia family CW-type zinc finger 2 via the cyclin-dependent kinase 1-chaperone-mediated autophagy pathway promotes mitotic arrest and enhances cancer cellular sensitivity to microtubule-targeting agents

Shu-Yuan Hu et al. Clin Transl Med. 2023 Mar.

Abstract

Background: Microtubule-targeing agents (MTAs), such as paclitaxel (PTX) and vincristine (VCR), kill cancer cells through activtion of the spindle assembly checkpoint (SAC) and induction of mitotic arrest, but the development of resistance poses significant clinical challenges.

Methods: Immunoblotting and RT-qPCR were used to investigate potential function and related mechanism of MORC2. Flow cytometry analyses were carried out to determine cell cycle distribution and apoptosis. The effect of MORC2 on cellular sensitivity to PTX and VCR was determined by immunoblotting, flow cytometry, and colony formation assays. Immunoprecipitation assays and immunofluorescent staining were utilized to investigate protein-protein interaction and protein co-localization.

Results: Here, we identified microrchidia family CW-type zinc finger 2 (MORC2), a poorly characterized oncoprotein, as a novel regulator of SAC activation, mitotic progression, and resistance of cancer cells to PTX and VCR. Mechanically, PTX and VCR activate cyclin-dependent kinase 1, which in turn induces MORC2 phosphorylation at threonine 717 (T717) and T733. Phosphorylated MORC2 enhances its interation with HSPA8 and LAMP2A, two essential components of the chaperone-mediated autophagy (CMA) mechinery, resulting in its autophagic degradation. Degradation of MORC2 during mitosis leads to SAC activation through stabilizing anaphase promoting complex/cyclosome activator protein Cdc20 and facilitating mitotic checkpoint complex assembly, thus contributing to mitotic arrest induced by PTX and VCR. Notably, knockdown of MORC2 promotes mitotic arrest induced by PTX and VCR and enhances the sensitivity of cancer cells to PTX and VCR.

Conclusions: Collectively, these findings unveil a previously unrecognized function and regulatory mechanism of MORC2 in mitotic progression and resistance of cancer cells to MTAs. These results also provide a new clue for developing combined treatmentstrategy by targeting MORC2 in combination with MTAs against human cancer.

Keywords: MORC2; chaperone-mediated autophagy; cyclin-dependent kinase 1; microtubule-targeting agents; mitotic arrest; spindle assembly checkpoint.


Conflict of interest statement

The authors declare no conflict of interest.

Figures
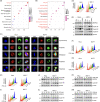
FIGURE 1
FIGURE 1
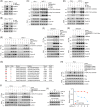
MORC2 protein levels are decreased following treatment of cells with PTX and VCR. (A, B) KEGG (A) and GSEA (B) analyses using TCGA breast cancer database. (C) Immunofluorescent staining was performed to detect alternations in subcellular localization of MORC2. HeLa and MCF‐7 cells were stained with an anti‐MORC2 (red) or an α‐tubulin (green) antibody. DAPI (blue) was used to stain DNA. (D) HeLa and MCF‐7 cells were synchronized at the indicated stages of the cell cycle through the double‐thymidine block and thymidine‐nocodazole arrest. Flow cytometric analysis was performed to determine cell‐cycle distribution. (E) HeLa and MCF‐7 cells were synchronized at the indicated stages of the cell cycle through the double‐thymidine block and thymidine‐nocodazole arrest. Immunoblotting analysis was performed to detect MORC2 protein levels. (F, G) HeLa and MCF‐7 cells were treated with the indicated doses of PTX (F) or VCR (G) for 24 h.Flow cytometric analysis was performed to determine cell‐cycle distribution. (H, I) HeLa and MCF‐7 cells were treated with 100 nM PTX (H) or VCR (I) for the indicated times. Flow cytometric analysis was performed to determine cell‐cycle distribution. (J, K) HeLa and MCF‐7 cells were treated with the indicated doses of PTX (J) or VCR (K) for 24 h. Immunoblotting analysis was performed to detect MORC2 protein levels. (L, M) HeLa and MCF‐7 cells were treated with 100 nM PTX (L) or VCR (M) for the indicated times. Immunoblotting analysis was performed to detect MORC2 protein levels.
FIGURE 2
FIGURE 2
PTX and VCR induce MORC2 degradation via the CMA pathway. (A, B) HeLa and MCF‐7 cells were preincubated with or without 50 ng/ml bafilomycin A1 (BafA1) for 1 h and then treated with or without 100 nM PTX (A) or VCR (B) for 24 h. Immunoblotting analysis was performed to detect MORC2 protein levels. (C, D) HeLa and MCF‐7 cells were transfected with negative control siRNA (siNC) or siRNAs targeting HSPA8 (siHSPA8) (C) or LAMP2A (siLAMP2A) (D), followed by treatment with DMSO or 100 nM PTX for 24 h. Immunoblotting analysis was performed to detect MORC2 protein levels. (E, F) HeLa and MCF‐7 cells were transfected with siNC or siHSPA8 (E) or siLAMP2A (F), followed by treatment with DMSO or 100 nM VCR for 24 h. Immunoblotting analysis was performed to detect MORC2 protein levels. (G, H) HeLa and MCF‐7 cells were treated with or without 100 nM PTX (G) or VCR (H) for 24 h. IP analysis was performed using control IgG or an anti‐MORC2 antibody to detect the interactions between MORC2 and HSPA8/LAMP2A. (I, J) HEK293T cells were transfected with pCDH or Flag‐MORC2 expression vector, followed by treatment with or without 100 nM PTX (I) or VCR (J) for 24 h. IP analysis using Flag‐tagged beads was performed to detect the interactions between exogenous MORC2 and HSPA8/LAMP2A. (K) HeLa and MCF‐7 cells were transfected with Flag‐MORC2 expression vector, followed by treatment with or without 100 nM PTX or VCR for 24 h. Immunofluorescent staining was performed to detect the co‐localization between MORC2 and HSPA8/LAMP2A. Cells were stained with an anti‐Flag (green) or HSPA8 (red) or LAMP2A (red) antibody. DAPI (blue) was used to stain DNA.
FIGURE 3
FIGURE 3
Downregulation of MORC2 by PTX and VCR is dependent on CDK1. (A‐B) HeLa and MCF‐7 cells were treated with indicated doses of PTX (A) or VCR (B) for 24 h. Immunoblotting analysis was performed to detect the phosphorylation status of CDK1. (C‐D) HeLa and MCF‐7 cells were treated with 100 nM PTX (C) or VCR (D) for the indicated times. Immunoblotting analysis was performed to detect the phosphorylation status of CDK1. (E‐F) HeLa and MCF‐7 cells were pretreated with 5 μM RO‐3306 for 1 h and then incubated with or without 100 nM PTX (E) or VCR (F) for 24 h. Immunoblotting analysis was performed to detect MORC2 protein levels. (G) HeLa and MCF‐7 cells were transfected with siNC or siRNAs targeting CDK1 for 48 h. Immunoblotting analysis was performed to detect MORC2 protein levels. (H‐I) HeLa and MCF‐7 cells were transfected with siNC or siRNAs targeting CDK1 and then treated with or without 100 nM PTX (H) or VCR (I) for 24 h. Immunoblotting analysis was performed to detect MORC2 protein levels.
FIGURE 4
FIGURE 4
PTX and VCR promote CDK1‐mediated phosphorylation of MORC2 to induce its degradation. (A) IP assays using control IgG or an anti‐MORC2 antibody were performed to detect the interactions between MORC2 and CDK1 in HeLa and MCF‐7 cells. (B) IP assays using control IgG or an anti‐CDK1 antibody were performed to detect the interactions between CDK1 and MORC2 in HeLa and MCF‐7 cells. (C) HeLa and MCF‐7 cells were transfected with pCDH or Flag‐MORC2 expression vector and then treated with 100 nM PTX for the indicated times. IP assays using Flag‐tagged beads were performed to detect the phosphorylation levels of MORC2. (D) HeLa and MCF‐7 cells were treated with DMSO or 100 nM PTX for 24 h. IP assays using control IgG or an anti‐MORC2 antibody were performed to detect the phosphorylation levels of MORC2. (E) HeLa and MCF‐7 cells were transfected with pCDH or Flag‐MORC2 expression vector, pretreated with 5 μM RO‐3306 for 1 h, followed by incubation with or without 100 nM PTX for 24 h. IP assays using Flag‐tagged beads were performed to detect the phosphorylation levels of MORC2. (F) HEK293T cells were transfected with pCDH or Flag‐MORC2 expression vector, pretreated with 5 μM RO‐3306 for 1 h, followed by incubation with or without 100 nM PTX for 24 h. IP assays using Flag‐tagged beads were performed to detect the interactions between exogenous MORC2 and endogenous HSPA8/LAMP2A. (G) The group‐based prediction system (GPS) 5.0 software (http://gps.biocuckoo.org) was used to predict CDK1‐specific phosphorylation sites in MORC2. (H) HeLa cells were transfected with pCDH, WT and mutant Flag‐MORC2 expression vectors, followed by treatment with or without 100 nM PTX for 24 h. IP assays using Flag‐tagged beads were performed to detect the phosphorylation levels of MORC2. (I) HeLa and MCF‐7 cells were transfected with pCDH, WT and T717A/T733A mutant Flag‐MORC2 expression vectors, followed by treatment with or without 100 nM PTX for 24 h. IP assays using Flag‐tagged beads were performed to detect the phosphorylation levels of MORC2. (J) HEK293T cells were transfected with WT and T717A/T733A mutant Flag‐MORC2 expression vectors, preincubated with 100 nM PTX for 1 h and then incubated with 100 μg/ml CHX for the indicated times. Immunoblotting analysis was performed to detect the stability of MORC2 protein. (K) HEK293T cells were transfected with pCDH, WT and T717A/T733A mutant Flag‐MORC2 expression vectors, followed by treatment with or without 100 nM PTX for 24 h. IP assays using Flag‐tagged beads were performed to detect the interactions between exogenous MORC2 and endogenous HSPA8/LAMP2A.
FIGURE 5
FIGURE 5
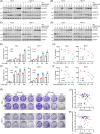
Depletion of MORC2 enhances the sensitivity of cancer cells to PTX and VCR. (A, B) WT and MORC2‐KO HeLa and MCF‐7 cells were treated with indicated doses of PTX for 24 h (A) or with 100 nM PTX for the indicated times (B). Immunoblotting analysis was performed to detect the expression levels of H3 pS10. (C, D) WT and MORC2‐KO HeLa and MCF‐7 cells were treated with 100 nM VCR for 24 h (C) or with 100 nM VCR for the indicated times (D). Immunoblotting analysis was performed to detect the expression levels of H3 pS10. (E, F) WT and MORC2‐KO HeLa and MCF‐7 cells were treated with indicated doses of PTX (E) or VCR (F) for 48 h. Apoptosis analysis via flow cytometry was performed to detect the percentage of cells that undergo apoptosis in response to drug treatment. (G–I) WT and MORC2‐KO HeLa and MCF‐7 cells were treated with PTX or VCR at indicated concentrations and subjected to colony formation assays. After 10−14 days of treatment, survival colonies were stained with 1% crystal violet and counted. Representative images of survival colonies are presented in G, and the corresponding quantitative results are shown in H and I. (J, K) The correlation between MORC2 expression levels and drug activity of PTX (J) and vinorelbine (K) was analyzed using the CellMiner database.
FIGURE 6
FIGURE 6
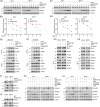
MORC2 compromises the SAC function. (A, B) WT and MORC2‐KO HeLa and MCF‐7 cells were synchronized at prometaphase using nocodazole and released into mitosis for the indicated times. Immunoblotting analysis was performed to detect the protein levels of cyclin B1. Representative results are presented in A and quantitative results are shown in B. (C, D) HeLa and MCF‐7 cells stably expressing pCDH and Flag‐MORC2 were synchronized at prometaphase using nocodazole and released into mitosis for the indicated times. Immunoblotting analysis was performed to detect the protein levels of cyclin B1. Representative results are presented in C and the corresponding quantitative results are shown in D. (E, F) HEK293T cells were first transfected with pLVX and HA‐Cdc20 expression vectors and then infected with or without Flag‐MORC2 lentivirus, followed by incubation with or without 100 nM PTX (E) or VCR (F) for 24 h. IP assays using HA‐tagged beads were performed to detect the association between Cdc20 and Bub3/BubR1. (G, H) WT and MORC2‐KO HeLa and MCF‐7 cells were treated with or without 100 nM PTX (G) or VCR (H) for 24 h. IP assays using an anti‐Cdc20 antibody were performed to detect the association between Cdc20 and Bub3/BubR1. (I) Immunoblotting analysis was performed to detect the protein levels of Cdc20 in HeLa and MCF‐7 cells stably expressing pCDH and Flag‐MORC2. (J) Immunoblotting analysis was performed to detect the protein levels of Cdc20 in WT and MORC2‐KO HeLa and MCF‐7 cells. (K, L) WT and MORC2‐KO HeLa and MCF‐7 cells were transfected with siNC or siRNAs targeting Cdc20 and then incubated with or without 100 nM PTX (K) or VCR (L) for 24 h. Immunoblotting analysis was performed to detect the expression levels of H3 pS10.
FIGURE 7
FIGURE 7
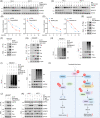
MORC2 induces proteasomal degradation of Cdc20 via blocking the interaction of USP9X with CDC20. (A, B) HeLa and MCF‐7 cells stably expressing pCDH and Flag‐MORC2 were incubated with 100 μg/ml CHX for the indicated times. Immunoblotting analysis was performed to detect the protein levels of Cdc20. Representative results are presented in A and quantitative results are shown in B. (C, D) WT and MORC2‐KO HeLa and MCF‐7 cells were incubated with 100 μg/ml CHX for the indicated times. Immunoblotting analysis was performed to detect the protein levels of Cdc20. Representative results are presented in C and quantitative results are shown in D. (E) HEK293T cells were transfected with pCDH or Flag‐MORC2 expressing vector. IP analysis was performed using Flag‐tagged beads to detect the interaction between MORC2 and Cdc20. (F) HEK293T cells were transfected with pLVX or HA‐Cdc20 expressing vector. IP analysis was performed using HA‐tagged beads to detect the interaction between Cdc20 and MORC2. (G) HEK293T cells were transfected with Flag‐MORC2 and HA‐Cdc20 expressing vectors alone or in combination. IP analysis was performed using Flag‐ or HA‐tagged beads to detect the interaction between MORC2 and Cdc20. (H) HEK293T cells were first co‐transfected with HA‐Cdc20, V5‐ubiquitin (Ub) expression vectors and then infected with or without Flag‐MORC2 lentivirus, followed by incubation with 10 μM MG‐132 for 6 h. IP analysis using HA‐tagged beads was performed to detect the ubiquitination levels of Cdc20. (I) HEK293T cells were first co‐transfected with HA‐Cdc20, V5‐ubiquitin (Ub) expression vectors and then infected with or without shNC and shUSP9X (#1 and #2) lentivirus, followed by incubation with 10 μM MG‐132 for 6 h. IP analysis using HA‐tagged beads was performed to detect the ubiquitination levels of Cdc20. (J) HEK293T cells were first transfected with pLVX and HA‐Cdc20 expression vectors and then infected with or without Flag‐MORC2 lentivirus. IP analysis using HA‐tagged beads was performed to detect the association between Cdc20 and USP9X. (K) IP analysis using control IgG or an anti‐Cdc20 antibody was performed to detect the association between Cdc20 and USP9X in WT and MORC2‐KO HeLa and MCF‐7 cells. (L) The proposed working model.

Similar articles

Cited by

References

    1. Jackson J, Patrick D, Dar M, Huang P. Targeted anti‐mitotic therapies: can we improve on tubulin agents? Nat Rev Cancer. 2007;7(2):107‐117. doi:10.1038/nrc2049 - DOI - PubMed
    1. Jordan M, Wilson L. Microtubules as a target for anticancer drugs. Nat Rev Cancer. 2004;4(4):253‐265. doi:10.1038/nrc1317 - DOI - PubMed
    1. Yu H. Regulation of APC‐Cdc20 by the spindle checkpoint. Curr Opin Cell Biol. 2002;14(6):706‐714. doi:10.1016/s0955‐0674(02)00382‐4 - DOI - PubMed
    1. Henriques AC, Ribeiro D, Pedrosa J, Sarmento B, Silva PMA, Bousbaa H. Mitosis inhibitors in anticancer therapy: when blocking the exit becomes a solution. Cancer Lett. 2019;440‐441:64‐81. doi:10.1016/j.canlet.2018.10.005 - DOI - PubMed
    1. Rieder C, Maiato H. Stuck in division or passing through: what happens when cells cannot satisfy the spindle assembly checkpoint. Dev Cell. 2004;7(5):637‐651. doi:10.1016/j.devcel.2004.09.002 - DOI - PubMed

Publication types