. 2023 May;10(15):e2206007.
doi: 10.1002/advs.202206007. Epub 2023 Mar 26.

The Imbalance of p53-Park7 Signaling Axis Induces Iron Homeostasis Dysfunction in Doxorubicin-Challenged Cardiomyocytes

Affiliations

The Imbalance of p53-Park7 Signaling Axis Induces Iron Homeostasis Dysfunction in Doxorubicin-Challenged Cardiomyocytes

Jianan Pan et al. Adv Sci (Weinh). 2023 May.

Abstract

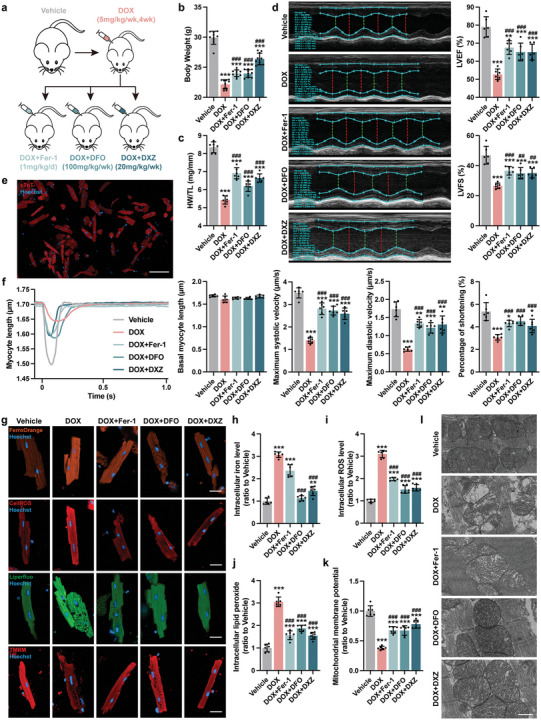
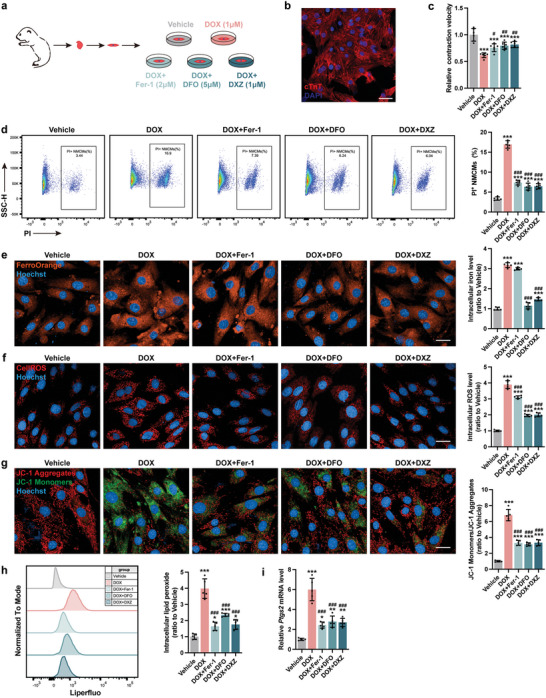
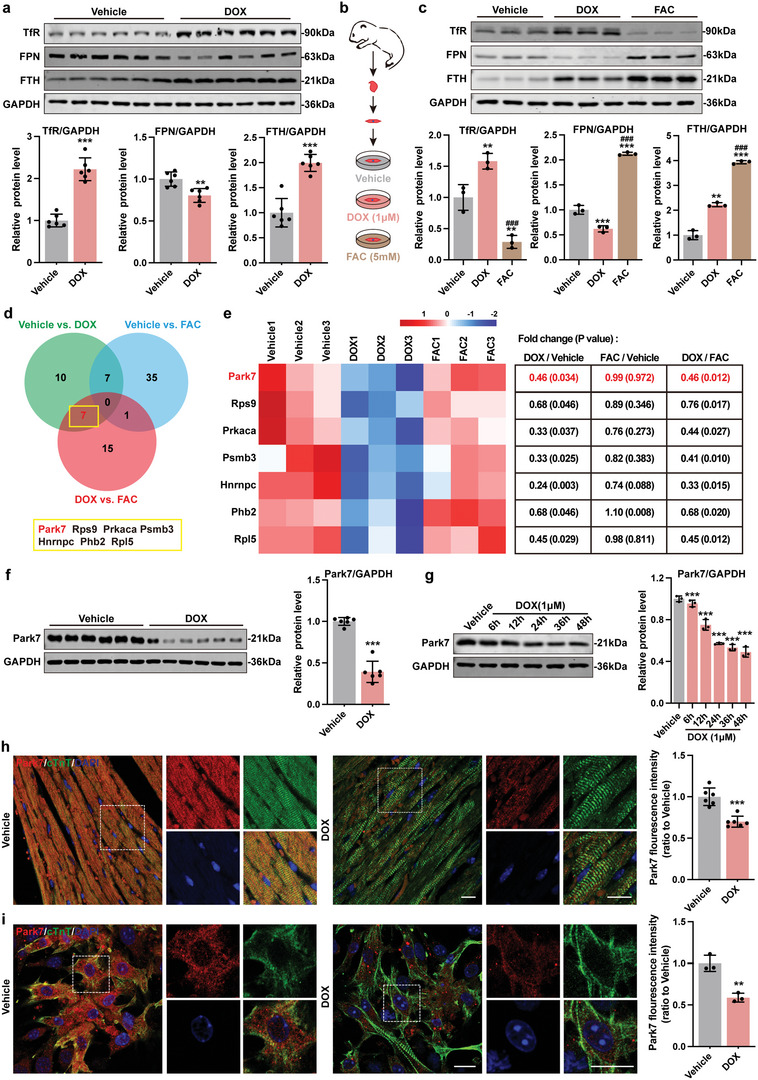
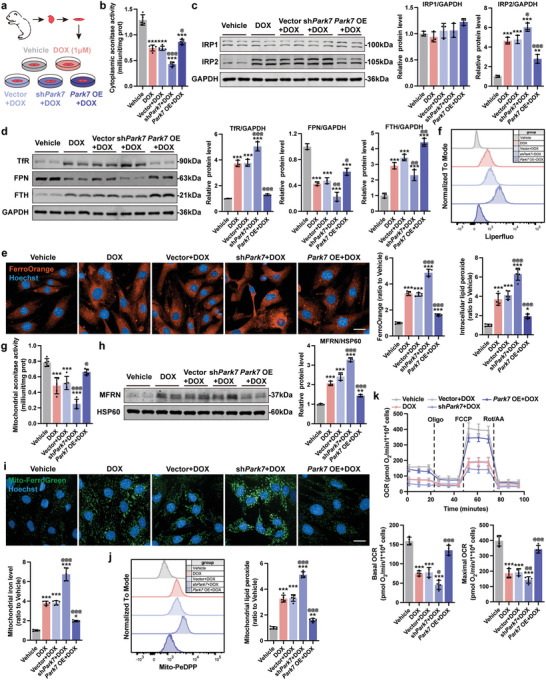
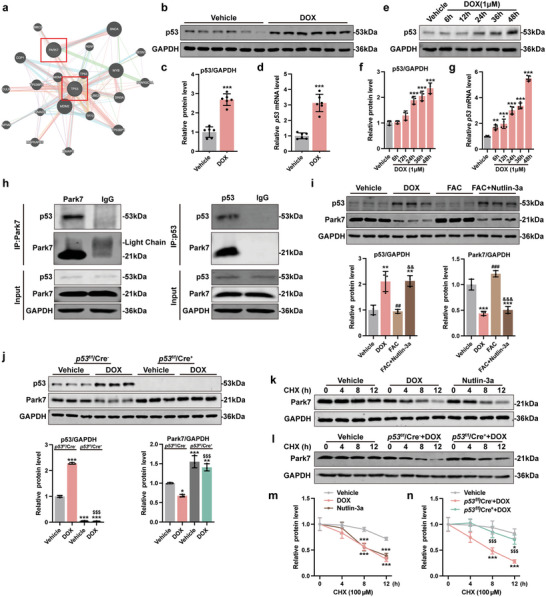
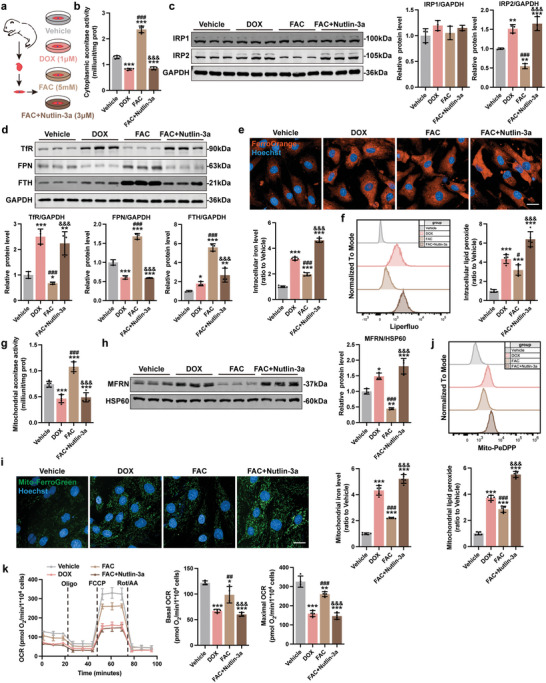
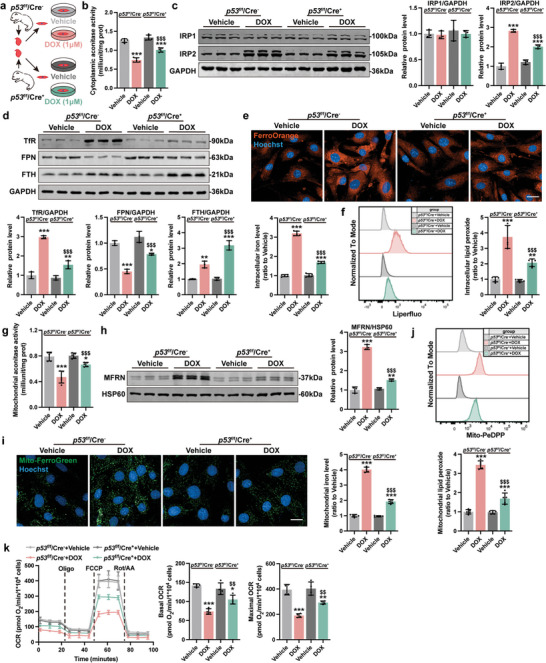
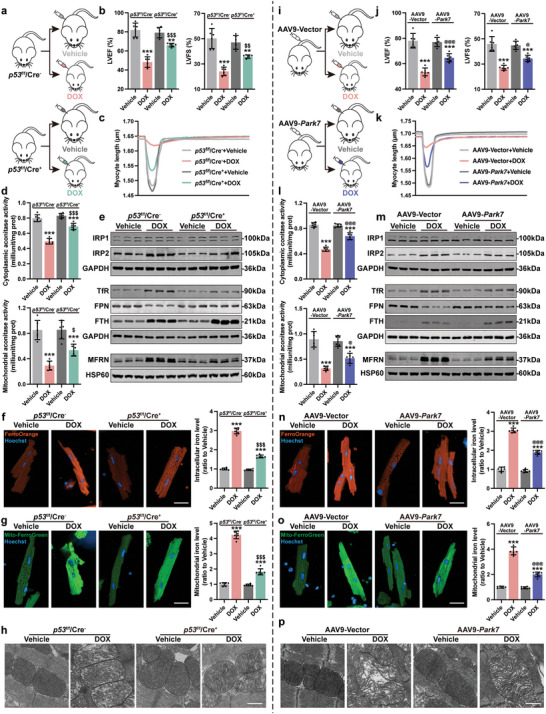
Doxorubicin (DOX)-induced cardiotoxicity (DoIC) is a major side effect for cancer patients. Recently, ferroptosis, triggered by iron overload, is demonstrated to play a role in DoIC. How iron homeostasis is dysregulated in DoIC remains to be elucidated. Here, the authors demonstrate that DOX challenge exhibits reduced contractile function and induction of ferroptosis-related phenotype in cardiomyocytes, evidenced by iron overload, lipid peroxide accumulation, and mitochondrial dysfunction. Compared to Ferric ammonium citrate (FAC) induced secondary iron overload, DOX-challenged cardiomyocytes show a dysfunction of iron homeostasis, with decreased cytoplasmic and mitochondrial iron-sulfur (FeS) cluster-mediated aconitase activity and abnormal expression of iron homeostasis-related proteins. Mechanistically, mass spectrometry analysis identified DOX-treatment induces p53-dependent degradation of Parkinsonism associated deglycase (Park7) which results in iron homeostasis dysregulation. Park7 counteracts iron overload by regulating iron regulatory protein family transcription while blocking mitochondrial iron uptake. Knockout of p53 or overexpression of Park7 in cardiomyocytes remarkably restores the activity of FeS cluster and iron homeostasis, inhibits ferroptosis, and rescues cardiac function in DOX treated animals. These results demonstrate that the iron homeostasis plays a key role in DoIC ferroptosis. Targeting of the newly identified p53-Park7 signaling axis may provide a new approach to prevent DoIC.

Keywords: FeS cluster; doxorubicin-induced cardiotoxicity; ferroptosis; iron homeostasis; p53-Park7 signaling axis.


Conflict of interest statement

The authors declare no conflict of interest.

Figures

Figure 1
Figure 1
Blocking myocardial ferroptosis significantly alleviates DoIC in vivo. a) Experiment design. A chronic DoIC mouse model was established in C57BL/6J mice, and Fer‐1, DFO, and DXZ were used for anti‐ferroptosis treatment during the DoIC model. All tests and analysis were implemented 2 weeks after the last DOX injection. b) Body weight of mice (n = 10). c) Ratio of heart weight to tibia length (HW/TL; n = 6). d) Representative M‐mode images of transthoracic echocardiography, and quantification of left ventricular ejection fraction (LVEF) and left ventricular fraction shortening (LVFS; n = 6). e) Representative micrographs of isolated AMCMs stained with cTnT (scale bars, 100 µm). f) Representative tracings of sarcomere length of isolated AMCMs using an Ionoptix HTS system, and calculation of basal myocyte length, maximum systolic velocity, maximum diastolic velocity, and percentage of shortening of AMCMs (n = 6). g) Representative micrographs of intracellular iron level (FerroOrange staining), ROS (CellROS staining), lipid peroxide (Liperfluo staining), and mitochondrial membrane potential (TMRM staining) in AMCMs (scale bars, 20 µm), and the quantitative analysis of the fluorescence intensities were shown in (h–k) (n = 6). l) Representative micrographs of heart tissues examined by transmission electron micrographs (scale bars, 500 nm). The data are expressed as mean ± SD and analyzed using one‐way ANOVA followed by Tukey's post hoc test, *p < 0.05, **p < 0.01, and ***p < 0.001 versus Vehicle group; #p < 0.05, ##p < 0.01, and ###p < 0.001 versus DOX group.
Figure 2
Figure 2
Blocking myocardial ferroptosis significantly alleviates DoIC in vitro. a) Experiment design for DoIC in neonatal murine cardiomyocytes (NMCMs) and Fer‐1, DFO, and DXZ were used for anti‐ferroptosis treatment prior to DOX challenge. b) Representative micrographs of isolated neonatal murine cardiomyocytes (NMCMs) stained with cTnT (scale bars, 50 µm). c) Contractile velocity of NMCMs extrapolated from live cell imaging (n = 6). d) The percentage of PI+ NMCMs were calculated using flow cytometry (n = 5). e) Representative micrographs and quantification of intracellular iron level (FerroOrange staining) in NMCMs (scale bars, 20 µm; n = 5). f) Representative micrographs and quantification of intracellular ROS (CellROS staining) in NMCMs (scale bars, 20 µm; n = 5). g) Representative micrographs and quantification of mitochondrial membrane potential (JC‐1 staining) in NMCMs (scale bars, 20 µm; n = 5). h) Quantification of intracellular lipid peroxide in NMCMs by flow cytometry (n = 5). i) Ptgs2 mRNA expression in NMCMs (n = 5). The data are expressed as mean ± SD and analyzed using one‐way ANOVA followed by Tukey's post hoc test, *p < 0.05, **p < 0.01, and ***p < 0.001 versus Vehicle group; #p < 0.05, ##p < 0.01, and ###p < 0.001 versus DOX group.
Figure 3
Figure 3
DOX impairs iron homeostasis in cardiomyocytes and can be associated with downregulation of Park7. a) Representative immunoblots and quantitative analysis of iron homeostasis–related proteins in AMCMs from chronic mice DoIC model (n = 6). b) Experiment design for DoIC and FAC based iron overload model in NMCMs. c) Representative immunoblots and quantitative analysis of iron homeostasis–related proteins in NMCMs (n = 3). d) Venn analysis of differentially expressed proteins in NMCMs (Proteins of a 1.2‐fold change (≥1.2 or ≤0.83) of Coverage with P < 0.05 cutoff). e) Heatmap and the specific fold change and P‐value of DOX‐dysregulated proteins. f) Representative blots and quantitative analysis of Park7 protein level in AMCMs from chronic mice DoIC model (n = 6). g) Representative immunoblots and quantitative analysis of Park7 protein level in NMCMs treated with 1 µm DOX in different times (n = 3). h) Representative micrographs and quantitative analysis of Park7 protein level in heart tissues from chronic mice DoIC model detected using immunofluorescent staining (scale bars, 20 µm; n = 6). i) Representative micrographs and quantitative analysis of Park7 protein level in NMCMs after DOX (1 µm, 24 h) treated detected using immunofluorescent staining (scale bars, 30 µm; n = 3). The data are expressed as mean ± SD and analyzed using Student's t‐test or one‐way ANOVA followed by Tukey's post hoc test. *p < 0.05, **p < 0.01, and ***p < 0.001 versus Vehicle group; #p < 0.05, ##p < 0.01, and ###p < 0.001 versus DOX group.
Figure 4
Figure 4
DOX‐induced downregulation of Park7 results in loss of iron clearance and promotes mitochondrial iron overload in cardiomyocytes. a) Experiment design for downregulation or overexpression of Park7 in NMCMs prior to DOX (1 µm, 24 h) challenge. b) The cellular aconitase activity in NMCMs (n = 5). c) Representative immunoblots and quantitative analysis of IRP1 and IRP2 protein level in NMCMs (n = 3). d) Representative immunoblots and quantitative analysis of iron homeostasis–related proteins in NMCMs (n = 3). e) Representative micrographs and quantification of intracellular iron level (FerroOrange staining) in NMCMs (scale bars, 20 µm; n = 5). f) Quantification of intracellular lipid peroxide in NMCMs by flow cytometry (n = 5). g) The mitochondrial aconitase activity in NMCMs (n = 5). h) Representative immunoblots and quantitative analysis of MFRN protein level in mitochondria of NMCMs (n = 3). i) Representative micrographs and quantification of mitochondrial iron level (Mito‐FerroGreen staining) in NMCMs (scale bars, 20 µm; n = 5). j) Quantification of mitochondrial lipid peroxide in NMCMs by flow cytometry (n = 5). k) Real‐time oxygen consumption rates (OCR) and calculated basal and maximal respiration rates in NMCMs (n = 4). The data are expressed as mean ± SD and analyzed using one‐way ANOVA followed by Tukey's post hoc test, *p < 0.05, **p < 0.01, and ***p < 0.001 versus Vehicle group; @p < 0.05, @@p < 0.01, and @@@p < 0.001 versus Vector+DOX group.
Figure 5
Figure 5
p53 is responsible for DOX‐induced downregulation of Park7. a) Protein interaction prediction of Park7 and p53 in GeneMANIA. b,c) Representative immunoblots and quantitative analysis of p53 protein level in AMCMs from chronic mice DoIC model (n = 6). d) p53 mRNA expression level in AMCMs from chronic mice DoIC model (n = 6). e,f) Representative immunoblots and quantitative analysis of p53 protein level in NMCMs treated with 1 µm DOX in different times (n = 3). g) p53 mRNA expression level in NMCMs treated with 1 µm DOX in different times (n = 5). h) Coimmunoprecipitation was performed to determine the interaction between endogenous Park7 and p53 in NMCMs. i) Representative immunoblots and quantitative analysis of Park7 and p53 protein level in NMCMs treated with DOX, FAC, or FAC plus Nutlin‐3a (n = 3). j) Representative immunoblots and quantitative analysis of Park7 and p53 protein level in NMCMs isolated from p53f/f/Cre and p53f/f/Cre+ mice (n = 3). k) Representative immunoblots of Park7 protein level in NMCMs treated with DOX or Nutlin‐3a followed by a time‐dependent CHX treatment. The quantitative analysis was shown in (m) (n = 3). l) Representative immunoblots of Park7 protein level in NMCMs isolated from p53f/f/Cre and p53f/f/Cre+ mice treated with DOX followed by a time‐dependent CHX treatment. The quantitative analysis was shown in (n) (n = 3). The data are expressed as mean ± SD and analyzed using Student's t‐test or one‐way ANOVA followed by Tukey's post hoc test, *p < 0.05, **p < 0.01, and ***p < 0.001 versus Vehicle group; #p < 0.05, ##p < 0.01, and ###p < 0.001 versus DOX group; &&&p < 0.001 versus FAC group; $$$p < 0.001 versus p53f/f/Cre+DOX group.
Figure 6
Figure 6
p53 activation recapitulates ferroptosis phenotype in FAC‐treated NMCMs. a) Experiment design for p53 activation using Nutlin‐3a in FAC treated NMCMs. b) The cellular aconitase activity in NMCMs (n = 5). c) Representative immunoblots and quantitative analysis of IRP1 and IRP2 protein level in NMCMs (n = 3). d) Representative immunoblots and quantitative analysis of iron homeostasis–related proteins in NMCMs (n = 3). e) Representative micrographs and quantification of intracellular iron level (FerroOrange staining) in NMCMs (scale bars, 20 µm; n = 5). f) Quantification of intracellular lipid peroxide in NMCMs by flow cytometry (n = 5). g) The mitochondrial aconitase activity in NMCMs (n = 5). h) Representative immunoblots and quantitative analysis of MFRN protein level in mitochondria of NMCMs (n = 3). i) Representative micrographs and quantification of mitochondrial iron level (Mito‐FerroGreen staining) in NMCMs (scale bars, 20 µm; n = 5). j) Quantification of mitochondrial lipid peroxide in NMCMs by flow cytometry (n = 5). k) Real‐time oxygen consumption rates (OCR) and calculated basal and maximal respiration rates in NMCMs (n = 4). The data are expressed as mean ± SD and analyzed using one‐way ANOVA followed by Tukey's post hoc test, *p < 0.05, **p < 0.01, and ***p < 0.001 versus Vehicle group; #p < 0.05, ##p < 0.01, and ###p < 0.001 versus DOX group; &&&p < 0.001 versus FAC group.
Figure 7
Figure 7
Knockout of p53 ameliorated DOX‐induced iron homeostasis dysfunction and ferroptosis in NMCMs. a) Experiment design for DOX treatment (1 µm, 24 h) in NMCMs isolated from p53f/f/Cre and p53f/f/Cre+ mice. b) The cellular aconitase activity in NMCMs (n = 5). c) Representative immunoblots and quantitative analysis of IRP1 and IRP2 protein level in NMCMs (n = 3). d) Representative immunoblots and quantitative analysis of iron homeostasis–related proteins in NMCMs (n = 3). e) Representative micrographs and quantification of intracellular iron level (FerroOrange staining) in NMCMs (scale bars, 20 µm; n = 5). f) Quantification of intracellular lipid peroxide in NMCMs by flow cytometry (n = 5). g) The mitochondrial aconitase activity in NMCMs (n = 5). h) Representative immunoblots and quantitative analysis of MFRN protein level in mitochondria of NMCMs (n = 3). i) Representative micrographs and quantification of mitochondrial iron level (Mito‐FerroGreen staining) in NMCMs (scale bars, 20 µm; n = 5). j) Quantification of mitochondrial lipid peroxide in NMCMs by flow cytometry (n = 5). k) Real‐time oxygen consumption rates (OCR) and calculated basal and maximal respiration rates in NMCMs (n = 4). The data are expressed as mean ± SD and analyzed using one‐way ANOVA followed by Tukey's post hoc test. *p < 0.05, **p < 0.01, and ***p < 0.001 versus Vehicle group; $p < 0.05, $$p < 0.01, and $$$p < 0.001 versus p53f/f/Cre+DOX group.
Figure 8
Figure 8
Park7 restoration alleviates DOX induced myocardial ferroptosis in mice. a,i) Experiment design for chronic DoIC mouse model established in p53 CKO and Park7 OE mice. b,j) Quantification of LVEF and LVFS measured from M‐mode transthoracic echocardiography (n = 6). c,k) Representative tracings of sarcomere length tracing of isolated AMCMs using an Ionoptix HTS system. d,l) The cellular and mitochondrial aconitase activity in AMCMs (n = 6). e,m) Representative immunoblots of cellular and mitochondrial iron homeostasis–related proteins in AMCMs. f,n) Representative micrographs and quantification of intracellular iron level (FerroOrange staining) in AMCMs (scale bars, 20 µm, n = 6). g,o) Representative micrographs and quantification of mitochondrial iron level (Mito‐FerroGreen staining) in AMCMs (scale bars, 20 µm, n = 6). h,p) Representative micrographs of heart tissues examined by transmission electron micrographs (scale bars, 500 nm). The data are expressed as mean ± SD and analyzed using one‐way ANOVA followed by Tukey's post hoc test, **p < 0.01 and ***p < 0.001 versus Vehicle group; $p < 0.05, $$p < 0.01, and $$$p < 0.001 versus p53f/f/Cre+DOX group; @p < 0.05 and @@@p < 0.001 versus AAV9‐Vector+DOX group.

Similar articles

Cited by

References

    1. Miller K. D., Nogueira L., Devasia T., Mariotto A. B., Yabroff K. R., Jemal A., Kramer J., Siegel R. L., Ca‐Cancer J. Clin. 2022, 72, 409. - PubMed
    1. Chang H.‐M., Moudgil R., Scarabelli T., Okwuosa T. M., Yeh E. T. H., J. Am. Coll. Cardiol. 2017, 70, 2536. - PMC - PubMed
    1. Sturgeon K. M., Deng L., Bluethmann S. M., Zhou S., Trifiletti D. M., Jiang C., Kelly S. P., Zaorsky N. G., Eur. Heart J. 2019, 40, 3889. - PMC - PubMed
    1. Sawicki K. T., Sala V., Prever L., Hirsch E., Ardehali H., Ghigo A., Annu. Rev. Pharmacol. Toxicol. 2021, 61, 309. - PubMed
    1. Swain S. M., Whaley F. S., Ewer M. S., Cancer 2003, 97, 2869. - PubMed

Publication types

LinkOut - more resources