Validation of Doi's weighted average glucose as a measure of post-load glucose excursion for clinical use
- PMID: 36967663
- PMCID: PMC10494857
- DOI: 10.17305/bb.2022.8807
Validation of Doi's weighted average glucose as a measure of post-load glucose excursion for clinical use
Abstract
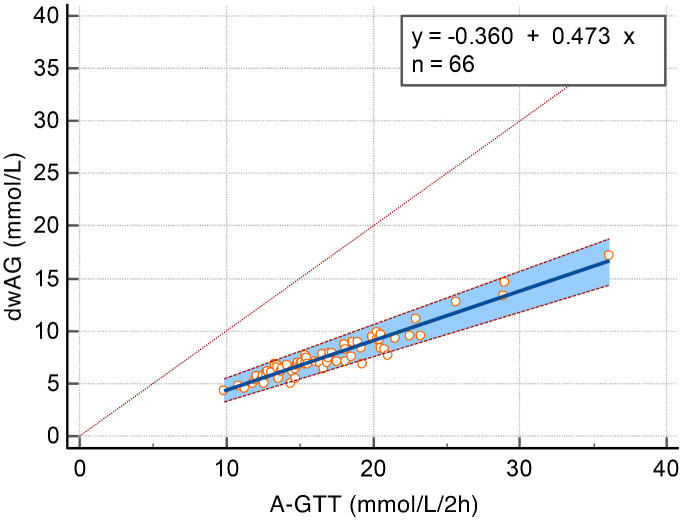
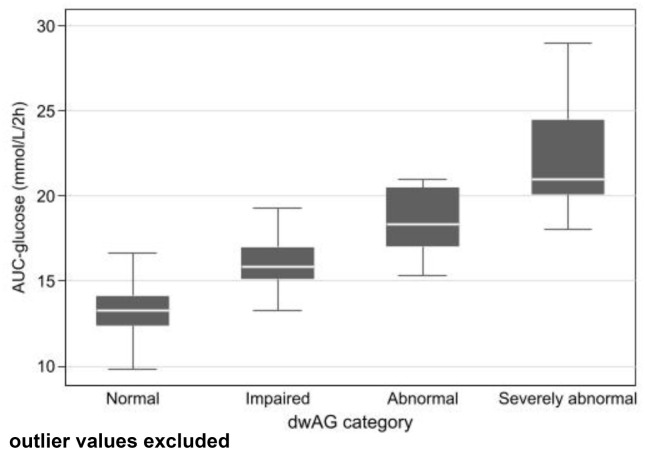
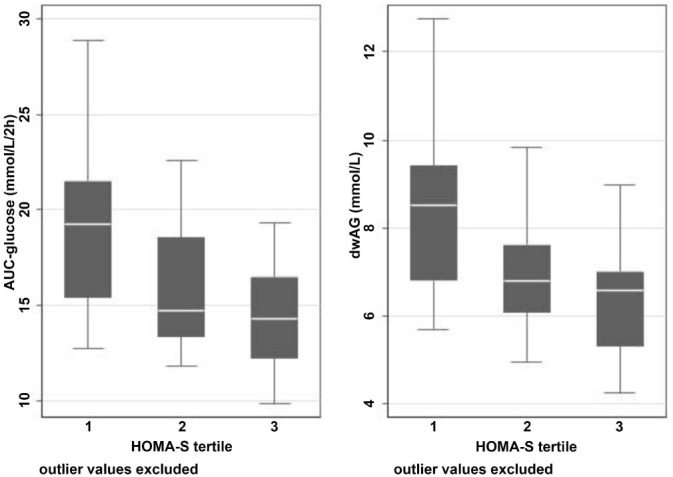
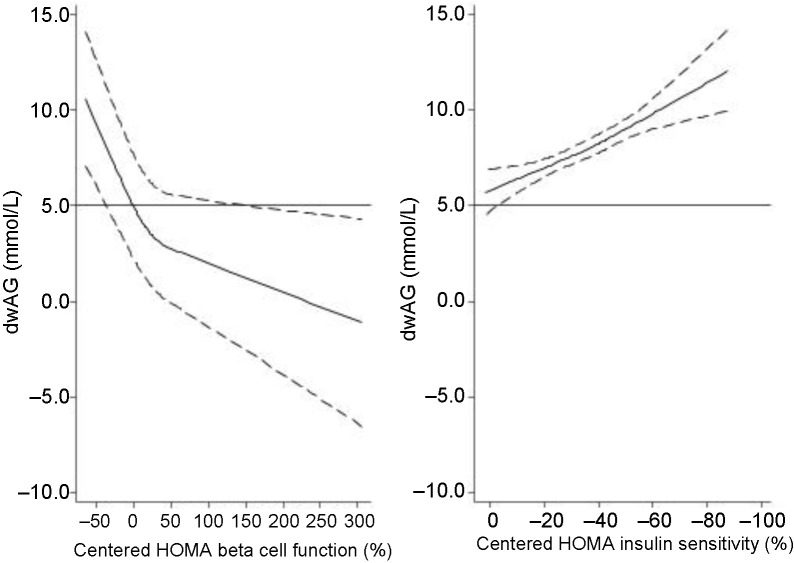
In this study, we examined the performance of a novel index of glucose excursion (Doi's weighted average glucose [dwAG]) in relation to the conventional measure of area under the oral glucose tolerance test (A-GTT) and the homeostatic model assessment for insulin sensitivity (HOMA-S) and pancreatic beta cell function (HOMA-B). A cross-sectional comparison of the new index was conducted using 66 oral glucose tolerance tests (GTTs) performed at different follow-up times among 27 participants who had undergone surgical subcutaneous fat removal (SSFR). Comparisons across categories were made using box plots and the Kruskal-Wallis one-way ANOVA on ranks. Passing-Bablok regression was used to compare the dwAG against the conventional A-GTT. The Passing-Bablok regression model suggested a cutoff for normality for the A-GTT of 15.14 mmol/L·2h-1 compared to the dwAG's suggested threshold of 6.8 mmol/L. For every 1 mmol/L·2h-1 increase in A-GTT, the dwAG value increased by 0.473 mmol/L. The glucose area under the curve correlated well with the four defined dwAG categories, with at least one of the categories having a different median A-GTT value (KW Chi2 = 52.8 [df = 3], P < 0.001). The HOMA-S tertiles were also associated with significantly different levels of glucose excursion measured through both the dwAG value (KW Chi2 = 11.4 [df = 2], P = 0.003) and A-GTT measure (KW Chi2 = 13.1 [df = 2], P = 0.001). It is concluded that the dwAG value and categories serve as a simple and accurate tool that can be used for interpreting glucose homeostasis across clinical settings.
Conflict of interest statement
Conflicts of interest: Authors declare no conflicts of interest.
Figures
References
-
- Saeedi P, Petersohn I, Salpea P, Malanda B, Karuranga S, Unwin N, et al. Global and regional diabetes prevalence estimates for 2019 and projections for 2030 and 2045: results from the international diabetes federation diabetes Atlas, 9th edition. Diabetes Res Clin Pract. 2019;157:107843. https://doi.org/10.1016/j.diabres.2019.107843. - PubMed
-
- Doi SAR, Bashir M, Sheehan MT, Onitilo AA, Chivese T, Ibrahim IM, et al. Unifying the diagnosis of gestational diabetes mellitus: introducing the NPRP criteria. Prim Care Diabetes. 2022;16(1):96–101. https://doi.org/10.1016/j.pcd.2021.08.006. - PubMed
-
- Inzucchi SE. Clinical practice. Diagnosis of diabetes. N Engl J Med. 2012;367(6):542–50. https://doi.org/10.1056/NEJMcp1103643. - PubMed
-
- Perry RC, Baron AD. Impaired glucose tolerance. Why is it not a disease? Diabetes Care. 1999;22(6):883–5. https://doi.org/10.2337/diacare.22.6.883. - PubMed
-
- Tai MM. A mathematical model for the determination of total area under glucose tolerance and other metabolic curves. Diabetes Care. 1994;17(2):152–4. https://doi.org/10.2337/diacare.17.2.152. - PubMed
MeSH terms
Substances
LinkOut - more resources
Full Text Sources
Miscellaneous