. 2023 Mar 7;26(4):106349.
doi: 10.1016/j.isci.2023.106349. eCollection 2023 Apr 21.

Tissue-specific heteroplasmy segregation is accompanied by a sharp mtDNA decline in Caenorhabditis elegans soma

Affiliations

Tissue-specific heteroplasmy segregation is accompanied by a sharp mtDNA decline in Caenorhabditis elegans soma

Nikita Tsyba et al. iScience. .

Abstract

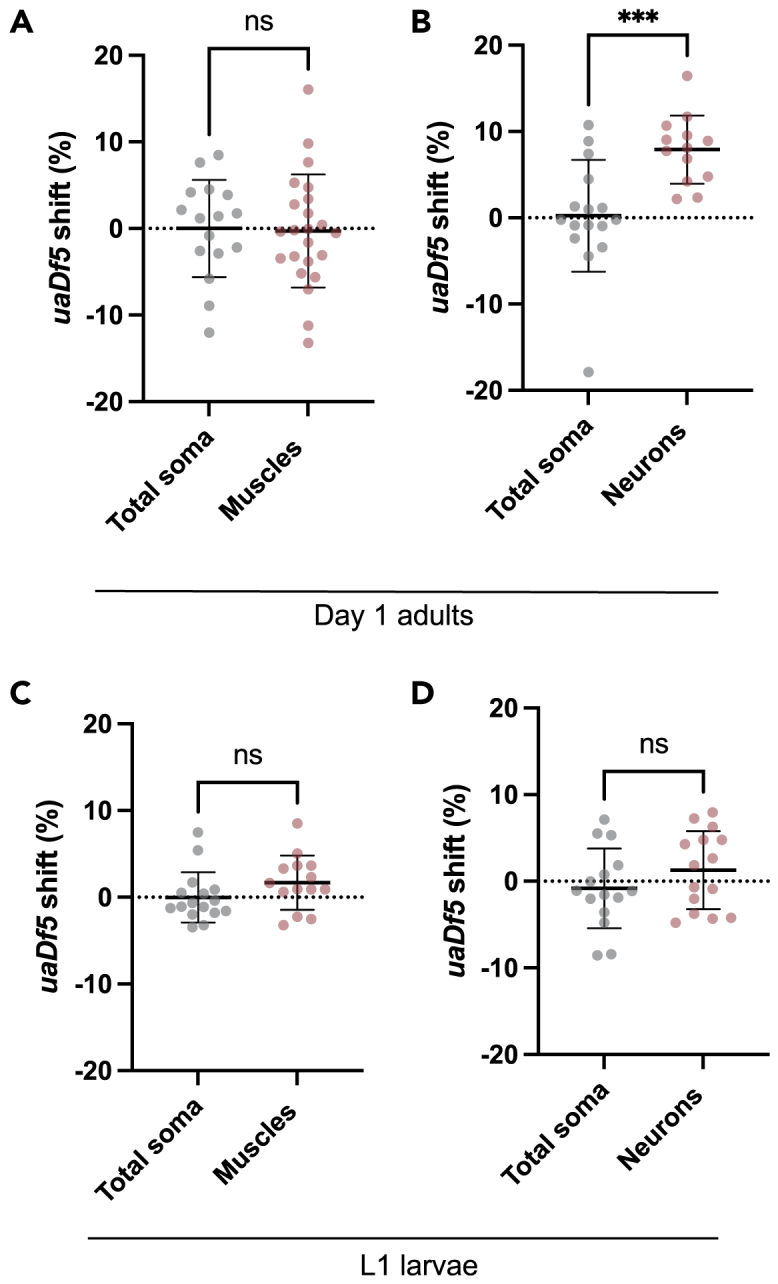
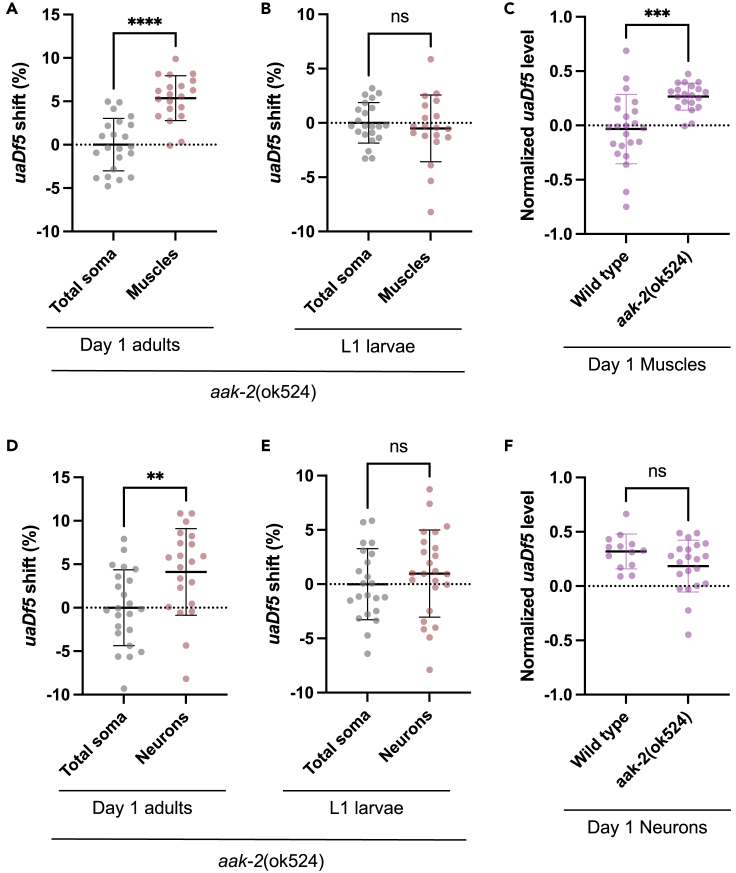
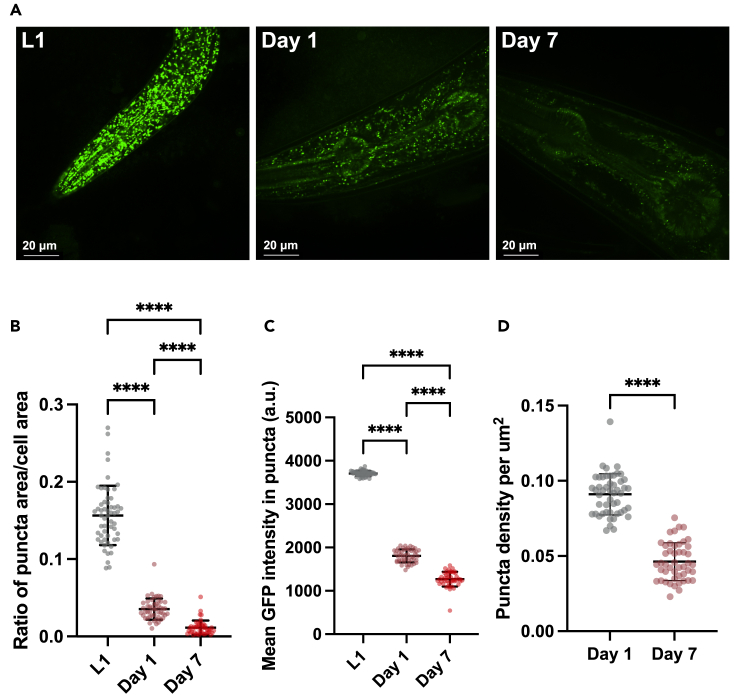
Mutations in the mitochondrial genome (mtDNA) can be pathogenic. Owing to the multi-copy nature of mtDNA, wild-type copies can compensate for the effects of mutant mtDNA. Wild-type copies available for compensation vary depending on the mutant load and the total copy number. Here, we examine both mutant load and copy number in the tissues of Caenorhabditis elegans. We found that neurons, but not muscles, have modestly higher mutant load than rest of the soma. We also uncovered different effect of aak-2 knockout on the mutant load in the two tissues. The most surprising result was a sharp decline in somatic mtDNA content over time. The scale of the copy number decline surpasses the modest shifts in mutant load, suggesting that it may exert a substantial effect on mitochondrial function. In summary, measuring both the copy number and the mutant load provides a more comprehensive view of the mutant mtDNA dynamics.

Keywords: Biological sciences; Cell biology; Molecular biology.


Conflict of interest statement

The authors declare no competing interests.

Figures

None
Graphical abstract
Figure 1
Figure 1
Fluorescent-activated cell sorting coupled to droplet digital PCR allows for tissue specific measurements of mtDNA heteroplasmy levels and copy number (A) Graphical description of the cell isolation protocol: During lysis connective tissues are digested separating worm cells from each other. After that fluorophore-expressing cells are isolated with fluorescence-activated cell sorting (FACS). (B) Overview of the principle behind FACS-based cell isolation: First, cell suspension is obtained after worm lysis enters fluidics system. The system divides cell suspension into droplets containing single cells. After that each cell is probed with a laser beam that measures the cell’s fluorescent signal. Finally, cells are sorted into separate compartments based on their fluorescent signal intensity. (C) FACS plot specifies which cell populations should be isolated, based on their GFP signal intensity. Each dot on the graph represents an individual cell. GFP signal intensity is on the xaxis, whereas side scatter parameter is on the yaxis. On this representative plot we specified GFP positive and GFP negative cell populations. FACS collects the two cell groups into separate compartments so that they can be used in subsequent experiments. (D) FACS enriches for GFP-expressing cells. The representative image on the left shows GFP-expressing cell enrichment in GFP positive population (corresponding to GFP positive gate in Figure 1C). The image on the right shows the lack of GFP positive cells in GFP negative population (corresponding to GFP negative gate in Figure 1C). The cells were cultured for 24 h before imaging. Scale bar size: 50 μm. (E) GFP positive neurons collected with FACS grow processes in cell culture. Representative images demonstrate that FACS collects the correct cell type and that the collected cells are viable after 24 h in cell culture. Scale bar size: 20 μm. (F) Overview of the principle behind droplet digital PCR: First, a sample is partitioned into individual droplets. Low sample concentration ensures that each droplet contains at maximum a single mtDNA molecule. After partitioning independent PCR reactions occur in each individual droplet. Finally, mutant and wild-type-carrying droplets are identified based on their fluorescence intensity. (G) ddPCR fluorescence intensity plot showing the separation between mutant and wild-type-carrying droplets. The plots demonstrate droplets’ signal intensity in two fluorescent channels. Each dot represents an individual droplet carrying a single mtDNA molecule. Droplets carrying mutant mtDNA have higher fluorescence and are labeled with orange color. Wild-type-carrying droplets are labeled blue. The plots demonstrate the separation between mutant and wild-type-carrying droplets in uaDf5 and mptDf2mutant backgrounds (left and right charts, respectively). (H) C. elegans mtDNA map showing the positions of two deletion mutations used in our experiments: uaDf5 and mptDf2. Short arrows indicate the positions of primers used to quantify the heteroplasmy level. Primers located outside of the deletion (green arrows) amplify mutant mtDNA product, but not the wild-type. On the contrary, primers located within the deletion region (blue arrows) only amplify wild-type mtDNA product. The four-primer system allows us to quantify both mutant and wild-type mtDNA within the same reaction.
Figure 2
Figure 2
Neurons, but not muscles, have significantly higher uaDf5level relative to total soma The data are presented as percentage point shifts reflecting the change in the amount of heteroplasmy between the cells of interest and their corresponding control samples (i.e., total soma). The control contains all sortable and viable cells from the same cell population as the tissue of interest. (A)uaDf5 level in muscles relative to its total soma control at Day 1 of adulthood. (B)uaDf5 level in neurons relative to its total soma control at Day 1 of adulthood. (C)uaDf5 level in muscles of L1 larva relative to its total soma control. (D)uaDf5 level in neurons of L1 larva relative to its total soma control. Statistical tests: All comparisons in this figure were made using the Mann-Whitney test. Data are presented as mean ± SD with individual data points shown. ∗∗∗p ≤ 0.001, ns p > 0.05.
Figure 3
Figure 3
Neurons, but not muscles, have significantly higher mptDf2 level relative to total soma (A) mptDf2 levels in muscles relative to its total soma control at Day 1 of adulthood. (B) mptDf2 levels in neurons relative to its total soma control at Day 1 of adulthood. (C) mptDf2 level in muscles of L1 larva relative to its total soma control. (D) mptDf2 level in neurons of L1 larva relative to its total soma control. Statistical tests: All comparisons in this figure were made using the Mann-Whitney test. Data are presented as mean ± SD with individual data points shown. ∗∗∗p ≤ 0.001, ns p > 0.05.
Figure 4
Figure 4
The effect of aak-2knockout on heteroplasmy level in muscles and neurons (A) uaDf5 shift in muscles of aak-2 (ok524) knockout animals relative to total soma control at Day 1 of adulthood. (B) uaDf5 shift in muscles of aak-2 (ok524) knockout animals relative to total soma control at L1 larval stage. (C) The effect of aak-2 knockout on uaDf5 level in muscles in Day 1 adults. The data from wild-type and knockout animals were normalized to their corresponding total soma control to account for heteroplasmy differences between the worm strains. (D) uaDf5 shift in neurons of aak-2 (ok524) knockout animals relative to total soma control in Day 1 adults. (E) uaDf5 shift in neurons of aak-2 (ok524) knockout animals relative to total soma control at L1 larval stage. (F) The effect of aak-2 knockout on uaDf5 level in neurons in Day 1 adults. Statistical tests: All comparisons in this figure were made using the Mann-Whitney test. Data are presented as mean ± SD with individual data points shown. ∗∗p ≤ 0.01, ∗∗∗p ≤ 0.001, ∗∗∗∗p ≤ 0.0001, ns p > 0.05.
Figure 5
Figure 5
mtDNA content decreases sharply during development. The data presented in this figure are from animals carrying uaDf5mutation (A) Schematic to show that total mtDNA copy number can modulate the phenotype of mtDNA mutations. (B) mtDNA content drops sharply in both muscles and neurons between L1 and Day 1 of adulthood. (C) The drop in mtDNA copy number is not restricted to muscles and neurons. It occurs in all sortable somatic cells between L1 and Day 1 time points. (D) Somatic mtDNA content continues to decrease after the first day of adulthood. Statistical tests: All comparisons in this figure were made using the Mann-Whitney test. Data are presented as mean ± SD with individual data points shown. ∗∗∗∗p ≤ 0.0001.
Figure 6
Figure 6
mtDNA copy number decline in not accompanied by a corresponding decrease in mtDNA-encoded transcript levels (A) Change in mtDNA copy number of muscle cells and neurons carrying mptDf2mutation. (B) Change in mtDNA content of all somatic cells carrying mptDf2mutation. (C) The number of ND1 transcripts in all somatic cells at L1 and Day 1 adult time points. The data are normalized to the mean transcript level at L1 stage. (D) The number of COII RNA transcripts in all somatic cells at L1 and Day 1 adult time points. The data are normalized to the mean transcript level at L1 stage. The transcripts data consist of 3 biological replicates, which include 4 technical replicates each. The data points belonging to the same biological replicate are marked with the same color. Three large circles with dark borders indicate the mean values of all data points from the corresponding biological replicate (marked with the same color as their mean value). Statistical tests: Comparisons in panels A and B were made using the Mann-Whitney test. Comparisons in panels C and D were made using the paired t-test (compared datasets have passed normality tests). Data are presented as mean ± SD with individual data points shown. ∗p ≤ 0.05, ∗∗∗∗p ≤ 0.0001.
Figure 7
Figure 7
The mtDNA decline occurs even in wild-type mtDNA background (A) Representative images showing the decline in the number and intensity of mtDNA nucleoid puncta between L1, Day 1 adult and Day 7 adult time points. The nucleoids were identified using fluorescently labeled HMG-5 (strain name: MRP75). Scale bar size: 20 μm. (B) The ratio of puncta area to cell area drops sharply between L1 larval stage and Day 7 of adulthood (Statistical tests used: Kruskal-Wallis ANOVA test, Dunn’s multiple comparisons test). (C) Change in mean GFP intensity of nucleoid puncta between the three time points (Statistical tests used: Kruskal-Wallis ANOVA test, Dunn’s multiple comparisons test). (D) The density of nucleoid puncta declines by Day 7 of adulthood (Statistical test used: Mann-Whitney test). Data are presented as mean ± SD with individual data points shown. ∗∗∗∗p ≤ 0.0001.

References

    1. Gustafsson C.M., Falkenberg M., Larsson N.G. Maintenance and expression of mammalian mitochondrial DNA. Annu. Rev. Biochem. 2016;85:133–160. doi: 10.1146/annurev-biochem-060815-014402. - DOI - PubMed
    1. Wallace D.C., Chalkia D. Mitochondrial DNA genetics and the heteroplasmy conundrum in evolution and disease. Cold Spring Harb. Perspect. Biol. 2013;5:a021220. doi: 10.1101/cshperspect.a021220. - DOI - PMC - PubMed
    1. Robin E.D., Wong R. Mitochondrial DNA molecules and virtual number of mitochondria per cell in mammalian cells. J. Cell. Physiol. 1988;136:507–513. doi: 10.1002/jcp.1041360316. - DOI - PubMed
    1. Veltri K.L., Espiritu M., Singh G. Distinct genomic copy number in mitochondria of different mammalian organs. J. Cell. Physiol. 1990;143:160–164. doi: 10.1002/jcp.1041430122. - DOI - PubMed
    1. Shokolenko I.N., Alexeyev M.F. Mitochondrial DNA: a disposable genome? Biochim. Biophys. Acta. 2015;1852:1805–1809. doi: 10.1016/j.bbadis.2015.05.016. - DOI - PMC - PubMed

LinkOut - more resources