. 2023 Jan 10;3(1):31-42.
doi: 10.1158/2767-9764.CRC-22-0101. eCollection 2023 Jan.

Complex Patterns of Genomic Heterogeneity Identified in 42 Tumor Samples and ctDNA of a Pulmonary Atypical Carcinoid Patient

Affiliations

Complex Patterns of Genomic Heterogeneity Identified in 42 Tumor Samples and ctDNA of a Pulmonary Atypical Carcinoid Patient

Tamsin J Robb et al. Cancer Res Commun. .

Abstract

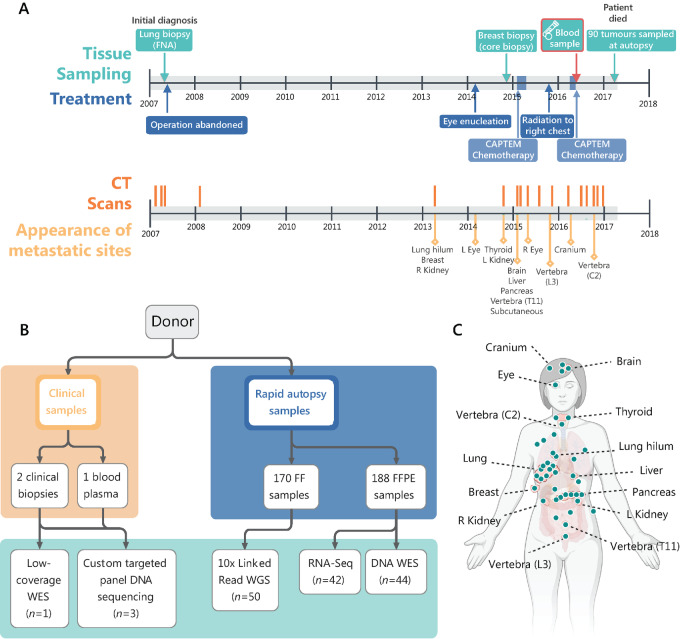
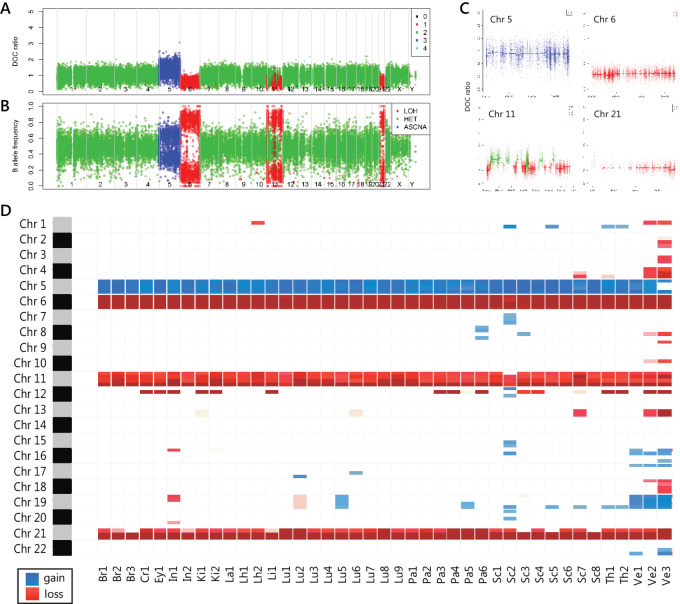
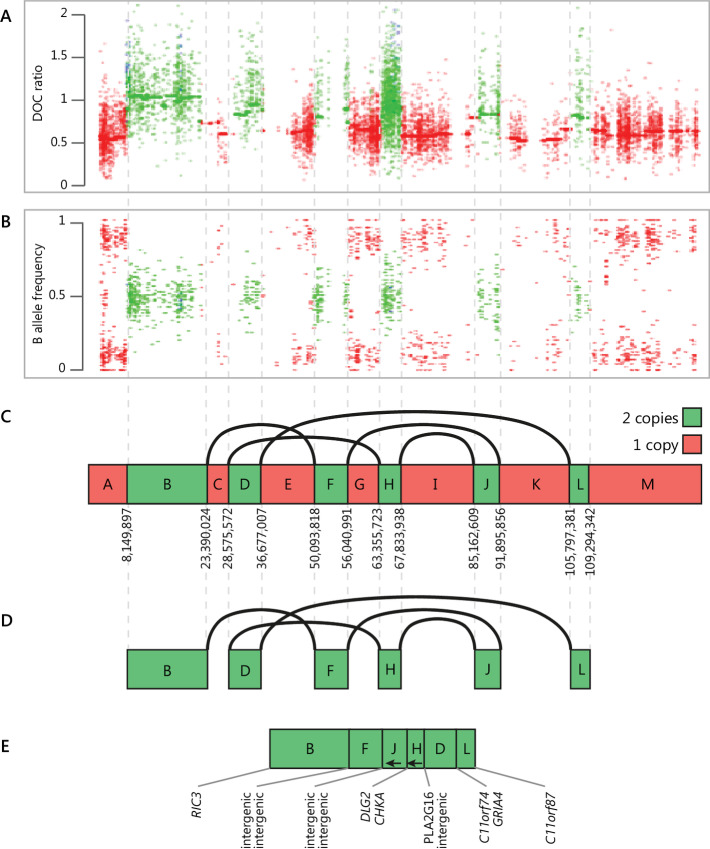
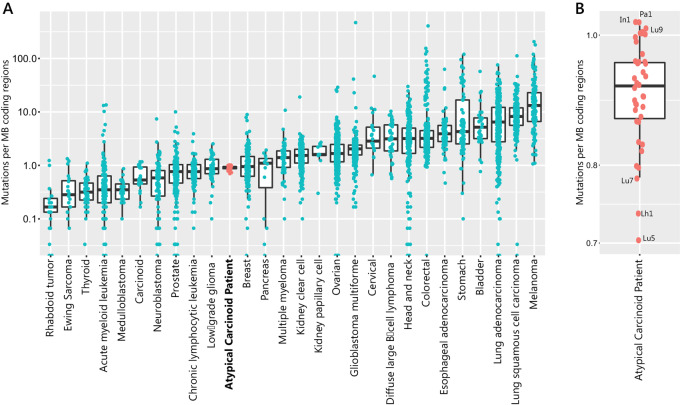
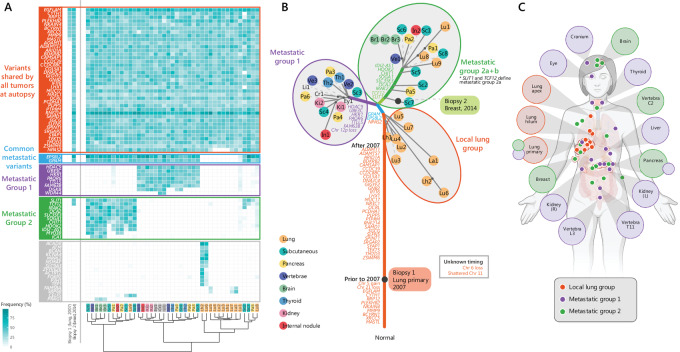
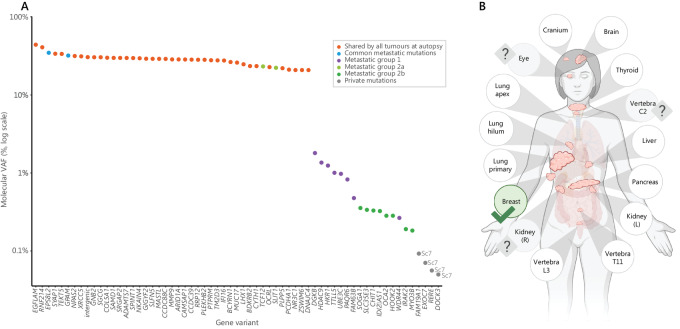
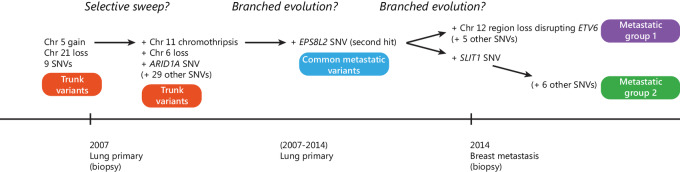
Tumor evolution underlies many challenges facing precision oncology, and improving our understanding has the potential to improve clinical care. This study represents a rare opportunity to study tumor heterogeneity and evolution in a patient with an understudied cancer type. A patient with pulmonary atypical carcinoid, a neuroendocrine tumor, metastatic to 90 sites, requested and consented to donate tissues for research. 42 tumor samples collected at rapid autopsy from 14 anatomically distinct sites were analyzed through DNA whole-exome sequencing and RNA sequencing, and five analyzed through linked-read sequencing. Targeted DNA sequencing was completed on two clinical tissue biopsies and one blood plasma sample. Chromosomal alterations and gene variants accumulated over time, and specific chromosomal alterations preceded the single predicted gene driver variant (ARID1A). At the time of autopsy, all sites shared the gain of one copy of Chr 5, loss of one copy of Chr 6 and 21, chromothripsis of one copy of Chr 11, and 39 small variants. Two tumor clones (carrying additional variants) were detected at metastatic sites, and occasionally in different regions of the same organ (e.g., within the pancreas). Circulating tumor DNA (ctDNA) sequencing detected shared tumor variants in the blood plasma and captured marked genomic heterogeneity, including all metastatic clones but few private tumor variants. This study describes genomic tumor evolution and dissemination of a pulmonary atypical carcinoid donated by a single generous patient. It highlights the critical role of chromosomal alterations in tumor initiation and explores the potential of ctDNA analysis to represent genomically heterogeneous disease.

Significance: DNA sequencing data from tumor samples and blood plasma from a single patient highlighted the critical early role of chromosomal alterations in atypical carcinoid tumor development. Common tumor variants were readily detected in the blood plasma, unlike emerging tumor variants, which has implications for using ctDNA to capture cancer evolution.


Conflict of interest statement

No disclosures were reported.

Figures

FIGURE 1
FIGURE 1
Clinical summary and overview of tissue samples included in this study. A, Timeline of tissue sampling, treatments, imaging, and appearance of metastatic sites. Top panel shows tissue sampling (turquoise, including biopsies taken as part of clinical care, blood sample, and autopsy sampling) and treatment (blue). Bottom panel displays dates of CT scans (orange) and details the first appearance of metastatic sites within those CT scans (yellow). Arterial involvement meant that the cancer was not resectable at initial diagnosis. There was minimal clinical follow-up for 7 years after initial diagnosis. After presenting with reduced vision in her left eye, caused by a metastasis, CT scans showed marked growth of the lung primary and metastases to thyroid, kidney, and breast. A year later, further lesions were detected in the brain, kidney, liver, pancreas, and numerous subcutaneous sites. Capecitabine-temozolomide (CAPTEM) combination chemotherapy was administered, stabilizing growth in most lesions, alongside a short course of radiotherapy to the hilum of her right lung. In 2016, she began losing sight in her remaining right eye, with further progression of the brain lesion noted on CT imaging. Further chemotherapy was administered with a clinical response. The patient died in April 2017, and the rapid research autopsy was completed within hours of her death. B, Clinical and autopsy samples collected and their downstream genomic data applications. C, Locations of the 41 metastatic sites sampled at autopsy that were included in this study. Further samples not labeled were located within the subcutaneous tissue. Figure 1C created with BioRender.
FIGURE 2
FIGURE 2
Most chromosomal alterations are shared by all tumors. ADTEx copy-number profile of representative tumor sample Lu2 (lung primary) showing the chromosomal alterations shared by all tumors. A, Normalized depth of coverage (DOC) ratio between tumor and normal samples at SNVs for all chromosomes, separated by vertical lines. Color represents predicted copy number—red = 1 copy (loss), green = 2 copies (diploid), blue = 3 copies (gain). B, B-allele frequency (BAF) of SNVs. The BAF of SNVs on Chr 5 fall around 0.33 and 0.66, in line with the gain of one copy of Chr 5. BAF approach 1 and 0 in regions of Chr 6, 11, and 21, where one copy is lost. Abbreviations in key to right: LOH, loss of heterozygosity; HET, diploid heterozygous; ASCNA, allele-specific copy-number amplifications. C, Normalized DOC ratio for all chromosomes where shared chromosomal alterations were predicted in all tumors: Chr 5 gain, Chr 6 loss, oscillating pattern in Chr 11 with alternate regions lost, and Chr 21 loss. D, CNVs summarized across whole tumor cohort, with data summarized at the half arm level, showing common alterations to Chrs 5, 6, 11, and 21. Increased predicted CNVs in vertebral samples (Ve1,2,3) were likely related to poor-quality DNA resulting from decalcification.
FIGURE 3
FIGURE 3
Chromothripsis of Chr 11 determined by 10× linked-read WGS. The rearranged chromosome contains two copy-number states (regions in red are lost while remaining green regions are “stitched together” in a different order). A and B, WES-based normalized DOC ratio and BAF from ADTEx, of insufficient resolution to resolve structural complexities. C, Precise chromosomal breakpoints identified using linked-read WGS with inferred copy number of each region. D, The altered Chr 11 results from five breakpoint joining events. E, Altered Chr 11, indicating the inversion of two regions (J and H, indicated with arrows) and deletion of the regions A, C, E, G, I, K, and M. The genes at each breakpoint boundary are indicated below the chromosome. The wild-type copy of Chr 11, which contributes to A–C is not shown in D and E, which illustrate only the altered copy.
FIGURE 4
FIGURE 4
Overall mutational burden is low compared with other tumor types. A, TMB in lung NET patient tumors sampled at autopsy (pink) compared with other cancer types analyzed in Lawrence and colleagues 2013 (29). Y-axis is on a log scale (mutations per MB). B, Expanded diagram showing TMB across tumors collected at autopsy from atypical carcinoid patient, with highest and lowest three tumors labeled. Y-axis is on a linear scale.
FIGURE 5
FIGURE 5
Genomic similarity of tumors around the patient's body. A, Variant allele frequency (VAF) of variants present in two or more samples. Variants are named by gene, presented in rows, with all variants regardless of pathogenicity or protein effect presented. Tumors are presented in columns, with clinical biopsy samples on the left (biopsy 1, collected from lung primary at first diagnosis in 2007, and biopsy 2, collected from breast metastasis in 2014) and samples collected at autopsy on the right (colored by organ, key to right). Boxes are shaded according to VAF (key bottom left). Bottom panel features Ward's hierarchical clustering dendrogram grouping similar tumors (Euclidean distance). Variants are grouped into blocks based on the tumors carrying each variant, with coloring consistent across figures. SLIT1 and TCF12 variants in metastatic group 2 are present in more samples than the remainder, so are defined as metastatic group 2a in Fig. 6. B, DNA phylogram of clinical biopsies alongside tumors sampled at autopsy, with branch length proportional to the number of shared small variants, constructed in IQ-TREE (31) using the K2P substitution model. Small variants and chromosomal alterations are annotated on the branches. Sample coloring indicates major anatomic locations (key to left, shared with A). Gray ovals group samples into three major tumor groups based on variant profiles. While the order of accumulation of groups of variants can be inferred from this analysis, it does not suggest the accumulation order within groups. Dotted lines are used in some cases to indicate the position of tumors and ensure all labels are readable. Large black dots indicate the placement of biopsy samples. Shared small variants and copy-number changes are placed according to presence or absence in Biopsy 1. The patterns of relatedness derived from the small variant data were consistent with the patterns in chromosomal variants; however, alone they do not provide the fine-grained separation visible from the small variants. C, Anatomic location of genomic groups. Colored circles overlaid on body represent tumor sampling sites colored according to the genomic group(s) present. Tumors are labeled and shaded according to dominant genomic group(s). Unlabeled sites were located in subcutaneous tissue. Figure 5C created with BioRender.
FIGURE 6
FIGURE 6
Origins of detected ctDNA. A, Molecular VAF of tumor variants detected in the blood plasma. Variants are colored by their “shared” status (consistent with Fig. 5, key to right). Molecular VAF (%) is plotted on a log scale. Private variants are labeled with the sample name. Variants shared by all tumors are detected at the highest molecular VAF. B, Ability to detect ctDNA from different organ sites based on the detection of one or more private variants in ctDNA with more than three variant molecules, indicated with green tick. Three tumors did not carry any private variants, so we were unable to uniquely determine whether they shed ctDNA into the blood plasma using this assay (eye, vertebra C2 and right kidney, indicated with question marks). The only private variants detected were derived from a large subcutaneous breast sample Sc7. Figure 6B created with BioRender.
FIGURE 7
FIGURE 7
Hypothetical somatic driver variant accumulation over time and space based on the genomic data. A selective sweep may have occurred to sweep to fixation the variants found in every tumor sample sequenced at autopsy, but not present in the initial lung tumor biopsy. Branching events likely occurred subsequently to generate the tumor heterogeneity detected in the tumors sequenced at autopsy.

References

    1. Maggard MA, O'Connell JB, Ko CY. Updated population-based review of carcinoid tumors. Ann Surg 2004;240:117–22. - PMC - PubMed
    1. De Dosso S, Bajetta E, Procopio G, Cortinovis D, Buzzoni R, Catena L, et al. . Pulmonary carcinoid tumours: indolent but not benign. Oncology 2007;73:162–8. - PubMed
    1. Parker K, Coats E, Woodhouse B, Knowlton N, Schiedel O, Carroll R, et al. . The NETwork! registry: preliminary data suggests increasing incidence in a national study of neuroendocrine cancer in New Zealand (NZ). New Zealand Society Oncology; 2017; Auckland, New Zealand.
    1. Kahu TAT. He Pūrongo Mate Pukupuku o Aotearoa 2020, The State of Cancer in New Zealand 2020. Wellington: Te Aho o Te Kahu, Cancer Control Agency; 2021.
    1. Steuer CE, Behera M, Kim S, Chen Z, Saba NF, Pillai RN, et al. . Atypical carcinoid tumor of the lung: a surveillance, epidemiology, and end results database analysis. J Thorac Oncol 2015;10:479–85. - PubMed

Publication types

Substances