. 2023 Jan 12;3(1):54-65.
doi: 10.1158/2767-9764.CRC-22-0302. eCollection 2023 Jan.

Misaligned Chromosomes are a Major Source of Chromosomal Instability in Breast Cancer

Affiliations

Misaligned Chromosomes are a Major Source of Chromosomal Instability in Breast Cancer

John B Tucker et al. Cancer Res Commun. .

Abstract

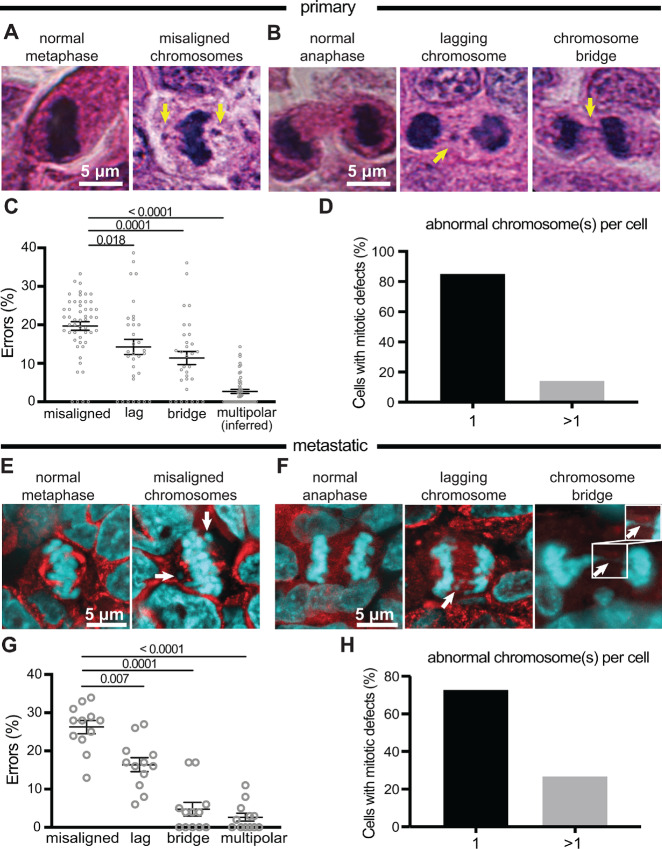
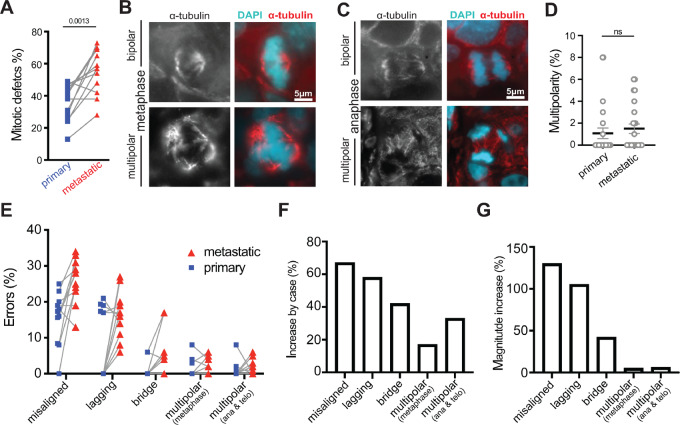
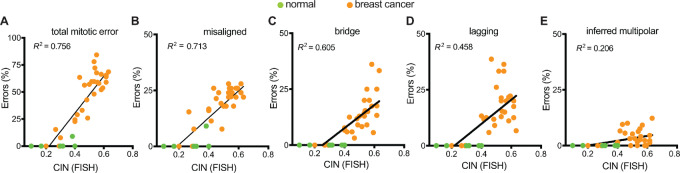
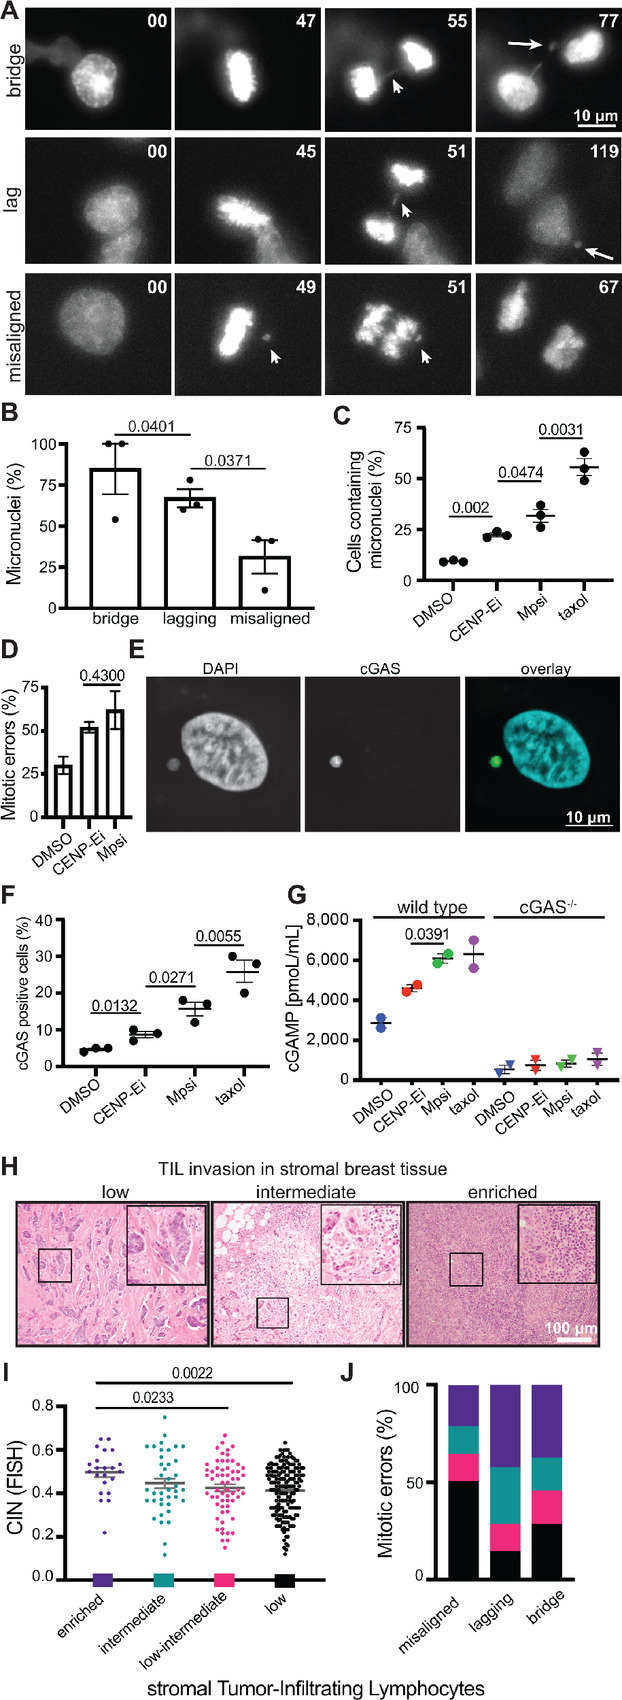
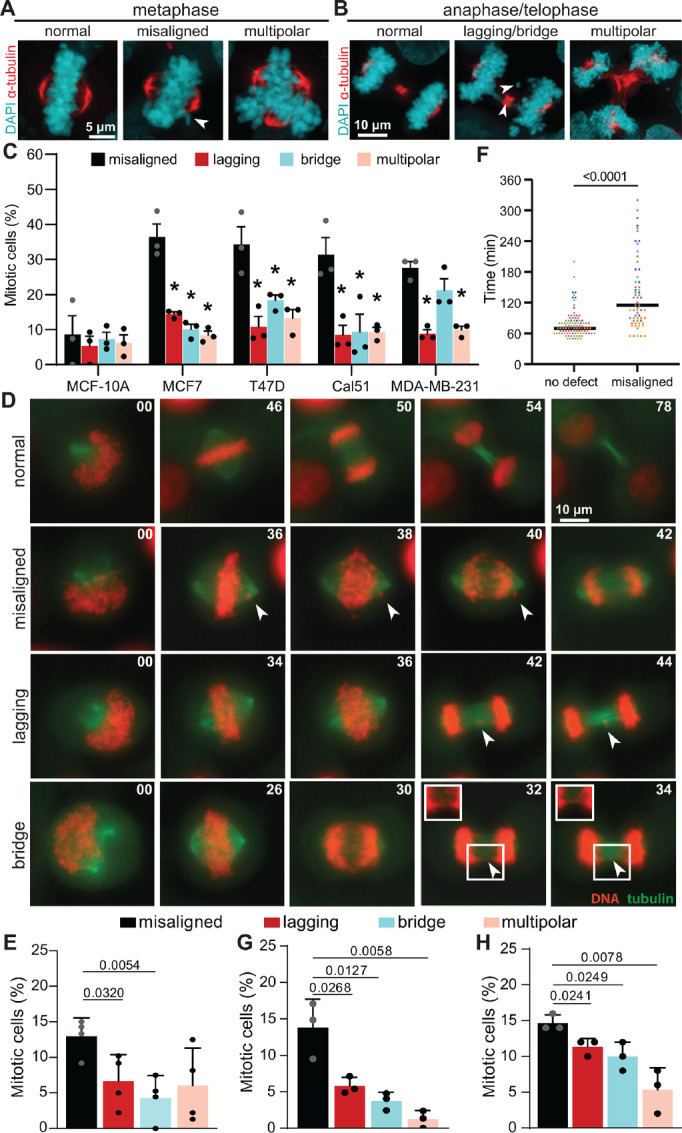
Chromosomal instability (CIN), the persistent reshuffling of chromosomes during mitosis, is a hallmark of human cancers that contributes to tumor heterogeneity and has been implicated in driving metastasis and altering responses to therapy. Though multiple mechanisms can produce CIN, lagging chromosomes generated from abnormal merotelic attachments are the major cause of CIN in a variety of cell lines, and are expected to predominate in cancer. Here, we quantify CIN in breast cancer using a tumor microarray, matched primary and metastatic samples, and patient-derived organoids from primary breast cancer. Surprisingly, misaligned chromosomes are more common than lagging chromosomes and represent a major source of CIN in primary and metastatic tumors. This feature of breast cancers is conserved in a majority of breast cancer cell lines. Importantly, though a portion of misaligned chromosomes align before anaphase onset, the fraction that remain represents the largest source of CIN in these cells. Metastatic breast cancers exhibit higher rates of CIN than matched primary cancers, primarily due to increases in misaligned chromosomes. Whether CIN causes immune activation or evasion is controversial. We find that misaligned chromosomes result in immune-activating micronuclei substantially less frequently than lagging and bridge chromosomes and that breast cancers with greater frequencies of lagging chromosomes and chromosome bridges recruit more stromal tumor-infiltrating lymphocytes. These data indicate misaligned chromosomes represent a major mechanism of CIN in breast cancer and provide support for differential immunostimulatory effects of specific types of CIN.

Significance: We surveyed the single-cell landscape of mitotic defects that generate CIN in primary and metastatic breast cancer and relevant models. Misaligned chromosomes predominate, and are less immunostimulatory than other chromosome segregation errors.


Conflict of interest statement

J.B. Tucker reports grants from NIH during the conduct of the study. S.C. Bonema reports grants from NIH during the conduct of the study. M.E. Burkard reports grants from NCI and National Institute for General Medical Sciences during the conduct of the study; personal fees from Springer Nature and Novartis; grants and personal fees from Strata Oncology; grants from Abbvie, Arcus, Apollomics, Elevation Oncology, Endeavor, Genentech, Puma, Loxo Oncology/Lilly, Seagen outside the submitted work; in addition, M.E. Burkard has a patent to 14/727399 issued, a patent to US20200157531 issued, and a patent to P200189US01 issued. B.A. Weaver reports grants from NIH and DOD during the conduct of the study. No disclosures were reported by the other authors.

Figures

FIGURE 1
FIGURE 1
Misaligned chromosomes are the predominant mitotic error in primary and metastatic breast tumors. A and B, H&E images of normal and abnormal mitotic cells in primary breast cancer. Arrows indicate respective defects. C, Distribution of mitotic defects in primary breast tumors showing that misaligned chromosomes occur most frequently. n = 1,742 metaphase cells observed in 52 patients. n = 569 anaphase and telophase cells observed in 32 patients. D, Number of abnormal chromosomes in primary tumor cells with mitotic defects showing that, typically, only a single chromosome is affected. E and F, Immunofluorescence images of normal and abnormal mitotic cells in metastatic breast cancer. Arrows denote indicated defects. Inset in F shows that the DNA bridge is continuous. G, Distribution of mitotic defects found in 12 metastatic breast tumors showing that misaligned chromosomes are the most common defect. n = 52 metaphase and 20 anaphase and telophase cells on average per case. H, Number of abnormal chromosomes in metastatic cancer cells with mitotic defects showing that in the majority of divisions, only a single chromosome is affected. P values derived from unpaired t tests.
FIGURE 2
FIGURE 2
CIN increases as tumors progress, predominantly due to an increase in misaligned chromosomes. A, Comparison of total mitotic defects in paired primary and metastatic breast cancer patient samples. Lines connect paired primary and metastatic tumor samples. B, Bipolar (top) and multipolar (bottom) metaphase spindles. C, Bipolar (top) and multipolar (bottom) anaphase spindles. D, Quantification of spindle multipolarity in 12 primary and 12 metastatic breast cancer samples showing a range of low levels of multipolarity in both. P = 0.0527 derived from unpaired t test. EG, Quantification of mitotic defects in matched primary and metastatic breast tumors. n = 364 and 628 metaphase cells observed in 12 primary and metastatic patient samples, respectively. n = 178 and 239 anaphase and telophase cells observed in 12 primary and metastatic patient samples, respectively. E, Incidence of multipolar spindles and misaligned, lagging, and bridge chromosomes in matched primary and metastatic breast cancers. Matched cases are connected by gray lines. F, The percentage of cases in which the indicated defect increased by ≥1 SD in the metastatic as compared with the primary site. G, The magnitude of the observed change in each defect summed across all cases. ns = not significant.
FIGURE 3
FIGURE 3
Misaligned chromosomes correlate with CIN in primary breast cancer. Correlation of CIN [based on variation in copy number of six chromosomes measured by interphase FISH (Methods (40)] using simple linear regressions with all types of mitotic errors (A), misaligned chromosomes (B), chromosome bridges (C), lagging chromosomes (D), and inferred multipolarity (E) demonstrating that misaligned chromosomes have the strongest correlation with CIN. n = 1,204 metaphase cells observed in 38 patients. n = 567 anaphase and telophase cells observed in 38 patients. n = 60 mitotic cells observed in normal tissue. AD,P < 0.0001; E, P = 0.0042.
FIGURE 4
FIGURE 4
Misaligned chromosomes result in fewer micronuclei and less immune activation than other mitotic defects. Still images from 24-hour timelapse analysis at 2-minute intervals of Cal51 cells with endogenously labeled histone-H2B and EGFP-α-tubulin showing the most common fate of chromosome bridges (top, arrow), lagging chromosomes (middle, arrow), and misaligned chromosomes (bottom, arrows). Long arrows in far right panels indicate micronuclei. B, Frequency of micronucleus formation in daughter cells following each mitotic defect. C, Cells containing micronuclei after chemical induction of misaligned chromosomes with 50 nmol/L of the CENP-E inhibitor GSK923296, or lagging or bridge chromosomes due to 50 nmol/L of the Mps1 inhibitor reversine. A total of 10 nmol/L taxol was used as a positive control to generate micronucleated and multinucleated daughter cells. B and C,n > 125 cells per condition in each of three independent replicates. D, Frequency of mitotic defects induced by GSK (misaligned chromosomes that persist until anaphase onset) and reversine (lagging and bridge chromosomes). n = 15–20 mitotic cells per condition in each of three independent movies. E, Image of cGAS positive micronucleus. F, cGAS positive cells 48 hours after indicated treatment. n >125 cells in each of three independent replicates. Taxol was used as a positive control (51). G, ELISA quantification of 2′3′-cGAMP in cells following 48-hour treatment in parental wild type and CRISPR edited cGAS knockout MDA-MB-231 cells. H, Representative images of stromal TIL infiltration. I, CIN positively correlates with sTIL enrichment. ANOVA P value = 0.0154. sTIL scores: low <10%, low-intermediate 10%–20%, intermediate 20%–40%, enriched >40%. J, Frequency of sTIL infiltration categories in tumors delineated by mitotic defect. Tumors with misaligned chromosomes most frequently have low sTILs while tumors with lagging and bridge chromosomes are most frequently enriched. The specified mitotic errors occur in 0%–20% of tumor cells. P < 0.001, χ2 test. Other P values derived from unpaired t test.
FIGURE 5
FIGURE 5
Misaligned chromosomes that persist until anaphase onset are a major cause of CIN in breast cancer. A and B, Immunofluorescence images of T47D cells. Arrowheads denote indicated defects. C, Frequencies of mitotic defects (mean ± SD) in nontransformed (MCF10A) and breast cancer cell lines showing that metaphase cells with a well-defined metaphase plate and one or more misaligned chromosomes that are clearly separated from the plate predominate. n > 150 metaphase cells and 150 anaphase+telophase cells in three biological replicates. *, P < 0.05, unpaired t test. D, Still images from timelapse analysis of mitotic defects in T47D cells with endogenously labeled histone H2B and α-tubulin, to label DNA and microtubules, respectively, showing normal division (top; Supplementary Movie S1), a misaligned chromosome that persists through anaphase onset (row 2; Supplementary Movie S2), a lagging chromosome (row 3; Supplementary Movie S3), and a chromosome bridge (bottom; Supplementary Movie S4). E, Quantification of mitotic defects in Cal51 cells with endogenously labeled histone H2B and α-tubulin imaged at 5-minute intervals. n = 40–73 mitotic cells in each of four biological replicates. F, Duration of mitosis (NEB to daughter cell flattening) in Cal51 cells with and without misaligned chromosomes in E, showing cells with misaligned chromosomes in metaphase exhibit a substantial mitotic delay. G and H, Quantification of mitotic defects observed using timelapse microscopy in endogenously tagged Cal51 (G) or T47D (H) cells with 2-minute acquisition intervals. n = 41–74 cells in each of three biological replicates. P values derived from unpaired t tests.

References

    1. Lynch AR, Arp NL, Zhou AS, Weaver BA, Burkard ME. Quantifying chromosomal instability from intratumoral karyotype diversity using agent-based modeling and Bayesian inference. Elife 2022;11:e69799. - PMC - PubMed
    1. Vasudevan A, Schukken KM, Sausville EL, Girish V, Adebambo OA, Sheltzer JM. Aneuploidy as a promoter and suppressor of malignant growth. Nat Rev Cancer 2021;21:89–103. - PubMed
    1. Laughney AM, Elizalde S, Genovese G, Bakhoum SF. Dynamics of tumor heterogeneity derived from clonal karyotypic evolution. Cell Rep 2015;12:809–20. - PubMed
    1. Kulukian A, Holland AJ, Vitre B, Naik S, Cleveland DW, Fuchs E. Epidermal development, growth control, and homeostasis in the face of centrosome amplification. Proc Natl Acad Sci U S A 2015;112:E6311–20. - PMC - PubMed
    1. Vitre B, Holland AJ, Kulukian A, Shoshani O, Hirai M, Wang Y, et al. . Chronic centrosome amplification without tumorigenesis. Proc Natl Acad Sci U S A 2015;112:E6321–30. - PMC - PubMed

Publication types