. 2023 Mar 9:14:1107172.
doi: 10.3389/fpls.2023.1107172. eCollection 2023.

Hormones regulate the flowering process in saffron differently depending on the developmental stage

Affiliations

Hormones regulate the flowering process in saffron differently depending on the developmental stage

Deepika Singh et al. Front Plant Sci. .

Abstract

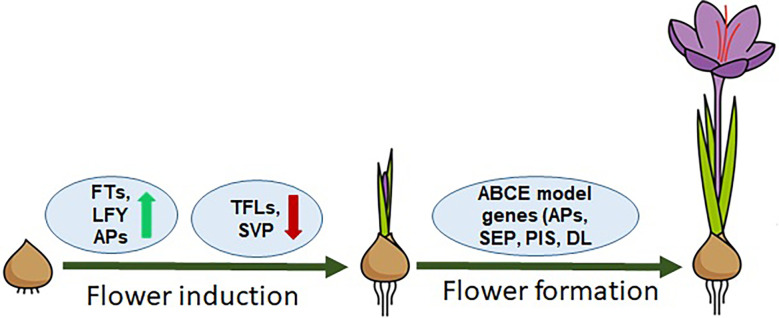
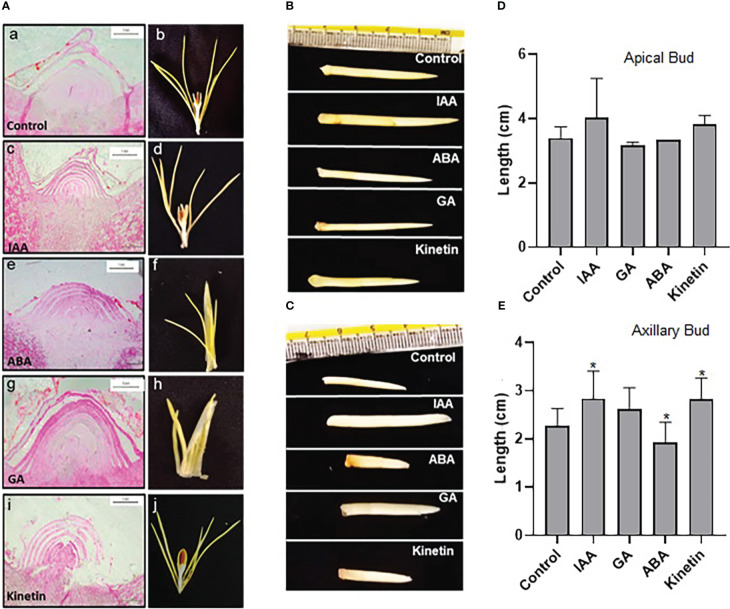
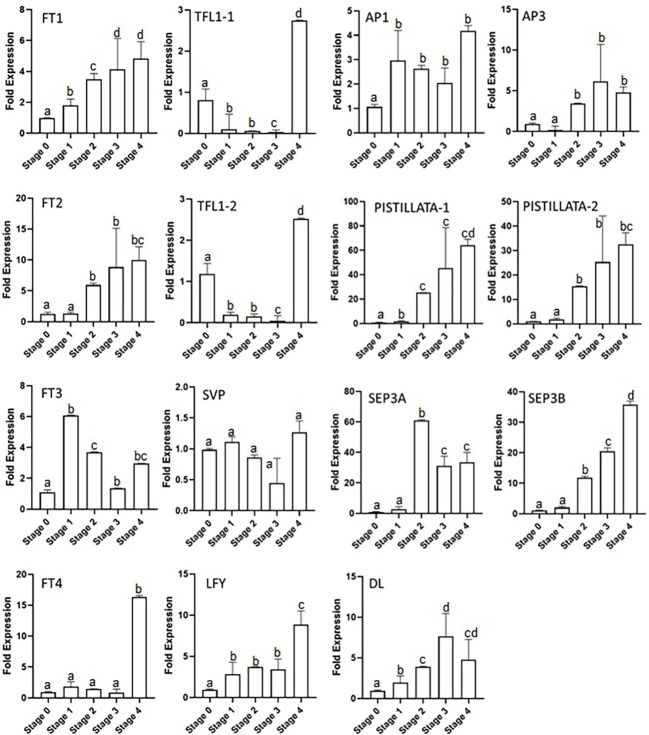
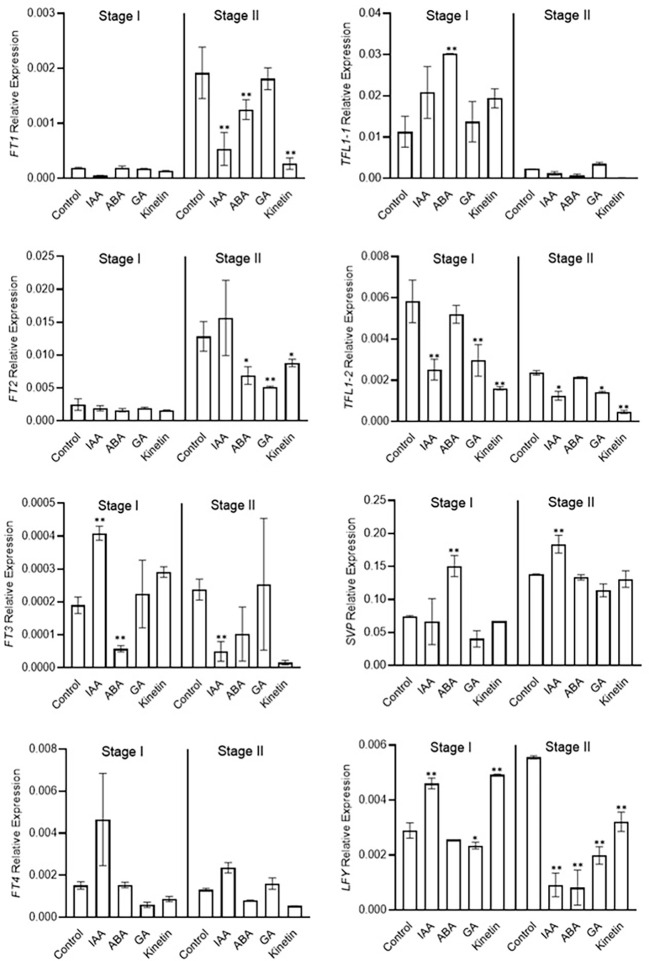
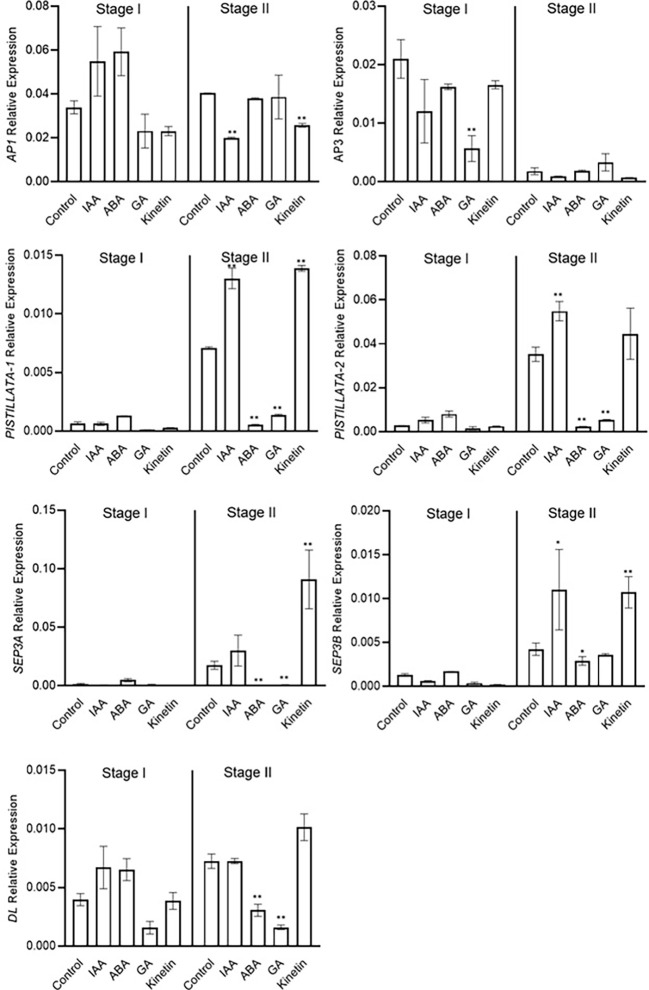
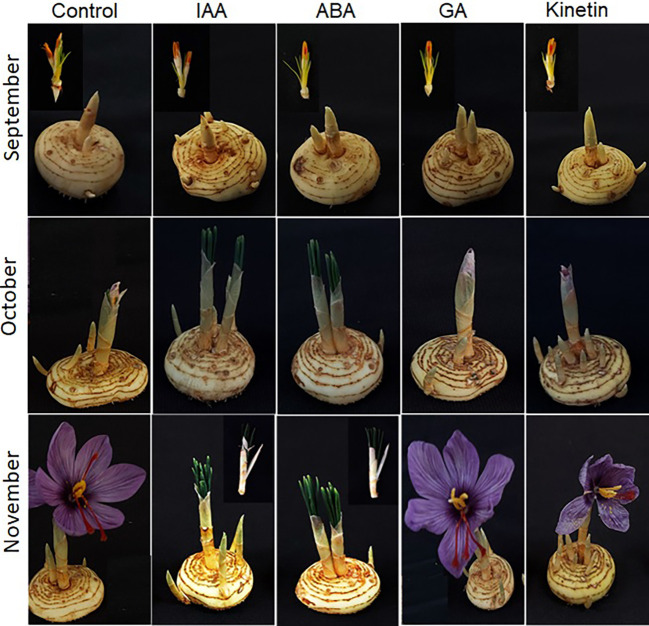
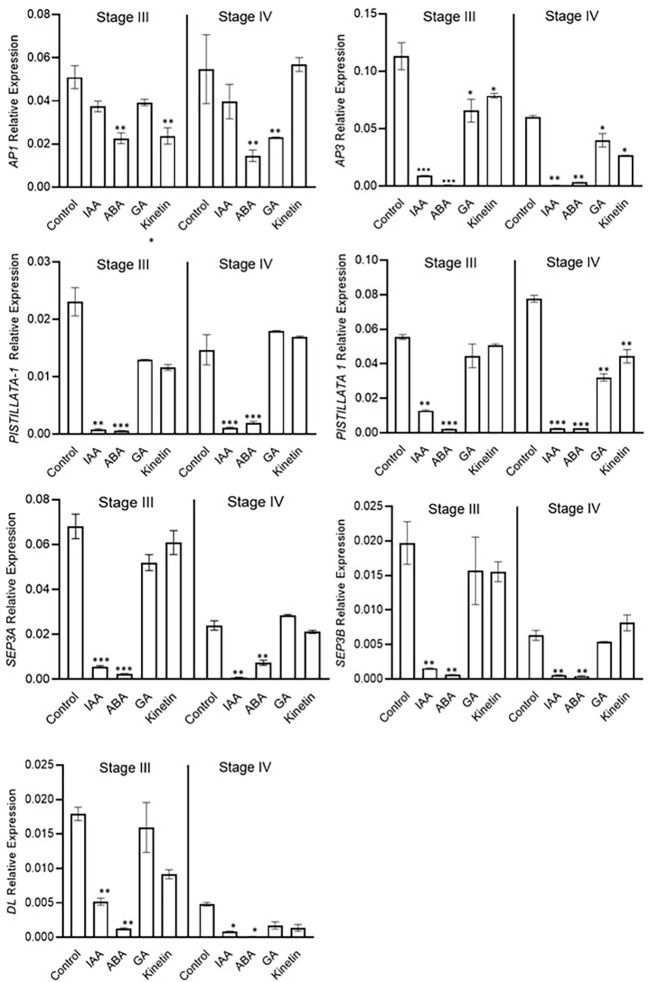
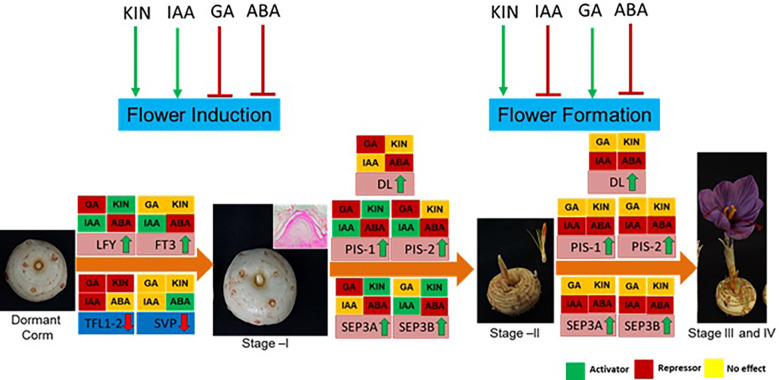
Flowering in saffron is a highly complex process regulated by the synchronized action of environmental cues and endogenous signals. Hormonal regulation of flowering is a very important process controlling flowering in several plants, but it has not been studied in saffron. Flowering in saffron is a continual process completed in months with distinct developmental phases, mainly divided into flowering induction and flower organogenesis/formation. In the present study, we investigated how phytohormones affect the flowering process at different developmental stages. The results suggest that different hormones differentially affect flower induction and formation in saffron. The exogenous treatment of flowering competent corms with abscisic acid (ABA) suppressed both floral induction and flower formation, whereas some other hormones, like auxins (indole acetic acid, IAA) and gibberellic acid (GA), behaved contrarily at different developmental stages. IAA promoted flower induction, while GA suppressed it; however, GA promoted flower formation, whereas IAA suppressed it. Cytokinin (kinetin) treatment suggested its positive involvement in flower induction and flower formation. The expression analysis of floral integrator and homeotic genes suggests that ABA might suppress floral induction by suppressing the expression of the floral promoter (LFY, FT3) and promoting the expression of the floral repressor (SVP) gene. Additionally, ABA treatment also suppressed the expression of the floral homeotic genes responsible for flower formation. GA reduces the expression of flowering induction gene LFY, while IAA treatment upregulated its expression. In addition to these genes, a flowering repressor gene, TFL1-2, was also found to be downregulated in IAA treatment. Cytokinin promotes flowering induction by increasing the expression levels of the LFY gene and decreasing the TFL1-2 gene expression. Moreover, it improved flower organogenesis by increasing the expression of floral homeotic genes. Overall, the results suggest that hormones differently regulate flowering in saffron via regulating floral integrator and homeotic gene expression.

Keywords: floral induction; floral integrators; flowering (evocation); homeotic genes; phytohormones.


Conflict of interest statement

The authors declare that the research was conducted in the absence of any commercial or financial relationships that could be construed as a potential conflict of interest.

Figures

Figure 1
Figure 1
Model representing the flowering regulation in saffron. FT, LFY genes are flower inducers; TFLs, SVP are flowering inhibitors; ABCE model genes: APs, SEPs, PISs, and DLs are homeotic genes/flower organogenesis.
Figure 2
Figure 2
Morphological characteristics of saffron apical bud during flower induction stages after the hormonal treatments. (A) Cross-section images of the apical bud after 45 and 90 days of hormonal treatments, representing stage I and stage II, respectively: a, b—control (mock treatment); c, d—IAA-treated; e, f—ABA-treated; g, h—GA-treated; and i, j—kinetin-treated in stage I and stage II, respectively. (B, C) Representative pictures of the apical bud and axillary bud, respectively, in stage II of treatments. (D) Graphical representation of apical bud length. (E) Graphical representation of axillary bud length in stage II. The data presented is the mean of three biological replicates. Error bars represent standard error. *P < 0.05, with respect to control (Student’s t-test).
Figure 3
Figure 3
Expression profiling of floral integrator and homeotic genes at different developmental stages of saffron flowering. Stages 0–4 represent different developmental stages during saffron flowering. Stage 0, dormant corms; stage 1, flower induction stage; stage 2, stamen and stigma formation; stage 3, stamen and stigma development and elongation; and stage 4, tepal development. Error bars represent ± SD of three biological replicates. Stage I morphologically represents the flower induction stage, and stage II represents the stamen and stigma formation stage. Letters (a–d) over the bars indicate significant differences at P < 0.05 (means followed by the same letter are not significantly different at P = 0.05).
Figure 4
Figure 4
Expression profiling of genes involved in flowering induction quantified by real-time PCR in response to different hormones. Total RNA was isolated from the apical bud of corms treated with different hormones at 45 days (stage I) and 90 days (stage II) of treatments. Reactions from three separate pools of apical bud RNA samples were run in triplicates with tubulin as the internal control for normalization. Error bars represent ± SD of three biological replicates. Stage I morphologically represents the flower induction stage, and stage II represents the stamen and stigma formation stage. Data represented is mean of three biological replicates. Error bars represent standard error (SE), * indicates P < 0.05, ** indicates P < 0.01, with respect to control (Student’s t-test).
Figure 5
Figure 5
Expression profiling of genes involved in flower formation quantified by real-time PCR in response to different hormones. Total RNA was isolated from the apical bud of corms treated with different hormones at 45 days (stage I) and 90 days (stage II) of treatments. Reactions from three separate pools of root RNA samples were run in triplicates with tubulin as the internal control for normalization. Error bars represent ± SD of three biological replicates. Stage I morphologically represents the flower induction stage, and stage II represents the stamen and stigma formation stage. Data represented is mean of three biological replicates. Error bars represent standard error (SE), * indicates P < 0.05, ** indicates P < 0.01, with respect to control (Student’s t-test).
Figure 6
Figure 6
Morphological changes during flower formation in saffron after hormonal treatments. Corms already floral-initiated in early September were treated with different hormones and sampled after 45 days (mid-October) and 90 days (end of November).
Figure 7
Figure 7
Expression profiling of genes involved in flower formation after the hormone treatment. Corms already initiated flowering were used for the treatment. The apical bud samples were collected after 45 and 90 days after the hormonal treatment. Error bars represent ± SD of three biological replicates. Stage III morphologically represents the stamen and stigma elongation stage, and stage IV represents the tepal formation stage. Data represented is mean of three biological replicates. Error bars represent standard error (SE), * indicates P < 0.05, ** indicates P < 0.01, *** indicates P < 0.001 with respect to control (Student’s t-test).
Figure 8
Figure 8
Summary of the effect of hormones on flowering process, gene regulation, and their effect at different developmental stages of saffron flowering. Briefly, ABA negatively regulates both flower induction and formation, whereas kinetin promotes both. Indole acetic acid (IAA) promotes flower induction, while gibberellic acid (GA) suppresses it. IAA inhibits flower formation, and GA promotes it. Green arrows show positive regulation, and red shows negative regulation. Hormonal effect on gene expression at different stages is marked by green, red, and yellow colors. The green color indicates induced expression levels, the red color indicates reduced expression levels, and the yellow color shows no significant changes in effect on the expression levels of the genes.

References

    1. Aloni R., Aloni E., Langhans M., Ullrich C. I. (2006). Role of auxin in regulating arabidopsis flower development. Planta 223, 315–328. doi: 10.1007/s00425-005-0088-9 - DOI - PubMed
    1. Bencivenga S., Simonini S., Benková E., Colombo L. (2012). The transcription factors BEL1 and SPL are required for cytokinin and auxin signaling during ovule development in arabidopsis. Plant Cell 24, 2886–2897. doi: 10.1105/tpc.112.100164 - DOI - PMC - PubMed
    1. Boss P. K., Thomas M. R. (2002). Association of dwarfism and floral induction with a grape 'green revolution' mutation. Nature 416, 847–850. doi: 10.1038/416847a - DOI - PubMed
    1. Brooking I., Jamieson P. (2002). Temperature and photoperiod response of vernalization in near-isogenic lines of wheat. Field Crops Res. 79, 21–38. doi: 10.1016/S0378-4290(02)00106-5 - DOI
    1. Cheng Y., Zhao Y. (2007). A role for auxin in flower development. J. Integr. Plant Biol. 49, 99–104. doi: 10.1111/j.1744-7909.2006.00412.x - DOI

LinkOut - more resources