Review
. 2023 Jan 12;3(2):143-156.
doi: 10.1021/acsphyschemau.2c00061. eCollection 2023 Mar 22.

Single-Molecule Optical Biosensing: Recent Advances and Future Challenges

Affiliations
Review

Single-Molecule Optical Biosensing: Recent Advances and Future Challenges

Swayandipta Dey et al. ACS Phys Chem Au. .

Abstract

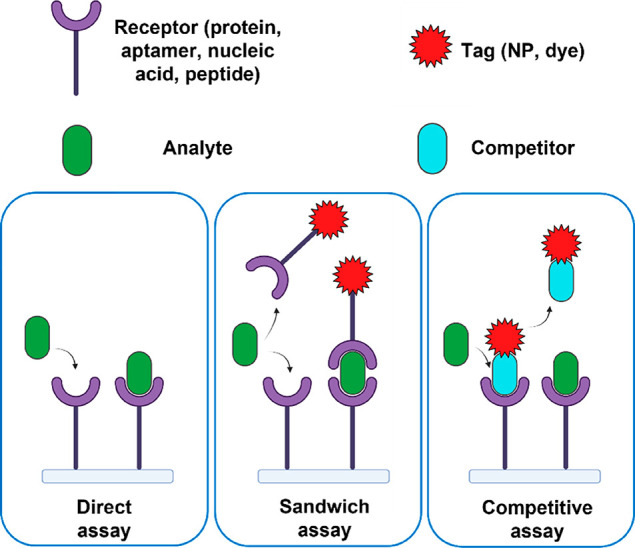
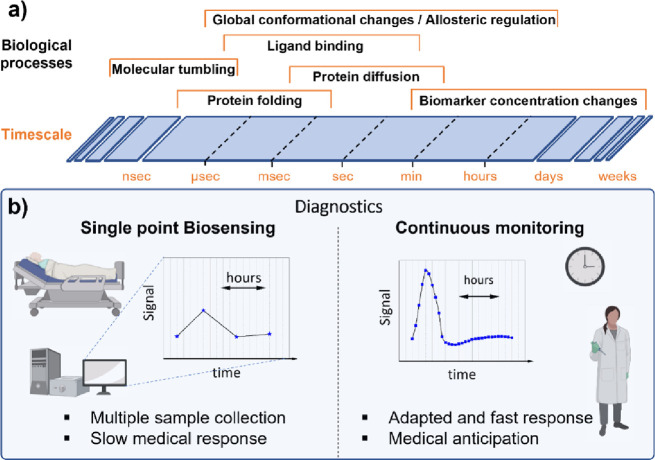
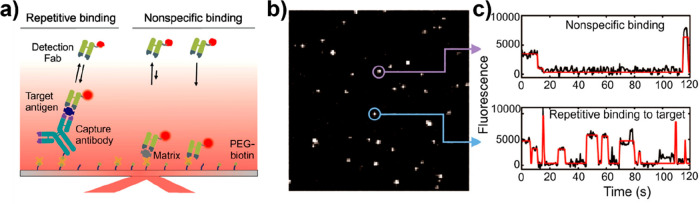
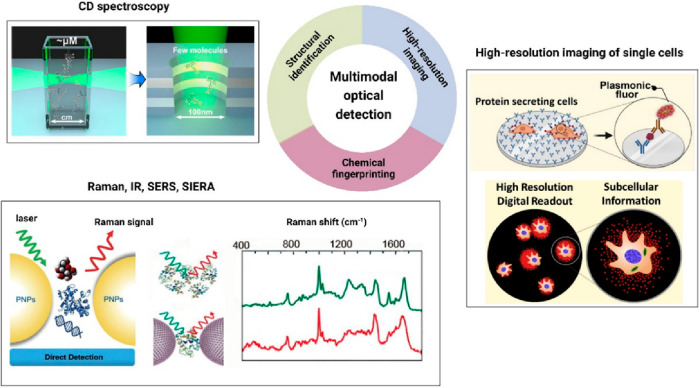
In recent years, the sensitivity and specificity of optical sensors has improved tremendously due to improvements in biochemical functionalization protocols and optical detection systems. As a result, single-molecule sensitivity has been reported in a range of biosensing assay formats. In this Perspective, we summarize optical sensors that achieve single-molecule sensitivity in direct label-free assays, sandwich assays, and competitive assays. We describe the advantages and disadvantages of single-molecule assays and summarize future challenges in the field including their optical miniaturization and integration, multimodal sensing capabilities, accessible time scales, and compatibility with real-life matrices such as biological fluids. We conclude by highlighting the possible application areas of optical single-molecule sensors that include not only healthcare but also the monitoring of the environment and industrial processes.


Conflict of interest statement

The authors declare no competing financial interest.

Figures

Figure 1
Figure 1
Illustration of three assays used in affinity-based single-molecule sensors. In a direct assay, the signal is generated by the analyte itself. In a sandwich assay, a tag or detection probe is used to provide a signal once an analyte is bound. In a competitive assay, a labeled competitor is detected whose interaction with the receptors is prevented in the presence of an analyte.
Figure 2
Figure 2
Examples of single-molecule direct assays. (a) Left: Schematic of the optical setup for monitoring stochastic protein interactions using plasmon sensing. Middle: Illustration of detection principle; gold nanorods are functionalized with receptors (depicted in red), whereas the sides are blocked with tetra ethylene glycol (depicted in green). The binding of individual antibodies results in a red shift of the plasmon resonance. Right: Time trace of the normalized scattered intensity of a single gold nanorod. Stepwise changes in the signal indicate stochastic binding of single antibodies. The distribution of waiting times between events is used to determine the antibody concentration. Reproduced with permission from (23). Copyright 2015 American Chemical Society. (b) Left: Experimental design of a Whispering Gallery Mode (WGM) based sensing platform showing detection of single virus particles. Middle: The resonance is identified at a specific wavelength from a dip in the transmission spectrum acquired with a tunable laser. A resonance shift associated with molecular binding; Δλr is indicated by the dashed arrow. Bottom panel: Binding of analyte is identified from a shift Δλr of resonance wavelength. Reproduced with permission from (28). Copyright 2008 Proceedings of the National Academy of Sciences. (c) Left: Concept of interferometric scattering mass spectrometry (iSCAMS) and working principle of label-free DNA detection employing iSCAMS. Individual DNA molecules diffusing in solution bind to an appropriately charged glass surface. Middle: Binding events cause changes to the reflectivity of the interface, visualized by a contrast-enhanced interferometric scattering microscope through the interference between scattered and reflected light. Right: Statistics of the image contrast provide a single-molecule readout of molecular mass. Adapted with permission from ref (33). Copyright 2020 Oxford University Press. Adapted with permission from (36). Copyright 2018 American Association for the Advancement of Science.
Figure 3
Figure 3
(a) Schematic representation of single molecule recognition through equilibrium Poisson sampling (SiMREPS). (b) Representative intensity versus time traces in the absence and presence of adenosine (50 pM). Reproduced with permission from (39).  Copyright 2020 American Chemical Society. (c) Illustration of one-step process for forming the human PCT antibody–antigen–antibody sandwich complexes. (d) Bright-field images (part of entire view) over time for digital counting. (e) Standard curve of PCT detection at 10 min. The error bars are the standard deviation of triplicate tests, and the dashed line represents the level of blank. Reproduced with permission from (47).  Copyright 2020 American Chemical Society.
Figure 4
Figure 4
Design of a digital single-particle sensor. (a) Schematic drawing of continuous molecule monitoring with a digital single-particle switch (the molecules are not to scale). The sensing functionality is embedded in the digital switching behavior of the particle. The particle dynamically switches between bound and unbound states because of transient binding between the detection molecule and analogues. Reproduced with permission from (54). Copyright 2020 American Chemical Society. (b) The mobility of the particles is analyzed as a function of time, and the binding/unbinding events are digitally detected for hundreds of particles in parallel. The time between two consecutive events corresponds to the lifetime of the enclosed state. Reprinted with permission from ref (51). Copyright 2018 Nature Portfolio. (c) An example of switching activity measured over time for an ssDNA analyte. The top panel shows the concentration–time profiles, and the bottom panel shows the measured switching activity. The switching activity shows an inverted response (high analyte concentration gives low switching activity), as expected for a competitive assay. Red and orange data points represent equal decreasing concentration series; green and blue data points represent sequences of alternating concentration values. Lines are guides for the eyes. Reproduced with permission from ref (55). Copyright 2020 American Chemical Society.
Figure 5
Figure 5
(a) Characteristic time scales for various biomolecular processes. (b) Comparison of single point biosensing and continuous monitoring in terms of diagnostics.
Figure 6
Figure 6
(a) Experimental scheme for the detection of analytes (target antigen) by SiMREPS. (b) Single movie frame of a representative microscope FOV; the bright puncta represent single FPs bound at or near the coverslip surface. (c) Representative intensity versus time traces showing the distinct kinetic fingerprints of nonspecific binding (top) and repetitive binding to the analyte (bottom). Reproduced with permission from ref (39).  Copyright 2020 American Chemical Society.
Figure 7
Figure 7
Schematic illustrating the possibilities of multimodal optical detection methods by combining multiple optical techniques for simultaneous structural identification, chemical recognition, and high-resolution imaging of analyte molecules. Reproduced with permission from refs ( and 91). Copyright 2018, 2022 American Chemical Society. Reprinted with permission from ref (93). Copyright 2022 Elsevier Inc.
Figure 8
Figure 8
Timeline depicting the evolution of optical biosensors (left, benchtop detection ; middle, rapid, diagnostic field testing kits and portable smartphone based sensors; right, integrated smart biosensors for personalized health monitoring. Reprinted with permission from ref (102). Copyright 2016 Nature Publishing Group.

References

    1. Liu Y.; Zhan L.; Qin Z.; Sackrison J.; Bischof J. C. Ultrasensitive and Highly Specific Lateral Flow Assays for Point-of-Care Diagnosis. ACS Nano 2021, 15, 3593–3611. 10.1021/acsnano.0c10035. - DOI - PubMed
    1. Kim J.; Campbell A. S.; de Ávila B. E.-F.; Wang J. Wearable biosensors for healthcare monitoring. Nat. Biotechnol. 2019, 37, 389–406. 10.1038/s41587-019-0045-y. - DOI - PMC - PubMed
    1. Lee I.; Probst D.; Klonoff D.; Sode K. Continuous glucose monitoring systems - Current status and future perspectives of the flagship technologies in biosensor research. Biosens. Bioelectron. 2021, 181, 113054.10.1016/j.bios.2021.113054. - DOI - PubMed
    1. Parlak O. Portable and wearable real-time stress monitoring: A critical review. Sensors and Actuators Reports 2021, 3, 100036.10.1016/j.snr.2021.100036. - DOI
    1. Tehrani F.; et al. An integrated wearable microneedle array for the continuous monitoring of multiple biomarkers in interstitial fluid. Nat. Biomed. Eng. 2022, 6, 1214–1224. 10.1038/s41551-022-00887-1. - DOI - PubMed