. 2023 Feb 22;9(3):362-372.
doi: 10.1021/acscentsci.2c01100. eCollection 2023 Mar 22.

Quantification and Mapping of Alkylation in the Human Genome Reveal Single Nucleotide Resolution Precursors of Mutational Signatures

Affiliations

Quantification and Mapping of Alkylation in the Human Genome Reveal Single Nucleotide Resolution Precursors of Mutational Signatures

Yang Jiang et al. ACS Cent Sci. .

Erratum in

Abstract

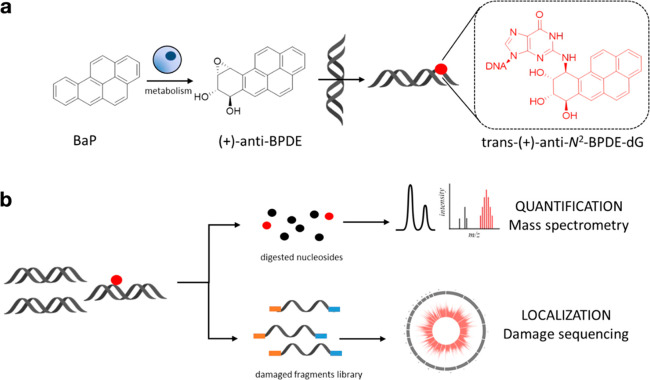
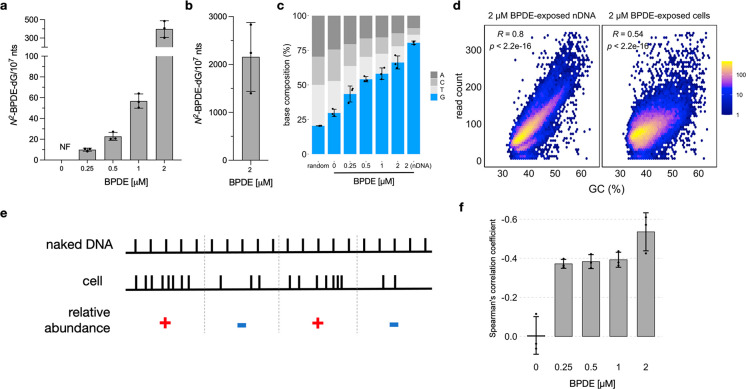
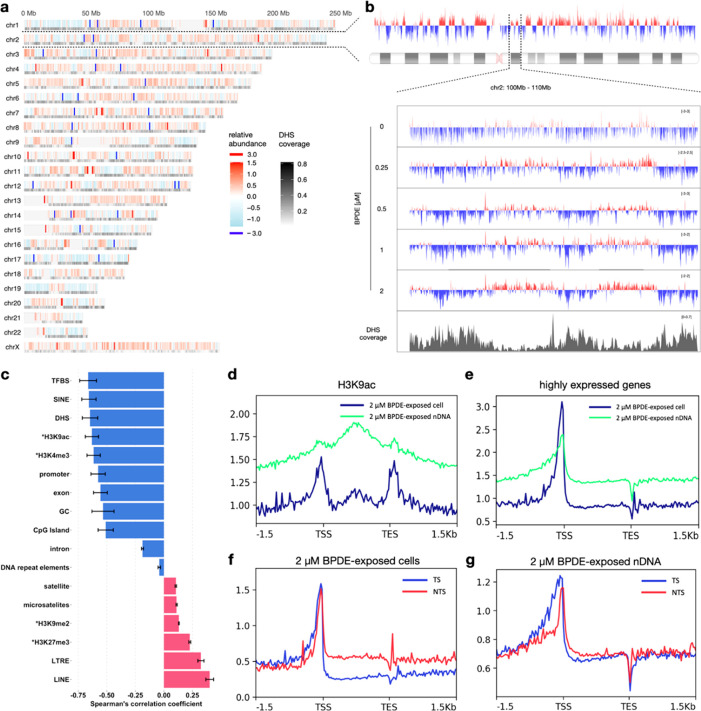
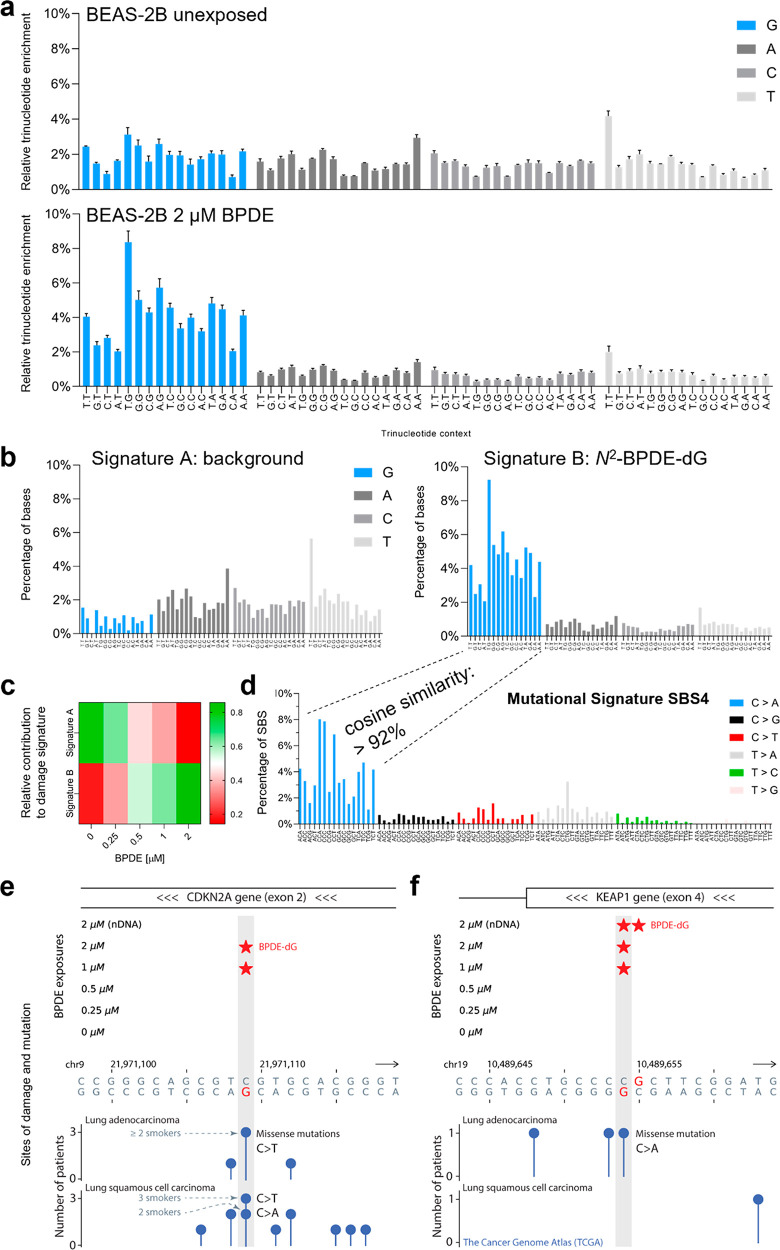
Chemical modifications to DNA bases, including DNA adducts arising from reactions with electrophilic chemicals, are well-known to impact cell growth, miscode during replication, and influence disease etiology. However, knowledge of how genomic sequences and structures influence the accumulation of alkylated DNA bases is not broadly characterized with high resolution, nor have these patterns been linked with overall quantities of modified bases in the genome. For benzo(a) pyrene (BaP), a ubiquitous environmental carcinogen, we developed a single-nucleotide resolution damage sequencing method to map in a human lung cell line the main mutagenic adduct arising from BaP. Furthermore, we combined this analysis with quantitative mass spectrometry to evaluate the dose-response profile of adduct formation. By comparing damage abundance with DNase hypersensitive sites, transcription levels, and other genome annotation data, we found that although overall adduct levels rose with increasing chemical exposure concentration, genomic distribution patterns consistently correlated with chromatin state and transcriptional status. Moreover, due to the single nucleotide resolution characteristics of this DNA damage map, we could determine preferred DNA triad sequence contexts for alkylation accumulation, revealing a characteristic DNA damage signature. This new BaP damage signature had a profile highly similar to mutational signatures identified previously in lung cancer genomes from smokers. Thus, these data provide insight on how genomic features shape the accumulation of alkylation products in the genome and predictive strategies for linking single-nucleotide resolution in vitro damage maps with human cancer mutations.


Conflict of interest statement

The authors declare the following competing financial interest(s): J.H., N.S., and N.V.I. are employees of Philip Morris International.

Figures

Figure 1
Figure 1
(a) Benzo[a]pyrene (BaP) metabolism yields four stereoisomers of benzo[a]pyrene-diol-epoxide (BPDE): (+)-anti (shown), (−)-anti, (+)-syn, and (−)-syn. The metabolite reacts with DNA and undergoes trans- (shown) or cis-ring opening, leading to the formation of 8 potential isomers. The trans-(+)-anti-N2-BPDE-dG adduct shown is the most abundant and mutagenic. (b) Top: N2-BPDE-dG quantification workflow, involving enzymatic hydrolysis of genomic DNA, followed by chromatographic separation and quantification of deoxynucleosides by LC-MS/MS. In this study, cells were exposed to (±)-anti-BPDE, and total N2-BPDE-dG was quantified. Bottom: N2-BPDE-dG-sequencing workflow, involving denaturation and immunoprecipitation of genomic DNA, followed by marking of adduct sites by DNA extension synthesis with Q5 DNA polymerase. Amplified fragments are sequenced, and the DNA adducts are located at the −1 position relative to read starts.
Figure 2
Figure 2
N2-BPDE-dG quantification and sequencing. Results shown are calculated across three biological replicates ± SD (a) N2-BPDE-dG levels in BEAS-2B cells exposed to increasing concentrations of BPDE. (b) N2-BPDE-dG in naked DNA (nDNA) reacted with 2 μM BPDE. (c) Base composition at damage sites. Random values were calculated from three simulated data sets; each contains 10 million random reads across the human genome. (d) Scatter plot showing sequencing read distribution and its Spearman’s correlation coefficient with GC content for nDNA reacted with 2 μM BPDE or cells exposed to 2 μM BPDE. Results were calculated in 100 kb bins across the genome, averaged across three biological replicates. (e) Conceptual visualization of the relative abundance variable evaluated in this study. (f) Bar plots showing the correlation between relative abundance of N2-BPDE-dG and GC-content.
Figure 3
Figure 3
Distribution of N2-BPDE-dG in genomic DNA. (a) Genome-wide map of N2-BPDE-dG in cells exposed to 2 μM BPDE. Relative abundance of N2-BPDE-dG is shown as a function of genomic location. Color scale represents the mean of relative abundance (log2 (Cell/nDNA)) of N2-BPDE-dG calculated in 100 kb bins across three biological replicates. Grayscale represents the DHS coverage in 100 kb bins across genome. Undefined sequences in the human genome annotated in the ENCODE Blacklist, such as centromeres and telomeres, were removed from the data and are shown in light gray. (b) Detailed profile of the relative abundance of N2-BPDE-dG on chromosome 2; the view is further expanded at 100–110 Mb for each exposure condition. Y-axis represents relative abundance of N2-BPDE-dG. Data shown are the average of three biological replicates (calculations performed with 5 kb bins across chromosome 2). The plots were smoothed using LOESS (locally estimated scatterplot smoothing). (c) Spearman’s correlation coefficients of relative abundance of N2-BPDE-dG and genomic features in cells exposed to 2 μM BPDE. Calculations were performed with 100 kb bins across the genome, averaged across three biological replicates ± SD. *ChIP-seq data for BEAS-2B cells were previously published.,,− (d, e) Profiles of N2-BPDE-dG in H3K9ac and highly expressed gene regions (n = 10,612) from cells and nDNA reacted with 2 μM BPDE. Calculations were performed in 25 bp bins and averaged across three biological replicates. (f, g) Profiles of N2-BPDE on the transcribed strand (TS) or nontranscribed strand (NTS) of highly expressed genes (n = 10,612). Shown are data for cells (f) and nDNA (g) exposed to 2 μM BPDE. Highly expressed genes were defined using mRNA-seq data acquired in this study (see RNA-sequencing and data processing in Methods section in Supporting Information). Data represent mean values calculated from three replicates in 25 bp bin size.
Figure 4
Figure 4
(a) Relative trinucleotide enrichment at the predicted damage site from nonexposed cells and cells exposed to 2 μM BPDE. (b) Signatures extracted from all samples using a non-negative matrix factorization. Two signatures were extracted and labeled A and B. (c) Heat map representing the relative contribution of Signature A and B to the damage signature extracted from cells exposed to different BPDE concentrations. (d) Mutational Signature 4 extracted from smoking-related lung cancers. Cosine similarity of the extracted relative trinucleotide enrichment profile with C > A mutations in Signature 4. (e–f) BPDE-dG at lung-cancer-associated mutation sites located in tumor suppressor genes CDKN2A (e) and KEAP1 (f). A star indicates BPDE damage called by at least two reads across experimental replicates of a given condition. The identified damage-mutation match in CDKN2A is the most frequently mutated site of this gene in lung adenocarcinomas. As a reference for the Y-axis values of the mutation data in KEAP1, for ∼93% of lung-carcinoma mutation sites the number of patients with mutation is one, and for the remaining mutation sites this number is two. The TCGA mutational data were obtained via UCSC Table Browser. The gene annotation is according to GENCODE V41 (MANE-only set).

References

    1. Powers K. T.; Washington M. T. Eukaryotic translesion synthesis: Choosing the right tool for the job. DNA Repair 2018, 71, 127–134. 10.1016/j.dnarep.2018.08.016. - DOI - PMC - PubMed
    1. Tubbs A.; Nussenzweig A. Endogenous DNA Damage as a Source of Genomic Instability in Cancer. Cell. 2017, 168 (4), 644–56. 10.1016/j.cell.2017.01.002. - DOI - PMC - PubMed
    1. Rossman T. G.; Klein C. B. From DNA damage to mutation in mammalian cells: a review. Environ. Mol. Mutagen. 1988, 11 (1), 119–33. 10.1002/em.2850110111. - DOI - PubMed
    1. Fedeles B. I.; Essigmann J. M. Impact of DNA lesion repair, replication and formation on the mutational spectra of environmental carcinogens: Aflatoxin B1 as a case study. DNA Repair. 2018, 71 (71), 12–22. 10.1016/j.dnarep.2018.08.008. - DOI - PMC - PubMed
    1. Yu Y.; Wang P.; Cui Y.; Wang Y. Chemical Analysis of DNA Damage. Anal. Chem. 2018, 90 (1), 556–76. 10.1021/acs.analchem.7b04247. - DOI - PMC - PubMed