. 2023 Mar 9:13:1118152.
doi: 10.3389/fonc.2023.1118152. eCollection 2023.

An inflammation-related gene landscape predicts prognosis and response to immunotherapy in virus-associated hepatocellular carcinoma

Affiliations

An inflammation-related gene landscape predicts prognosis and response to immunotherapy in virus-associated hepatocellular carcinoma

Ying-Jie Gao et al. Front Oncol. .

Abstract

Background: Due to the viral infection, chronic inflammation significantly increases the likelihood of hepatocellular carcinoma (HCC) development. Nevertheless, an inflammation-based signature aimed to predict the prognosis and therapeutic effect in virus-related HCC has rarely been established.

Method: Based on the integrated analysis, inflammation-associated genes (IRGs) were systematically assessed. We comprehensively investigated the correlation between inflammation and transcriptional profiles, prognosis, and immune cell infiltration. Then, an inflammation-related risk model (IRM) to predict the overall survival (OS) and response to treatment for virus-related HCC patients was constructed and verified. Also, the potential association between IRGs and tumor microenvironment (TME) was investigated. Ultimately, hub genes were validated in plasma samples and cell lines via qRT-PCR. After transfection with shCCL20 combined with overSLC7A2, morphological change of SMMC7721 and huh7 cells was observed. Tumorigenicity model in nude mouse was established.

Results: An inflammatory response-related gene signature model, containing MEP1A, CCL20, ADORA2B, TNFSF9, ICAM4, and SLC7A2, was constructed by conjoint analysis of least absolute shrinkage and selection operator (LASSO) Cox regression and gaussian finite mixture model (GMM). Besides, survival analysis attested that higher IRG scores were positively relevant to worse survival outcomes in virus-related HCC patients, which was testified by external validation cohorts (the ICGC cohort and GSE84337 dataset). Univariate and multivariate Cox regression analyses commonly proved that the IRG was an independent prognostic factor for virus-related HCC patients. Thus, a nomogram with clinical factors and IRG was also constructed to superiorly predict the prognosis of patients. Featured with microsatellite instability-high, mutation burden, and immune activation, lower IRG score verified a superior OS for sufferers. Additionally, IRG score was remarkedly correlated with the cancer stem cell index and drug susceptibility. The measurement of plasma samples further validated that CCL20 upexpression and SLC7A2 downexpression were positively related with virus-related HCC patients, which was in accord with the results in cell lines. Furthermore, CCL20 knockdown combined with SLC7A2 overexpression availably weakened the tumor growth in vivo.

Conclusions: Collectively, IRG score, serving as a potential candidate, accurately and stably predicted the prognosis and response to immunotherapy in virus-related HCC patients, which could guide individualized treatment decision-making for the sufferers.

Keywords: drug sensitivity; hepatocellular carcinoma; immune; inflammation; tumor microenvironment; virus.


Conflict of interest statement

The authors declare that the research was conducted in the absence of any commercial or financial relationships that could be construed as a potential conflict of interest.

Figures

Figure 1
Figure 1
workflow of the study. Virus-related HCCs extracted from TCGA database and 200 inflammation-relevant markers from the Molecular Signatures database were analyzed to identify IRG DEGs. Next, consenus clustering was used to classify inflammation subgroups. The prognostic model was constructed and validated in multiple ways and proved to be stable and reliable. Therefore, based on this model, we also performed analysis about immunological characteristics, drug sensitivity and the correlation between IRGs and Tumor Microenvironment.
Figure 2
Figure 2
Identification and analysis of inflammation-related differentially expressed genes in virus-related HCC. (A) Dot plot for three distinct clusters identified by t-SNE algorithm based on 200 inflammation hallmark genes. (B) Kaplan-Meier plot of overall survival for patients in three clusters. (C) Heatmap showing expression profiles for inflammation-related DEGs with comparison between cluster I (inflammationhigh) and cluster II (inflammationlow) groups. (D) The Protein-protein interaction (PPI) network between 47 differentially expressed inflammation-related genes (IRGs). (E) Gene Ontology (GO) and (F) Kyoto Encyclopedia of Genes and Genomes (KEGG) enrichment analysis for IRGs. Adjusted p < 0.01 and p < 0.05 were considered significant.
Figure 3
Figure 3
IRG subgroups divided by consistent clustering and its corresponding clinicopathological and biological characteristics. (A) The correlation in inflammation-related gene expression. (B) Consensus clustering of 179 sufferers from virus-related TCGA-LIHC cohorts based on the IRG DEGs. Consensus matrix for optimal k = 3. (C) Principal component analysis (PCA) of TCGA database for optimal k = 3. (D) Kaplan-Meier analysis for overall survival (OS) curves of patients in distinct clusters. (E) Differences in clinicopathologic characteristics and expression levels of IRGs between the three distinct subgroups.
Figure 4
Figure 4
Correlation between IRG subgroups and tumor microenvironment in virus-related liver cancer (TCGA cohort). (A) heatmap displaying clustering of tumor-infiltrating immune cells in TCGA cohort. Rows represent tumor-infiltrating immune cells, and columns represent samples. (B) Expression levels of PD-1, PD-L1, and CTLA-4 in the three virus-related HCC subgroups. (C) Comparison of TME scores among IRG subgroups. (D) Abundance of 23 infiltrating immune cell types in the three virus-related HCC subgroups. *p<0.05; **p<0.01; ***p<0.001; ****p<0.0001; ns, not significant.
Figure 5
Figure 5
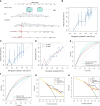
Construction of an inflammation-related risk model to predict the OS of virus-related HCC patients. (A) 13 prognosis-related IRGs screened by univariate Cox regression analysis (p<0.05). (B) The tuning parameter (λ) in the LASSO model is chosen by the minimum criterion. (C) LASSO coefficient distribution of 13 inflammation-related IRGs. (D) The pattern of the logistic regression model correlated with the AUC scores and was identified by a Gaussian mixture model. There are nine clusters of 8191 combinations. (E) Venn diagram of the shared genes by comparing LASSO model to GMM model. (F-H) Principal component analysis, risk score distribution, and survival status distribution for virus-related HCCs from TCGA-LIHC database. (I) Kaplan-Meier analysis of the OS between the high group and low group. (J) Co-expression network of the hub IRGs. (K) Expression patterns of 6 hub prognostic IRGs in high- and low-risk groups. (L) Alluvial diagram of subgroup distributions in groups with different IRG scores and clinical outcomes. (M) ROC curves for 1 year, 3 years and 5 years. (N) ROC analysis showed that the predictive accuracy of IRG was superior to other clinical features. (O) Differences in IRG score between the three gene clusters.
Figure 6
Figure 6
A Nomogram model’ s Construction. (A) Nomogram combining pathological stage and risk score predicts 3-, and 5-years overall survival. (B–D) Calibration curves test the agreement between actual and predicted results at 1, 3, and 5 years. (E, F) Clinicopathological features and the predictive accuracy of the nomograms compared for 3−, and 5−year OS in virus-related HCC, respectively. (G, H) The DCA curves of the nomograms at 3−, and 5−year OS in HCC, separately.
Figure 7
Figure 7
Immune signatures of different risk groups. (A) Correlations between IRG and immune cell types. (B) The correlations of immune cell infiltration and the hub six genes in the risk model. (C) Comparison of immune-related scores between low-risk and high-risk groups. (D) the association between IRG and the enrichment scores of immunotherapy response-related gene signatures or (E) IRG and the expression of many immune checkpoints. (F) The differentially expressed immune checkpoint-related genes between the high- and low risk groups. *p < 0.05, **p < 0.01, ***p < 0.001, ****p < 0.0001, ns, not significant.
Figure 8
Figure 8
Risk signature-based tumor mutation burden (TMB), microsatellite instability (MSI), stemness analyses, and somatic mutation features. (A) The difference in TMB between the high- and low-risk groups. (B) Spearman’s correlation analyses between IRG and TMB. (C) Kaplan-Meier analysis of the OS between the low- and high-TMB groups. (D) The comparison of OS among four subgroups stratified by both TMB and IRG score. (E) Correlation between IRG and mRNAsi scores (RNAss). (F) Relationships between IRG and MSI. The waterfall plot showing the differences in somatic genomic mutation between (G) the high- and (H) low-risk groups. *p < 0.05, **p < 0.01, ***p < 0.001, ns, not significant.
Figure 9
Figure 9
Sensitivity to drugs in virus-related HCC patients with different inflammation-related risk score subgroups. (A) immunophenotype score (IPS) and (B) tumor immune dysfunction and exclusion (TIDE) in different IRG score groups. (C) Relationships between IRG and chemotherapeutic sensitivity. *p < 0.05, **p < 0.01, ***p < 0.001, ****p < 0.0001, ns, not significant.
Figure 10
Figure 10
Validation of expression and tumorigenicity of hub genes. (A) qRT-PCR validation of MEP1A, CCL20, ADORA2B, TNFSF9, ICAM4, and SLC7A2 in HCC and normal plasmas. (B, C) The mRNA expression level of CCL20 and SLC7A2 in HCC cell lines (SMMC7721, Huh7, HepG2, and HCCLM3) and the normal liver cell lines (WLR68, and LO2) was indicated by qRT-PCR assays. (D) The protein and (E) mRNA expression of CCL20 and SLC7A2 was analyzed by western blotting and RT-PCR in stable SMMC-7721 cells expressing-shRNA against luciferase or CCL20 and over SLC7A2. (F) Morphology of HCC cells after knockdown of CCL20 and overexpression of SLC7A2. (G) Tumorigenicity of SMMC7721-shCtrl cells and SMMC7721-shCCL20/overSLC7A2 cells in nude mice. (H) Tumor volume was measured every 3 days after tumor formation in nude mice injected with SMMC7721 cells transfected with shCtrl or shCCL20/overSLC7A2. (I, J) Tumor weight was measured in nude mice injected with SMMC7721 cells transfected with shCtrl or shCCL20/overSLC7A2 after 30 days. *p < 0.05; **p < 0.01; ***p < 0.005; ****p < 0.0001, ns, not significant.

References

    1. Tsai WL, Chung RT. Viral hepatocarcinogenesis. Oncogene (2010) 29(16):2309–24. doi: 10.1038/onc.2010.36 - DOI - PMC - PubMed
    1. Ringelhan M, McKeating Jane A, Protzer U. Viral hepatitis and liver cancer. Philos Trans R Soc Lond B Biol Sci (2017) 372(1732):20160274. doi: 10.1098/rstb.2016.0274 - DOI - PMC - PubMed
    1. Loureiro D, Tout I, Narguet S, et al. . miRNAs as potential biomarkers for viral hepatitis b and c. Viruses (2020) 12(12):1440. doi: 10.3390/v12121440 - DOI - PMC - PubMed
    1. Sadri Nahand J, Bokharaei-Salim F, Salmaninejad A, Nesaei A, Mohajeri F, Moshtzan A, et al. . microRNAs: Key players in virus-associated hepatocellular carcinoma. J Cell Physiol (2019) 234(8):12188–225. doi: 10.1002/jcp.27956 - DOI - PubMed
    1. Shlomai A, Jong YD, Rice CM. Virus associated malignancies: The role of viral hepatitis in hepatocellular carcinoma. Semin Cancer Biol (2014) 26:78–88. doi: 10.1016/j.semcancer.2014.01.004 - DOI - PMC - PubMed

LinkOut - more resources