. 2023 Mar 17:58:101912.
doi: 10.1016/j.eclinm.2023.101912. eCollection 2023 Apr.

Effect of pregnancy versus postpartum maternal isoniazid preventive therapy on infant growth in HIV-exposed uninfected infants: a post-hoc analysis of the TB APPRISE trial

Collaborators, Affiliations

Effect of pregnancy versus postpartum maternal isoniazid preventive therapy on infant growth in HIV-exposed uninfected infants: a post-hoc analysis of the TB APPRISE trial

Ashenafi S Cherkos et al. EClinicalMedicine. .

Abstract

Background: Isoniazid preventive therapy (IPT) initiation during pregnancy was associated with increased incidence of adverse pregnancy outcomes in the TB APPRISE trial. Effects of in utero IPT exposure on infant growth are unknown.

Methods: This post-hoc analysis used data from the TB APPRISE trial, a multicentre, double-blind, placebo-controlled trial, which randomised women to 28-week IPT starting in pregnancy (pregnancy-IPT) or postpartum week 12 (postpartum-IPT) in eight countries with high tuberculosis prevalence. Participants were enrolled between August 2014 and April 2016. Based on modified intent-to-treat analyses, we analysed only live-born babies who had at least one follow-up after birth and compared time to infant growth faltering between arms to 12 weeks and 48 weeks postpartum in overall and sex-stratified multivariable Cox proportional hazards regression. Factors adjusted in the final models include sex of infant, mother's baseline BMI, age in years, ART regimen, viral load, CD4 count, education, and household food insecurity.

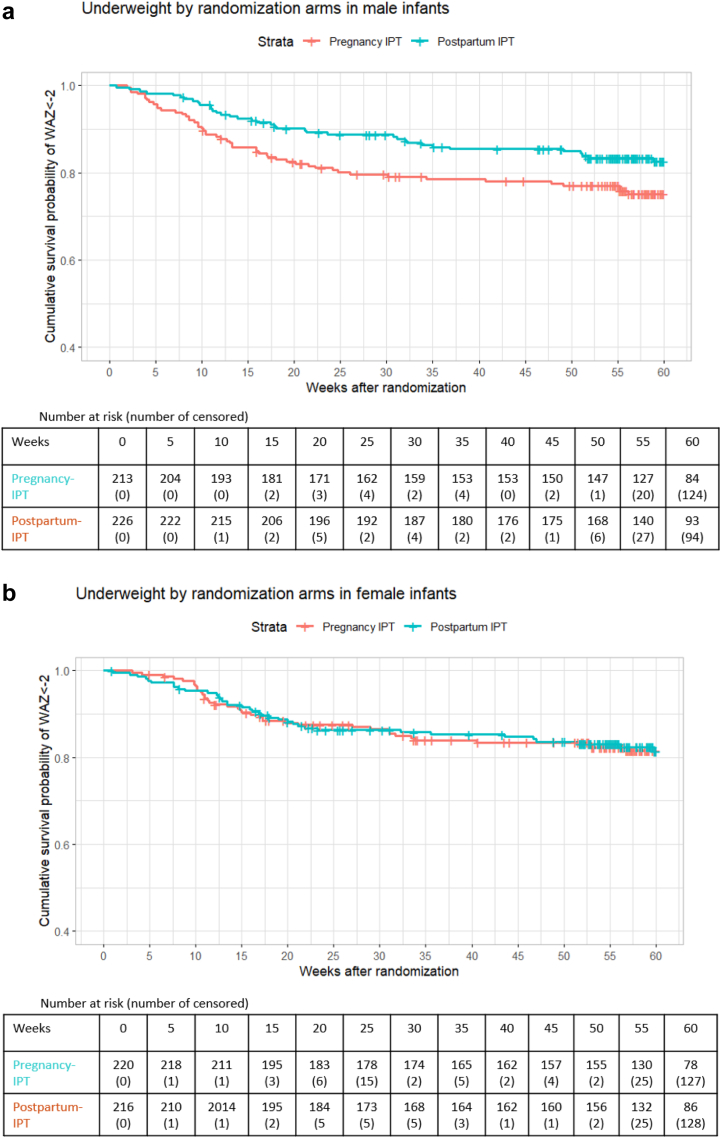
Results: Among 898 HIV-exposed uninfected (HEU) infants, 447 (49.8%) were females. Infants in pregnancy-IPT had a 1.47-fold higher risk of becoming underweight by 12 weeks (aHR 1.47 [95% CI: 1.06, 2.03]) than infants in the postpartum-IPT; increased risk persisted to 48 weeks postpartum (aHR 1.34 [95% CI: 1.01, 1.78]). Maternal IPT timing was not associated with stunting or wasting. In sex-stratified analyses, male infants in the pregnancy-IPT arm experienced an increased risk of low birth weight (LBW) (aRR 2.04 [95% CI: 1.16, 3.68), preterm birth (aRR 1.81 [95% CI: 1.04, 3.21]) and becoming underweight by 12 weeks (aHR 2.02 [95% CI: 1.29, 3.18]) and 48 weeks (aHR 1.82 [95% CI: 1.23, 2.69]). Maternal IPT timing did not influence growth in female infants.

Interpretation: Maternal IPT during pregnancy was associated with an increased risk of LBW, preterm birth, and becoming underweight among HEU infants, particularly male infants. These data add to prior TB APPRISE data, suggesting that IPT during pregnancy impacts infant growth, which could inform management, and warrants further examination of mechanisms.

Funding: The TB APPRISE study Supported by the National Institutes of Health (NIH) (award numbers, UM1AI068632 [IMPAACT LOC], UM1AI068616 [IMPAACT SDMC], and UM1AI106716 [IMPAACT LC]) through the National Institute of Allergy and Infectious Diseases, with cofunding from the Eunice Kennedy Shriver National Institute of Child Health and Human Development (contract number, HHSN275201800001I) and the National Institute of Mental Health.

Keywords: HEU growth; HEU, HIV-exposed uninfected; IPT and Adverse birth effects; IPT, Isoniazid preventive therapy; In utero IPT and growth; LAZ, Length-for-age z-score; LBW, Low birth weight; Pregnancy isoniazid; SGA, Small for gestational age; WAZ, Weight-for-age z-score; WLWH, Women living with HIV; WLZ, Weight-for-length z-score.


Conflict of interest statement

AW declares grants from GSK, Merck, and Janssen; payment for expert testimony from GSK and Merck; and participation on a data safety monitoring board for GSK, Merck, and Seqirus. All other authors declare no competing interests.

Figures

Fig. 1
Fig. 1
Figure shows enrolment, randomisation, post-hoc exclusion criteria, and analysis. This includes the number of pregnant women randomised to randomisation arms, exclusion criteria, and number of infants included in this post-hoc analysis.
Fig. 2
Fig. 2
Figure includes the Kaplan–Meier curves that show sex-stratified cumulative survival probability of underweight (defined as weight-for-age (WAZ)<-2), wasting (defined as weight-for-length (WLZ)<-2), and stunting (defined as length-for-age (LAZ)<-2) by randomised arms. For these Kaplan–Meier, time 0 was the randomisation date during pregnancy. (a) includes the Kaplan–Meier curves that show cumulative survival probability of underweight (defined as weight-for-age (WAZ)<-2) by randomised arms in male infants. For these Kaplan–Meier, time 0 was the randomisation date during pregnancy. (b) includes the Kaplan–Meier curves that show cumulative survival probability of underweight (defined as weight-for-age (WAZ)<-2) by randomised arms in female infants. For these Kaplan–Meier, time 0 was the randomisation date during pregnancy. (c) includes the Kaplan–Meier curves that show cumulative survival probability of stunting (defined as length-for-age (LAZ)<-2) by randomised arms in male infants. For these Kaplan–Meier, time 0 was the randomisation date during pregnancy. (d) includes the Kaplan–Meier curves that show cumulative survival probability of stunting (defined as length-for-age (LAZ)<-2) by randomised arms in female infants. For these Kaplan–Meier, time 0 was the randomisation date during pregnancy. (e) includes the Kaplan–Meier curves that show cumulative survival probability of wasting (defined as weight-for-length (WLZ)<-2) by randomised arms in male infants. For these Kaplan–Meier, time 0 was the randomisation date during pregnancy. (f) includes the Kaplan–Meier curves that show cumulative survival probability of wasting (defined as weight-for-length (WLZ)<-2) by randomised arms in female infants. For these Kaplan–Meier, time 0 was the randomisation date during pregnancy.
Fig. 2
Fig. 2
Figure includes the Kaplan–Meier curves that show sex-stratified cumulative survival probability of underweight (defined as weight-for-age (WAZ)<-2), wasting (defined as weight-for-length (WLZ)<-2), and stunting (defined as length-for-age (LAZ)<-2) by randomised arms. For these Kaplan–Meier, time 0 was the randomisation date during pregnancy. (a) includes the Kaplan–Meier curves that show cumulative survival probability of underweight (defined as weight-for-age (WAZ)<-2) by randomised arms in male infants. For these Kaplan–Meier, time 0 was the randomisation date during pregnancy. (b) includes the Kaplan–Meier curves that show cumulative survival probability of underweight (defined as weight-for-age (WAZ)<-2) by randomised arms in female infants. For these Kaplan–Meier, time 0 was the randomisation date during pregnancy. (c) includes the Kaplan–Meier curves that show cumulative survival probability of stunting (defined as length-for-age (LAZ)<-2) by randomised arms in male infants. For these Kaplan–Meier, time 0 was the randomisation date during pregnancy. (d) includes the Kaplan–Meier curves that show cumulative survival probability of stunting (defined as length-for-age (LAZ)<-2) by randomised arms in female infants. For these Kaplan–Meier, time 0 was the randomisation date during pregnancy. (e) includes the Kaplan–Meier curves that show cumulative survival probability of wasting (defined as weight-for-length (WLZ)<-2) by randomised arms in male infants. For these Kaplan–Meier, time 0 was the randomisation date during pregnancy. (f) includes the Kaplan–Meier curves that show cumulative survival probability of wasting (defined as weight-for-length (WLZ)<-2) by randomised arms in female infants. For these Kaplan–Meier, time 0 was the randomisation date during pregnancy.

References

    1. Gupta A., Bhosale R., Kinikar A., et al. Maternal tuberculosis: a risk factor for mother-to-child transmission of human immunodeficiency virus. J Infect Dis. 2011;203(3):358. - PMC - PubMed
    1. Marais B.J., Schaaf H.S. Tuberculosis in children. Cold Spring Harb Perspect Med. 2014;4(9) - PMC - PubMed
    1. Yuen M., Keshavjee S., Seddon J.A., et al. Risk-benefit analysis of tuberculosis infection testing for household contact management in high-burden countries: a mathematical modelling study. Lancet Global Health. 2020;8:672–680. - PMC - PubMed
    1. Ross J.M., Badje A., Rangaka M.X., et al. Isoniazid preventive therapy plus antiretroviral therapy for the prevention of tuberculosis: a systematic review and meta-analysis of individual participant data. Lancet HIV. 2021 Jan 1;8(1):e8–e15. - PMC - PubMed
    1. WHO . World Health Organization; 2020. WHO consolidated guidelines on tuberculosis: module 1: prevention: tuberculosis preventive treatment; pp. 3–4.https://www.who.int/publications/i/item/who-consolidated-guidelines-on-t... - PubMed