. 2022 Oct 25;2(10):1255-1265.
doi: 10.1158/2767-9764.CRC-22-0022. eCollection 2022 Oct.

Comprehensive Characterization of the Multiple Myeloma Immune Microenvironment Using Integrated scRNA-seq, CyTOF, and CITE-seq Analysis

Affiliations

Comprehensive Characterization of the Multiple Myeloma Immune Microenvironment Using Integrated scRNA-seq, CyTOF, and CITE-seq Analysis

Lijun Yao et al. Cancer Res Commun. .

Abstract

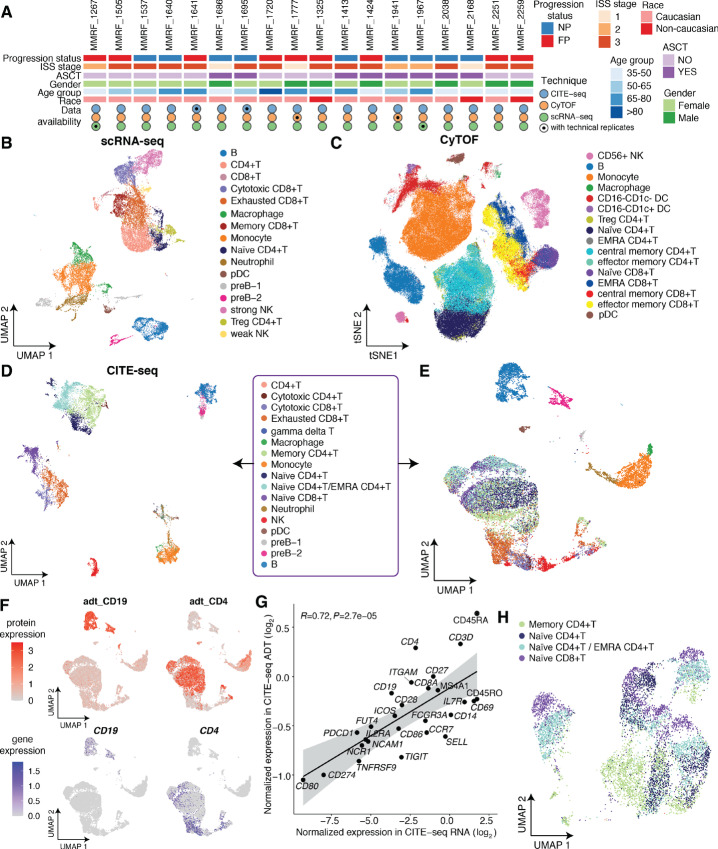
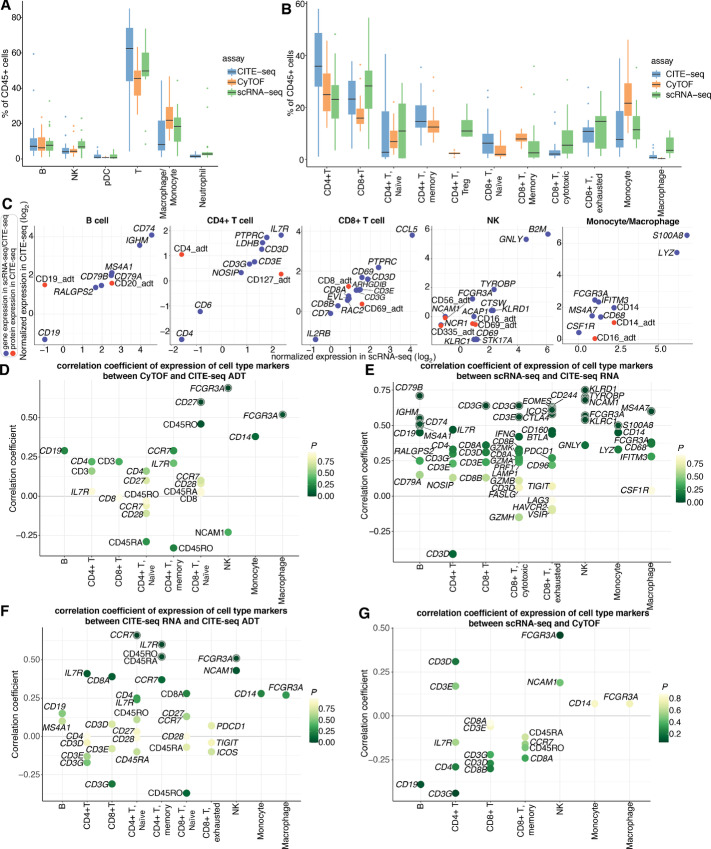
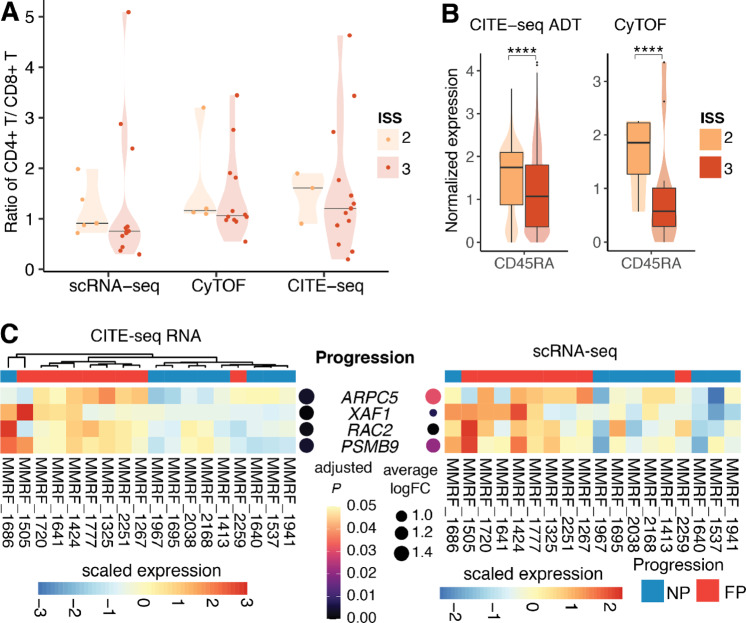
As part of the Multiple Myeloma Research Foundation (MMRF) immune atlas pilot project, we compared immune cells of multiple myeloma bone marrow samples from 18 patients assessed by single-cell RNA sequencing (scRNA-seq), mass cytometry (CyTOF), and cellular indexing of transcriptomes and epitopes by sequencing (CITE-seq) to understand the concordance of measurements among single-cell techniques. Cell type abundances are relatively consistent across the three approaches, while variations are observed in T cells, macrophages, and monocytes. Concordance and correlation analysis of cell type marker gene expression across different modalities highlighted the importance of choosing cell type marker genes best suited to particular modalities. By integrating data from these three assays, we found International Staging System stage 3 patients exhibited decreased CD4+ T/CD8+ T cells ratio. Moreover, we observed upregulation of RAC2 and PSMB9, in natural killer cells of fast progressors compared with those of nonprogressors, as revealed by both scRNA-seq and CITE-seq RNA measurement. This detailed examination of the immune microenvironment in multiple myeloma using multiple single-cell technologies revealed markers associated with multiple myeloma rapid progression which will be further characterized by the full-scale immune atlas project.

Significance: scRNA-seq, CyTOF, and CITE-seq are increasingly used for evaluating cellular heterogeneity. Understanding their concordances is of great interest. To date, this study is the most comprehensive examination of the measurement of the immune microenvironment in multiple myeloma using the three techniques. Moreover, we identified markers predicted to be significantly associated with multiple myeloma rapid progression.


Conflict of interest statement

S.K. Kumar reports other from Abbvie, Amgen, BMS, Janssen, Roche-Genentech, Takeda, AstraZeneca, Bluebird Bio, Epizyme, Secura Biotherapeutics, Monterosa therapeutics, Trillium, Loxo Oncology, K36, Sanofi, ArcellX; personal fees from ncopeptides, Beigene, Antengene, GLH Pharma; and grants from Abbvie, Amgen, Allogene, AstraZeneca, BMS, Carsgen, GSK, Janssen, Novartis, Roche-Genentech, Takeda, Regeneron, Molecular Templates outside the submitted work. H.J. Cho reports other from The Multiple Myeloma Research Foundation during the conduct of the study; grants from BMS and Takeda outside the submitted work. A.H. Rahman reports grants from Multiple Myeloma Research Foundation during the conduct of the study; grants from Celgene/BMS and personal fees from Fluidigm outside the submitted work. D. Avigan reports other from BMS, Chugai, Sanofi, Merk, and Paraexel; and grants from MMRF outside the submitted work. S. Gnjatic reports grants from Multiple Myeloma Research Foundation during the conduct of the study; grants from Regeneron, Boehringer Ingelheim, BMS, Genentech, Jannsen R&D, Takeda, and EMD Serono outside the submitted work. No disclosures were reported by the other authors.

Figures

FIGURE 1
FIGURE 1
Overview of cell populations of 18 multiple myeloma patient samples subject to scRNA-seq, CyTOF, and CITE-seq. A, Patient characteristics and single-cell data collection. FP and NP denote fast progressors and nonprogressors, respectively. ISS = International Staging System. ASCT = Autologous Stem Cell Transplantation. B, UMAP projection of integrated scRNA-seq data, with cells colored by immune cell types. C, t-SNE projection of integrated CyTOF data, with cells colored by immune cell types. D, UMAP projection of integrated CITE-seq data, with cells clustered by integrated RNA and ADT expression, colored by immune cell types. E, UMAP projection of integrated CITE-seq data, with cells clustered by transcriptional level alone, colored by immune cell identities from D. F, Comparison of canonical cell type marker gene expressions between protein level (ADT, top) and transcriptional level (RNA, bottom). Cells are colored by normalized expression. G, Concordance of sample-level average expressions of CITE-seq protein markers measured at RNA level and ADT level. The gray shaded area represents the 95% confidence interval around the line of best fit. R = Pearson correlation coefficient. H, UMAP projection of CD4+ T cells and naïve CD8+ T cells, which is the subset of integrated data in E, with cells clustered by transcriptional level alone, colored by immune cell identities from D and E.
FIGURE 2
FIGURE 2
Comparison of cell subset frequencies and correlations of expression of canonical cell type markers across different modalities. A, Main immune cell population (CD45+) frequencies observed by CITE-seq, CyTOF, and scRNA-seq. Each boxplot is colored by assay. CITE-seq populations are determined on the basis of integrated RNA and ADT expressions. B, Immune cell subtype frequencies for CITE-seq, CyTOF, and scRNA-seq. Each boxplot is colored by assay. CITE-seq populations are determined on the basis of integrated RNA and ADT expressions. C, Concordance of sample-level average expressions of canonical cell type markers in main cell subsets between scRNA-seq and CITE-seq. CITE-seq RNA and protein (ADT) level expressions are represented by blue and red dots, respectively. D, Spearman correlation coefficients of protein level expressions of cell type markers between CyTOF and CITE-seq. Each dot represents a marker gene and the color of the dot represents the P value of correlation. Markers are highlighted with an outer circle if the P value is less than 0.05. E, Spearman correlation coefficients of transcriptional level expressions of cell type markers between scRNA-seq and CITE-seq. Each dot represents a marker gene and the color of the dot represents the p value of correlation. Markers are highlighted with an outer circle if the P value is less than 0.05. F, Spearman correlation coefficients of cell type markers between transcriptional level and protein level expressions in CITE-seq. Each dot represents a marker gene and the color of the dot represents the P value of correlation. Markers are highlighted with an outer circle if the P value is less than 0.05. G, Spearman correlation coefficients of cell type markers between transcriptional level expressions from scRNA-seq and protein level expressions from CyTOF. Each dot represents a marker gene and the color of the dot represents the P value of correlation. Markers are highlighted with an outer circle if the P value is less than 0.05.
FIGURE 3
FIGURE 3
Ratio of CD4+ T/CD8+ T of patients in different ISS stages and markers associated with ISS disease stages and multiple myeloma progression. A, Violin plots showing the ratio of CD4+ T/CD8+ T of patients in ISS stage 2 and 3 in scRNA-seq, CyTOF, and CITE-seq. Horizontal lines indicate the median of data points in each group. B, Violin plots showing single cell–level normalized expression of CD45RA in CITE-seq ADT measurement and CyTOF. The difference is significant at P ≤ 0.0001 based on Wilcoxon rank-sum test. C, Heatmaps showing DEGs of NK cells of FP versus NP patients in CITE-seq RNA measurement (left) and scRNA-seq measurement (right). The samples are ordered on the basis of hierarchical clustering of expression profiles of these genes in CITE-seq RNA measurement. Expression values are scaled such that for each gene, the average of the scaled expression is 0 and the SD is 1. Adjusted P values and log fold change in CITE-seq and scRNA-seq were shown on the left and right side of DEGs, respectively. FC = fold change.

References

    1. Liu R, Gao Q, Foltz SM, Fowles JS, Yao L, Wang JT, et al. . Co-evolution of tumor and immune cells during progression of multiple myeloma. Nat Commun 2021;12:2559. - PMC - PubMed
    1. Zavidij O, Haradhvala NJ, Mouhieddine TH, Sklavenitis-Pistofidis R, Cai S, Reidy M, et al. . Single-cell RNA sequencing reveals compromised immune microenvironment in precursor stages of multiple myeloma. Nat Cancer 2020;1:493–506. - PMC - PubMed
    1. Adams HC 3rd, Stevenaert F, Krejcik J, Van der Borght K, Smets T, Bald J, et al. . High-parameter mass cytometry evaluation of relapsed/refractory multiple myeloma patients treated with daratumumab demonstrates immune modulation as a novel mechanism of action. Cytometry A 2019;95:279–89. - PMC - PubMed
    1. Redoglia V, Boccadoro M, Battaglio S, Dianzani U, Massaia M, Pileri A. Multiple myeloma: altered CD4/CD8 ratio in bone marrow. Haematologica 1990;75:129–31. - PubMed
    1. Koike M, Sekigawa I, Okada M, Matsumoto M, Iida N, Hashimoto H, et al. . Relationship between CD4(+)/CD8(+) T cell ratio and T cell activation in multiple myeloma: reference to IL-16. Leuk Res 2002;26:705–11. - PubMed

Publication types