. 2023 Mar:57:101877.
doi: 10.1016/j.eclinm.2023.101877. Epub 2023 Mar 6.

Ethnic inequalities in COVID-19 infection, hospitalisation, intensive care admission, and death: a global systematic review and meta-analysis of over 200 million study participants

Affiliations

Ethnic inequalities in COVID-19 infection, hospitalisation, intensive care admission, and death: a global systematic review and meta-analysis of over 200 million study participants

Patricia Irizar et al. EClinicalMedicine. 2023 Mar.

Abstract

Background: COVID-19 has exacerbated existing ethnic inequalities in health. Little is known about whether inequalities in severe disease and deaths, observed globally among minoritised ethnic groups, relates to greater infection risk, poorer prognosis, or both. We analysed global data on COVID-19 clinical outcomes examining inequalities between people from minoritised ethnic groups compared to the ethnic majority group.

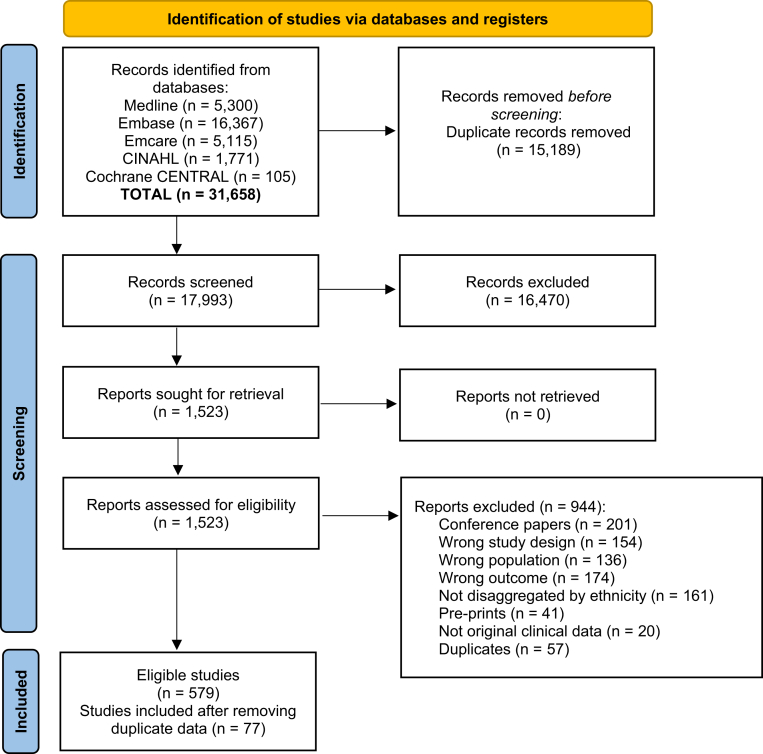
Methods: Databases (MEDLINE, EMBASE, EMCARE, CINAHL, Cochrane Library) were searched from 1st December 2019 to 3rd October 2022, for studies reporting original clinical data for COVID-19 outcomes disaggregated by ethnicity: infection, hospitalisation, intensive care unit (ICU) admission, and mortality. We assessed inequalities in incidence and prognosis using random-effects meta-analyses, with Grading of Recommendations Assessment, Development, and Evaluation (GRADE) use to assess certainty of findings. Meta-regressions explored the impact of region and time-frame (vaccine roll-out) on heterogeneity. PROSPERO: CRD42021284981.

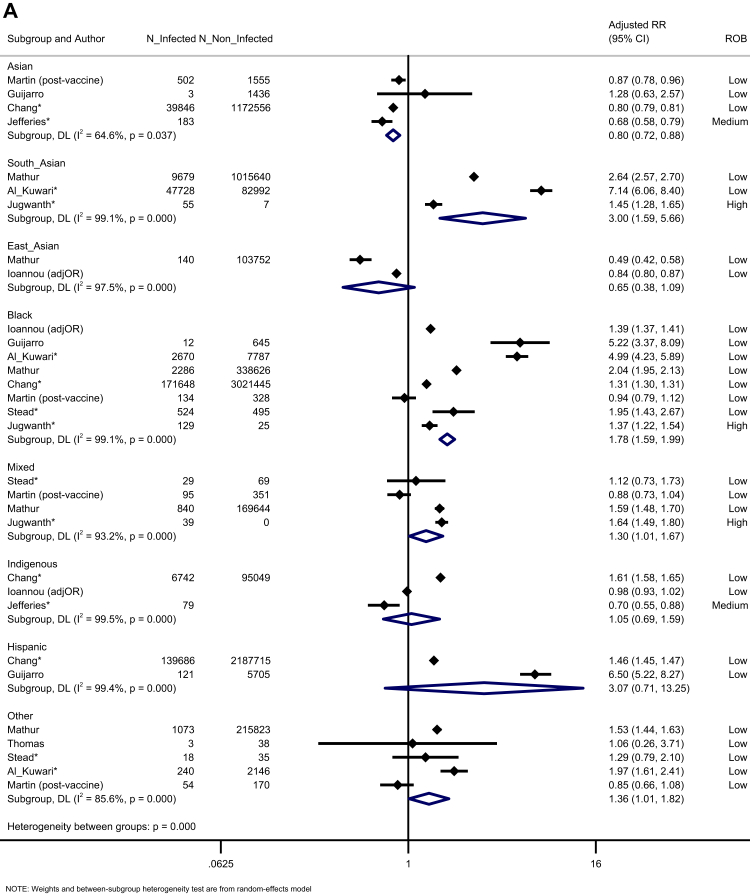
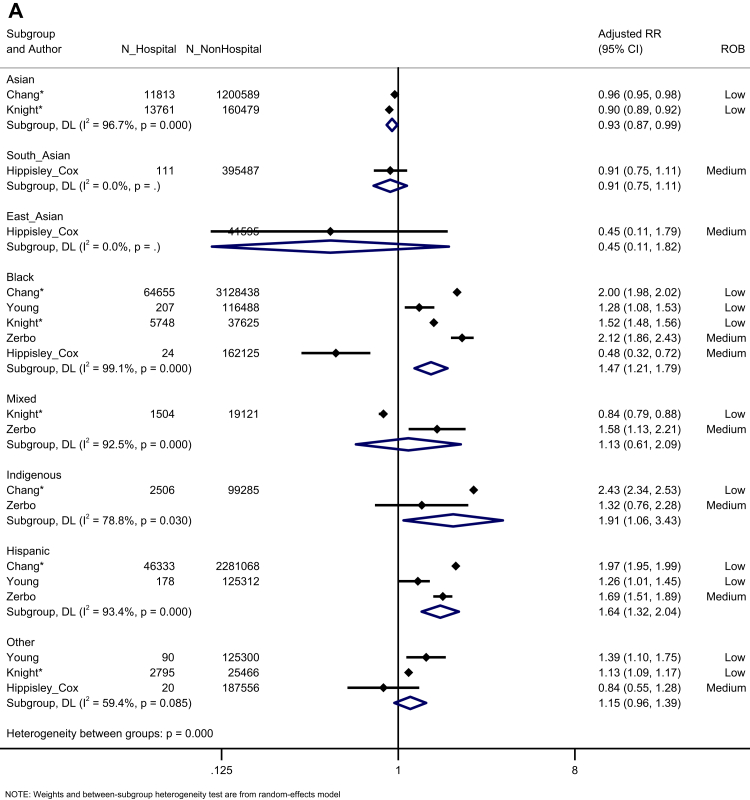
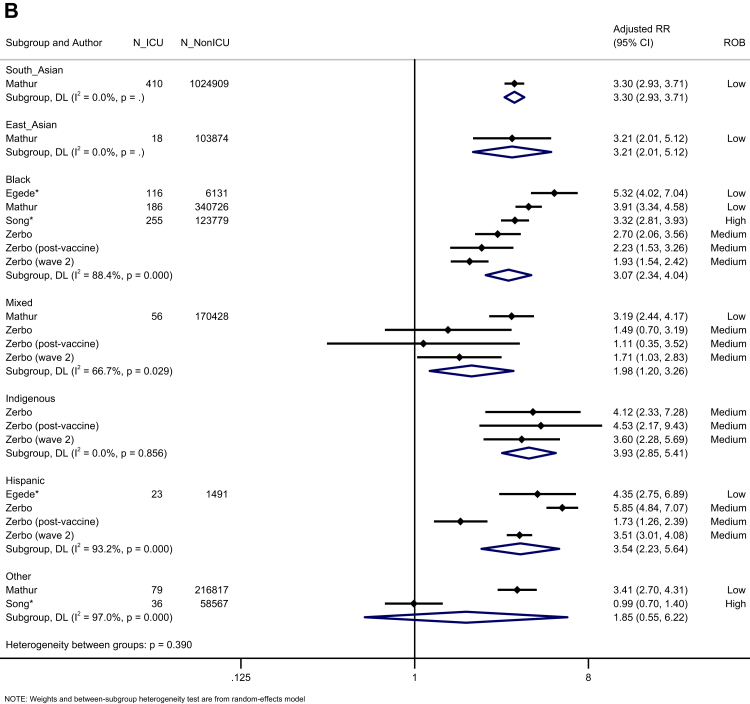
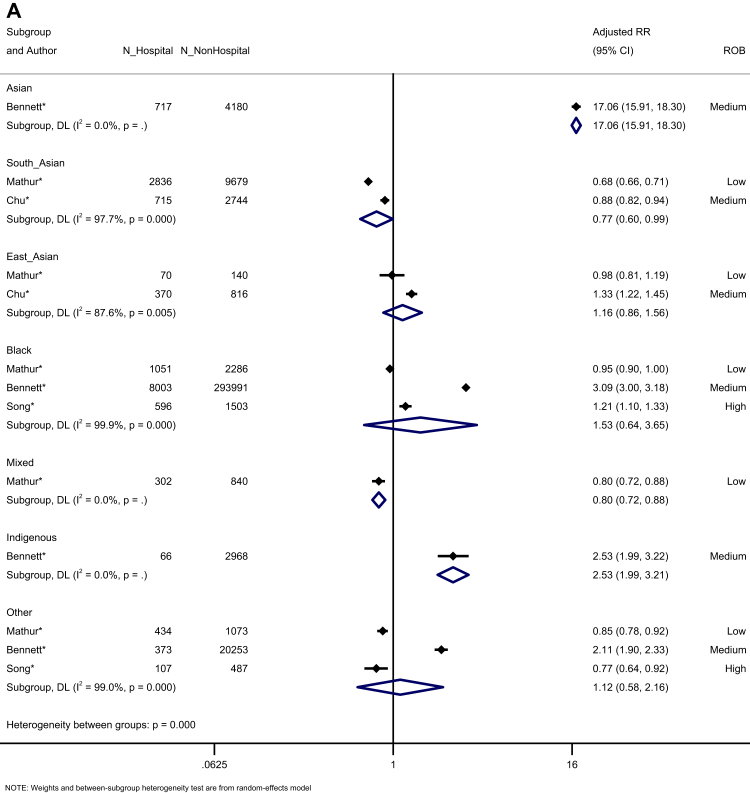
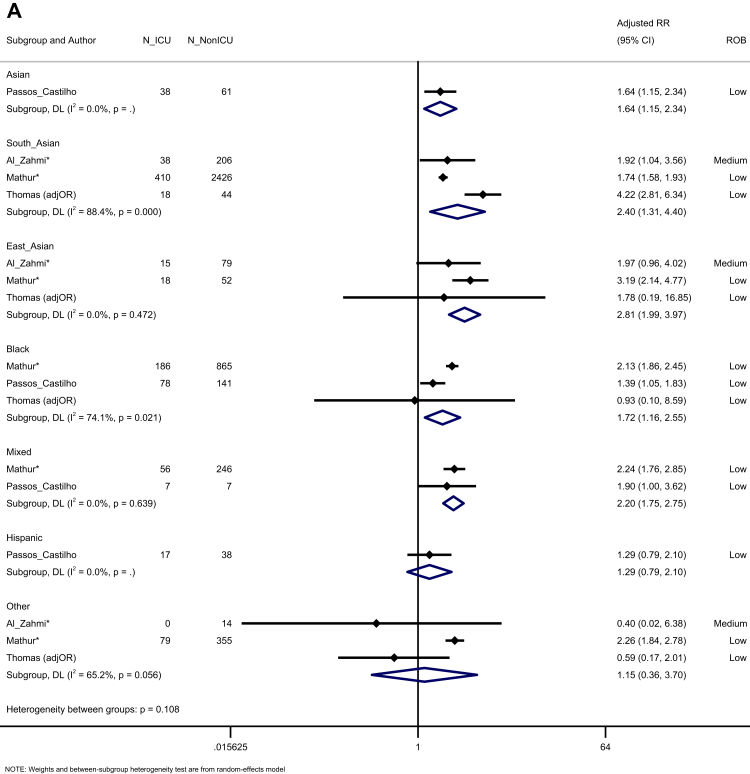
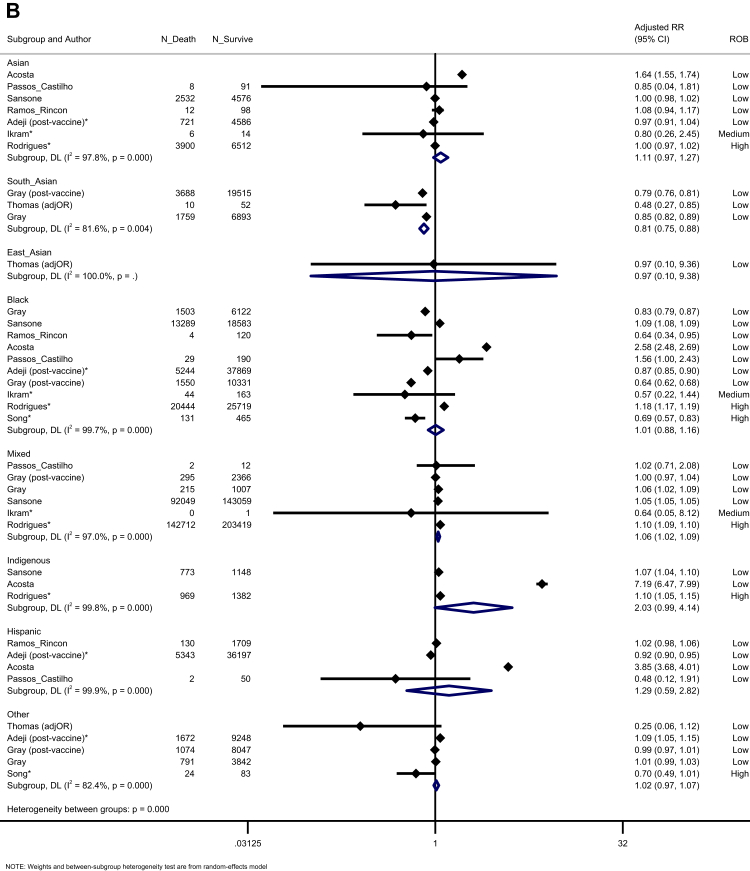
Findings: 77 studies comprising over 200,000,000 participants were included. Compared with White majority populations, we observed an increased risk of testing positive for infection for people from Black (adjusted Risk Ratio [aRR]:1.78, 95% CI:1.59-1.99, I2 = 99.1), South Asian (aRR:3.00, 95% CI:1.59-5.66, I2 = 99.1), Mixed (aRR:1.64, 95% CI:1.02-1.67, I2 = 93.2) and Other ethnic groups (aRR:1.36, 95% CI:1.01-1.82, I2 = 85.6). Black, Hispanic, and South Asian people were more likely to be seropositive. Among population-based studies, Black and Hispanic ethnic groups and Indigenous peoples had an increased risk of hospitalisation; Black, Hispanic, South Asian, East Asian and Mixed ethnic groups and Indigenous peoples had an increased risk of ICU admission. Mortality risk was increased for Hispanic, Mixed, and Indigenous groups. Smaller differences were seen for prognosis following infection. Following hospitalisation, South Asian, East Asian, Black and Mixed ethnic groups had an increased risk of ICU admission, and mortality risk was greater in Mixed ethnic groups. Certainty of evidence ranged from very low to moderate.

Interpretation: Our study suggests that systematic ethnic inequalities in COVID-19 health outcomes exist, with large differences in exposure risk and some differences in prognosis following hospitalisation. Response and recovery interventions must focus on tackling drivers of ethnic inequalities which increase exposure risk and vulnerabilities to severe disease, including structural racism and racial discrimination.

Funding: ESRC:ES/W000849/1.

Keywords: COVID-19; Ethnicity; Meta-analysis; Prognosis; SARS-CoV-2; Systematic review.


Conflict of interest statement

SVK was co-chair of the Scottish Government's Expert Reference Group on Ethnicity and COVID-19 and a member of the Scientific Advisory Group on Emergencies (SAGE) subgroup on ethnicity. MP reports grants from 10.13039/100004339Sanofi and 10.13039/100005564Gilead Sciences and personal fees from QIAGEN, outside the submitted work.

Figures

Fig. 1
Fig. 1
PRISMA flow diagram indicating the identification of studies via databases and registers. (∗) unadjusted risk ratio used (adjOR) adjusted odds ratio used (unadjOR) unadjusted odds ratio used. R: Risk Ratio. ROB: Risk of Bias.
Fig. 2
Fig. 2
Forest plot showing the pooled effect sizes for the risk of infection (compared to White ethnicity) for each ethnic group (A) and the pooled effect sizes for the risk of seropositivity (compared to majority White ethnic group) for each minoritised ethnic group (B). (∗) unadjusted risk ratio used (adjOR) adjusted odds ratio used (unadjOR) unadjusted odds ratio used. R: Risk Ratio. ROB: Risk of Bias.
Fig. 2
Fig. 2
Forest plot showing the pooled effect sizes for the risk of infection (compared to White ethnicity) for each ethnic group (A) and the pooled effect sizes for the risk of seropositivity (compared to majority White ethnic group) for each minoritised ethnic group (B). (∗) unadjusted risk ratio used (adjOR) adjusted odds ratio used (unadjOR) unadjusted odds ratio used. R: Risk Ratio. ROB: Risk of Bias.
Fig. 3
Fig. 3
Forest plot showing the pooled effect sizes for the risk of hospital admission (compared to White majority ethnic group) in the general population (A); the pooled effect sizes for the risk of ICU admission (compared to White majority ethnic group) in the general population (B) and the pooled effect sizes for the risk of mortality (compared to White majority ethnic group) in the general population (C). (∗) unadjusted risk ratio used (adjOR) adjusted odds ratio used (unadjOR) unadjusted odds ratio used. R: Risk Ratio. ROB: Risk of Bias.
Fig. 3
Fig. 3
Forest plot showing the pooled effect sizes for the risk of hospital admission (compared to White majority ethnic group) in the general population (A); the pooled effect sizes for the risk of ICU admission (compared to White majority ethnic group) in the general population (B) and the pooled effect sizes for the risk of mortality (compared to White majority ethnic group) in the general population (C). (∗) unadjusted risk ratio used (adjOR) adjusted odds ratio used (unadjOR) unadjusted odds ratio used. R: Risk Ratio. ROB: Risk of Bias.
Fig. 4
Fig. 4
Forest plot showing the pooled effect sizes for the risk of hospitalisation (compared to White majority ethnic group) in confirmed COVID-19 cases (A); the pooled effect sizes for the risk of ICU admission (compared to White majority ethnic group) in confirmed COVID-19 cases (B); and the pooled effect sizes for the risk of mortality (compared to White majority ethnic group) in confirmed COVID-19 cases (C). (∗) unadjusted risk ratio used (adjOR) adjusted odds ratio used (unadjOR) unadjusted odds ratio used. R: Risk Ratio. ROB: Risk of Bias.
Fig. 4
Fig. 4
Forest plot showing the pooled effect sizes for the risk of hospitalisation (compared to White majority ethnic group) in confirmed COVID-19 cases (A); the pooled effect sizes for the risk of ICU admission (compared to White majority ethnic group) in confirmed COVID-19 cases (B); and the pooled effect sizes for the risk of mortality (compared to White majority ethnic group) in confirmed COVID-19 cases (C). (∗) unadjusted risk ratio used (adjOR) adjusted odds ratio used (unadjOR) unadjusted odds ratio used. R: Risk Ratio. ROB: Risk of Bias.
Fig. 5
Fig. 5
Forest plot showing the pooled effect sizes for the risk of ICU admission (compared to White majority ethnic group) in hospitalised patients with COVID-19 (A); the pooled effect sizes for the risk of mortality (compared to White majority ethnic group) in hospitalised patients with COVID-19 (B). (∗) unadjusted risk ratio used (adjOR) adjusted odds ratio used (unadjOR) unadjusted odds ratio used. R: Risk Ratio. ROB: Risk of Bias.
Fig. 5
Fig. 5
Forest plot showing the pooled effect sizes for the risk of ICU admission (compared to White majority ethnic group) in hospitalised patients with COVID-19 (A); the pooled effect sizes for the risk of mortality (compared to White majority ethnic group) in hospitalised patients with COVID-19 (B). (∗) unadjusted risk ratio used (adjOR) adjusted odds ratio used (unadjOR) unadjusted odds ratio used. R: Risk Ratio. ROB: Risk of Bias.

References

    1. Patel P., Hiam L., Sowemimo A., Devakumar D., McKee M. Ethnicity and covid-19. BMJ. 2020;369:m2282. - PubMed
    1. Pareek M., Bangash M.N., Pareek N., et al. Ethnicity and COVID-19: an urgent public health research priority. Lancet. 2020;395(10234):1421–1422. - PMC - PubMed
    1. Khunti K., Singh A.K., Pareek M., Hanif W. Is ethnicity linked to incidence or outcomes of COVID-19? BMJ. 2020;369:m1548. - PubMed
    1. Mathur R., Rentsch C.T., Morton C.E., et al. Ethnic differences in SARS-CoV-2 infection and COVID-19-related hospitalisation, intensive care unit admission, and death in 17 million adults in England: an observational cohort study using the OpenSAFELY platform. Lancet. 2021;397(10286):1711–1724. - PMC - PubMed
    1. Public Health England . 2020. Disparities in the risk and outcomes of COVID-19.