. 2023 Mar 10;5(2):fcad061.
doi: 10.1093/braincomms/fcad061. eCollection 2023.

Structural MRI predicts clinical progression in presymptomatic genetic frontotemporal dementia: findings from the GENetic Frontotemporal dementia Initiative cohort

Collaborators, Affiliations

Structural MRI predicts clinical progression in presymptomatic genetic frontotemporal dementia: findings from the GENetic Frontotemporal dementia Initiative cohort

Martina Bocchetta et al. Brain Commun. .

Abstract

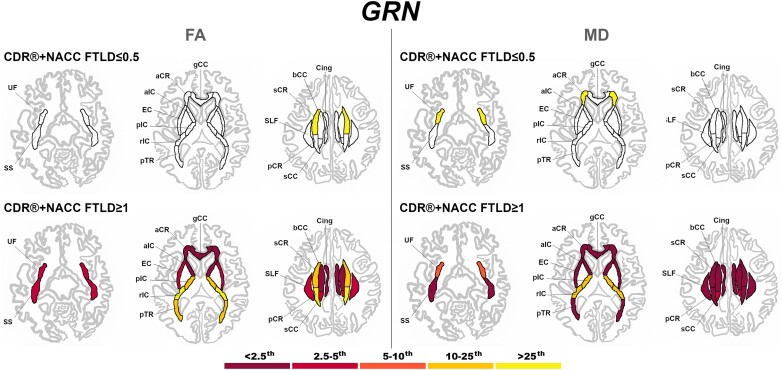
Biomarkers that can predict disease progression in individuals with genetic frontotemporal dementia are urgently needed. We aimed to identify whether baseline MRI-based grey and white matter abnormalities are associated with different clinical progression profiles in presymptomatic mutation carriers in the GENetic Frontotemporal dementia Initiative. Three hundred eighty-seven mutation carriers were included (160 GRN, 160 C9orf72, 67 MAPT), together with 240 non-carrier cognitively normal controls. Cortical and subcortical grey matter volumes were generated using automated parcellation methods on volumetric 3T T1-weighted MRI scans, while white matter characteristics were estimated using diffusion tensor imaging. Mutation carriers were divided into two disease stages based on their global CDR®+NACC-FTLD score: presymptomatic (0 or 0.5) and fully symptomatic (1 or greater). The w-scores in each grey matter volumes and white matter diffusion measures were computed to quantify the degree of abnormality compared to controls for each presymptomatic carrier, adjusting for their age, sex, total intracranial volume, and scanner type. Presymptomatic carriers were classified as 'normal' or 'abnormal' based on whether their grey matter volume and white matter diffusion measure w-scores were above or below the cut point corresponding to the 10th percentile of the controls. We then compared the change in disease severity between baseline and one year later in both the 'normal' and 'abnormal' groups within each genetic subtype, as measured by the CDR®+NACC-FTLD sum-of-boxes score and revised Cambridge Behavioural Inventory total score. Overall, presymptomatic carriers with normal regional w-scores at baseline did not progress clinically as much as those with abnormal regional w-scores. Having abnormal grey or white matter measures at baseline was associated with a statistically significant increase in the CDR®+NACC-FTLD of up to 4 points in C9orf72 expansion carriers, and 5 points in the GRN group as well as a statistically significant increase in the revised Cambridge Behavioural Inventory of up to 11 points in MAPT, 10 points in GRN, and 8 points in C9orf72 mutation carriers. Baseline regional brain abnormalities on MRI in presymptomatic mutation carriers are associated with different profiles of clinical progression over time. These results may be helpful to inform stratification of participants in future trials.

Keywords: MRI imaging; brain volumetry; diffusion imaging; genetic frontotemporal dementia; presymptomatic stage.


Conflict of interest statement

The authors report no competing interests.

Figures

Graphical abstract
Graphical abstract
Figure 1
Figure 1
Regions of interest used in the grey and white matter analyses. Abbreviations. Cortex: VMPFC, ventromedial prefrontal; TP, temporal pole; MT, medial temporal; CING, cingulate; MOT, motor; S, sensory; MP, medial parietal; OCC, occipital; DLPFC, dorsolateral prefrontal; OF, orbitofrontal; INS, insula; DLT, dorsolateral temporal; LP, lateral parietal. Basal ganglia and basal forebrain: GP, pallidum; CAU, caudate; PUT, putamen; BF, basal forebrain; NA, nucleus accumbens. Brainstem and cerebellum: SCP, superior cerebellar peduncle; MB, midbrain; ME, medulla; VIIA-CI lobule, VIIA-Crus I; VIIA-CII lobule, VIIA-Crus II; DN, deep nuclei. Amygdala: CAT, cortico-amygdaloid transition area; Sup, superficial nuclei; AB, accessory basal nucleus. Hippocampus: DG, dentate gyrus; CA, cornu ammonis. Thalamus: AV, anteroventral; VA, ventral anterior; LD, laterodorsal; VLa, ventral lateral anterior; MD, mediodorsal; LP, lateral posterior; VLp, ventral lateral posterior; VPL, ventral posterolateral; VM, ventromedial; LGN, lateral geniculate nucleus; MGN, medial geniculate nucleus. Hypothalamus: as, anterior superior; ai, anterior inferior; s-tub, superior tuberal; i-tub, inferior tuberal; pos, posterior. White matter tracts: UF, uncinate fasciculus; SLF, superior longitudinal fasciculus; Cing, cingulum; SS, sagittal stratum; pTR, posterior thalamic radiation; aCR, anterior corona radiata; pCR, posterior corona radiata; sCR, superior corona radiata; EC, external capsule; aIC, anterior part of the internal capsule; pIC, posterior part of the internal capsule; rIC, retrolenticular part of the internal capsule; gCC, genu of the corpus callosum; bCC, body of the corpus callosum; sCC, splenium of the corpus callosum.
Figure 2
Figure 2
Pattern of grey matter involvement in C9orf72 for the stages defined by CDR®+NACC FTLD global scores. The color map indicates the percentile corresponding to the mean w-scores in each group (C9orf72 ≤ 0.5/≥1: n = 113/47), when these were statistically abnormal (i.e. significantly different from 0, t-test) when compared to controls (n = 240).
Figure 3
Figure 3
Pattern of grey matter involvement in MAPT for the stages defined by CDR®+NACC FTLD global scores. The color map indicates the percentile corresponding to the mean w-scores in each group (MAPT ≤0.5/≥1: n = 52/15), when these were statistically abnormal (i.e. significantly different from 0, t-test) when compared to controls (n = 240).
Figure 4
Figure 4
Pattern of grey matter involvement in GRN for the stages defined by CDR®+NACC FTLD global scores. The color map indicates the percentile corresponding to the mean w-scores in each group (GRN ≤0.5/≥1: n = 130/30), when these were statistically abnormal (i.e. significantly different from 0, t-test) when compared to controls (n = 240).
Figure 5
Figure 5
Pattern of white matter involvement in C9orf72 for the stages defined by CDR®+NACC FTLD global scores. FA indexes are reported on the left side of the figure, while MD on the right. The color map indicates the percentile corresponding to the mean w-scores in each group (C9orf72 ≤ 0.5/≥1: n = 113/47), when these were statistically abnormal (i.e. significantly different from 0, t-test) when compared to controls (n = 240).
Figure 6
Figure 6
Pattern of white matter involvement in MAPT for the stages defined by CDR®+NACC FTLD global scores. FA indexes are reported on the left side of the figure, while MD on the right. The color map indicates the percentile corresponding to the mean w-scores in each group (MAPT ≤0.5/≥1: n = 52/15), when these were statistically abnormal (i.e. significantly different from 0, t-test) when compared to controls (n = 240).
Figure 7
Figure 7
Pattern of white matter involvement in GRN for the stages defined by CDR®+NACC FTLD global scores. FA indexes are reported on the left side of the figure, while MD on the right. The color map indicates the percentile corresponding to the mean w-scores in each group (GRN ≤0.5/≥1: n = 130/30), when these were statistically abnormal (i.e. significantly different from 0, t-test) when compared to controls (n = 240).
Figure 8
Figure 8
Longitudinal changes in the CDR®+NACC FTLD sum of boxes scores (first row) and CBI-R total scores (second row) in the presymptomatic mutation carriers for those with w-scores of the whole brain volume above (‘normal’ in black) and below (‘abnormal’ in red) the 10th percentile of the controls. Asterisks indicate a significant difference in progression between visits within the two groups at Wilcoxon Signed Rank exact test (P ≤ 0.05). Bars indicate the 95% confidence intervals of the mean. Analyses were performed on: C9orf72 n = 56; MAPT n = 32; GRN n = 69.
Figure 9
Figure 9
Largest longitudinal changes in the CDR®+NACC FTLD sum of boxes scores (first row) and CBI-R total scores (second row) in the presymptomatic mutation carriers for those with ‘normal’ and ‘abnormal’ w-scores for GM and WM regions. Y-axis represents estimated marginalized means. Asterisks indicate a significant difference in progression between visits within the two groups at Wilcoxon Signed Rank exact test (P ≤ 0.05). Bars indicate the 95% confidence intervals of the mean. Analyses were performed on: C9orf72 n = 56; MAPT n = 32; GRN n = 69. Abbreviations. DLPFC, dorsolateral prefrontal; VMPFC, ventromedial prefrontal; MED PARIETAL, medial parietal, FA, fractional anisotropy; MD, mean diffusivity; UF, uncinate fasciculus; SS, sagittal stratum; gCC, genu of the corpus callosum; sCR, superior corona radiata; aCR, anterior corona radiata.

References

    1. Warren JD, Rohrer JD, Rossor MN. Clinical review. Frontotemporal dementia. BMJ. 2013;347:f4827. - PMC - PubMed
    1. Rohrer JD, Nicholas JM, Cash DM, et al. . Presymptomatic cognitive and neuroanatomical changes in genetic frontotemporal dementia in the genetic frontotemporal dementia initiative (GENFI) study: A cross-sectional analysis. Lancet Neurol. 2015;14(3):253–262. - PMC - PubMed
    1. Jiskoot LC, Bocchetta M, Nicholas JM, et al. . Presymptomatic white matter integrity loss in familial frontotemporal dementia in the GENFI cohort: A cross-sectional diffusion tensor imaging study. Ann Clin Transl Neurol. 2018;5(9):1025–1036. - PMC - PubMed
    1. Chen Q, Kantarci K. Imaging biomarkers for neurodegeneration in presymptomatic familial frontotemporal lobar degeneration. Front Neurol. 2020;11:80. - PMC - PubMed
    1. Miyagawa T, Brushaber D, Syrjanen J, et al. . Utility of the global CDR® plus NACC FTLD rating and development of scoring rules: Data from the ARTFL/LEFFTDS consortium. Alzheimers Dement. 2020;16(1):106–117. - PMC - PubMed