

New insights into projected Arctic sea road: operational risks, economic values, and policy implications
- PMID: 36970048
- PMCID: PMC10026796
- DOI: 10.1007/s10584-023-03505-4
New insights into projected Arctic sea road: operational risks, economic values, and policy implications
Abstract
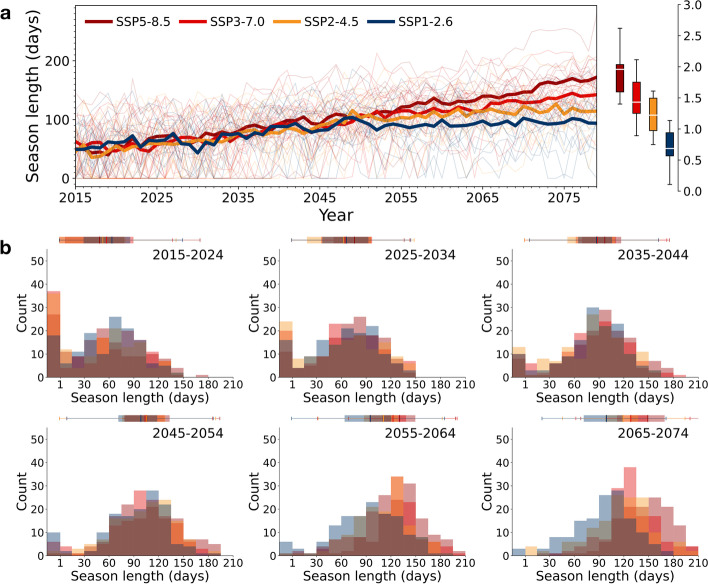
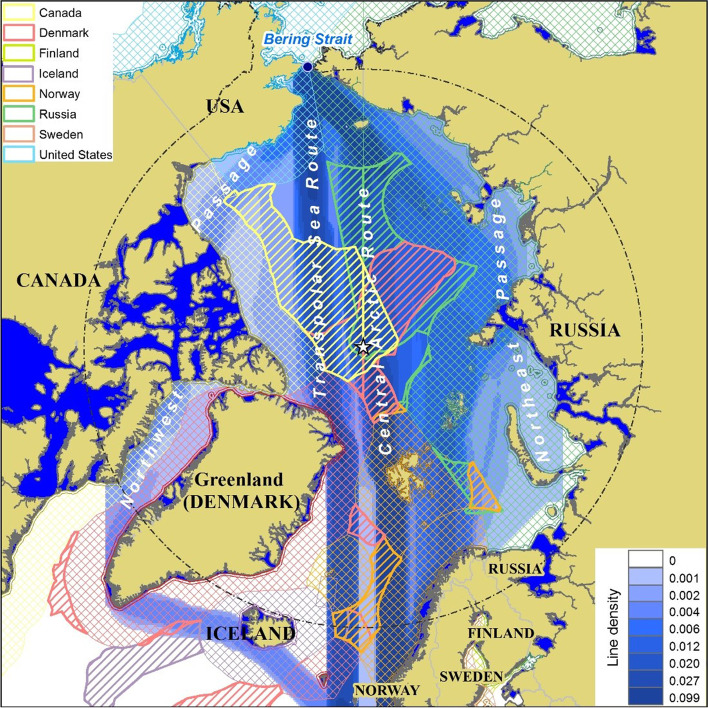
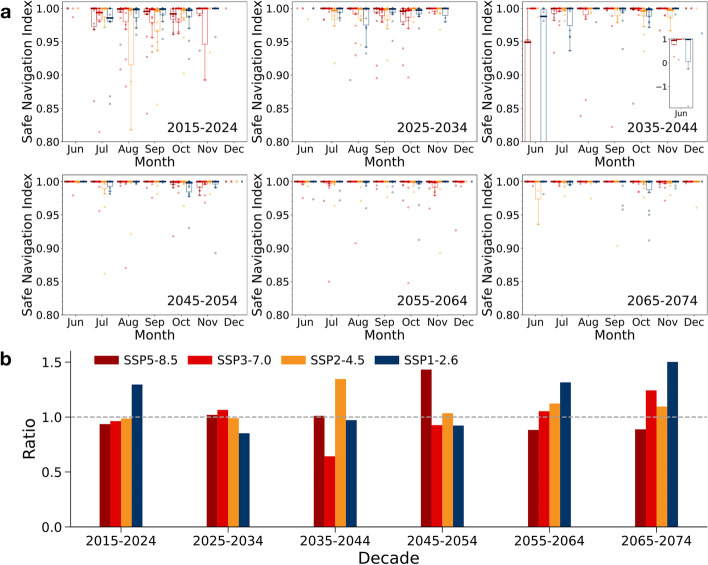
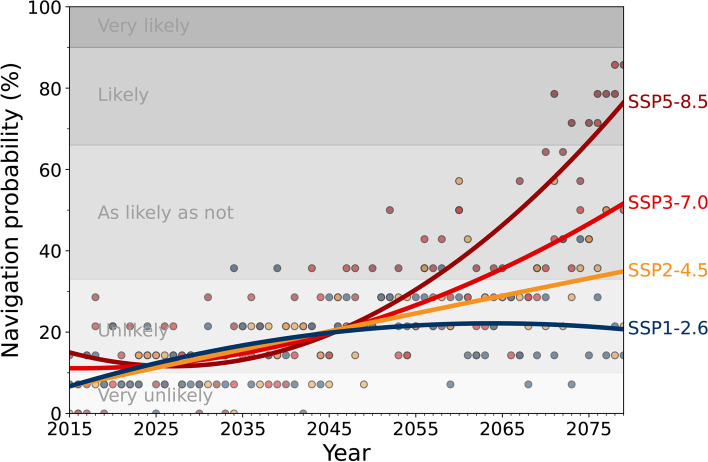
As Arctic sea ice continues to retreat, the seasonally navigable Arctic expected by mid-century or earlier is likely to facilitate the growth of polar maritime and coastal development. Here, we systematically explore the potentials for opening of trans-Arctic sea routes across a range of emissions futures and multi-model ensembles on daily timescales. We find a new Transpolar Sea Route in the western Arctic for open water vessels starting in 2045 in addition to the central Arctic corridor over the North Pole, with its frequency comparable to the latter during the 2070s under the worst-case scenario. The emergence of this new western route could be decisive for operational and strategic outcomes. Specifically, the route redistributes transits away from the Russian-administered Northern Sea Route, lowering the navigational and financial risks and the regulatory friction. Navigational risks arise from narrow straits that are often icy choke points. Financial risks arise from the substantial interannual sea ice variability and associated uncertainty. Regulatory friction arises from Russian requirements imposed under the Polar Code and Article 234 of the UN Convention on the Law of the Sea. These imposts are significantly reduced with shipping route regimes that enable open water transits wholly outside Russian territorial waters, and these regimes are revealed most accurately using daily ice information. The near-term navigability transition period (2025-2045) may offer an opportunity for maritime policy evaluation, revision, and action. Our user-inspired evaluation contributes towards achieving operational, economic and geopolitical objectives and serves the goal of planning a resilient, sustainable, and adaptive Arctic future.
Supplementary information: The online version contains supplementary material available at 10.1007/s10584-023-03505-4.
Keywords: Arctic maritime access; Geopolitics; Model uncertainty; Navigation risk and cost; Scenario analysis; Sea ice variability.
© The Author(s), under exclusive licence to Springer Nature B.V. 2023, Springer Nature or its licensor (e.g. a society or other partner) holds exclusive rights to this article under a publishing agreement with the author(s) or other rightsholder(s); author self-archiving of the accepted manuscript version of this article is solely governed by the terms of such publishing agreement and applicable law.
Conflict of interest statement
Conflict of interestThe authors declare no competing interests.
Figures
References
-
- Babb DG, Kirillov S, Galley RJ, Straneo F, Ehn JK, Howell SEL, Brady M, Ridenour NA, Barber DG. Sea Ice Dynamics in Hudson Strait and Its Impact on Winter Shipping Operations. J Geophys Res Oceans. 2021;126:e2021JC018024. doi: 10.1029/2021JC018024. - DOI
-
- Barber DG, Babb DG, Ehn JK, Chan W, Matthes L, Dalman LA, Campbell Y, Harasyn ML, Firoozy N, Theriault N, Lukovich JV, Zagon T, Papakyriakou T, Capelle DW, Forest A, Gariepy A. Increasing Mobility of High Arctic Sea Ice Increases Marine Hazards Off the East Coast of Newfoundland. Geophys Res Lett. 2018;45:2370–2379. doi: 10.1002/2017GL076587. - DOI
-
- Benestad R, Sillmann J, Thorarinsdottir TL, Guttorp P, Mesquita MdS, Tye MR, Uotila P, Maule CF, Thejll P, Drews M, Parding KM. New vigour involving statisticians to overcome ensemble fatigue. Nat Clim Chang. 2017;7:697–703. doi: 10.1038/nclimate3393. - DOI
-
- Bennett MM, Stephenson SR, Yang K, Bravo MT, De Jonghe B. The opening of the Transpolar Sea Route: Logistical, geopolitical, environmental, and socioeconomic impacts. Mar Policy. 2020;121:104178. doi: 10.1016/j.marpol.2020.104178. - DOI
LinkOut - more resources
Full Text Sources
Research Materials