. 2023 Mar 10:4:1109717.
doi: 10.3389/falgy.2023.1109717. eCollection 2023.

Sodium butyrate supresses malignant human mast cell proliferation, downregulates expression of KIT and promotes differentiation

Affiliations

Sodium butyrate supresses malignant human mast cell proliferation, downregulates expression of KIT and promotes differentiation

Clayton A MacDonald et al. Front Allergy. .

Abstract

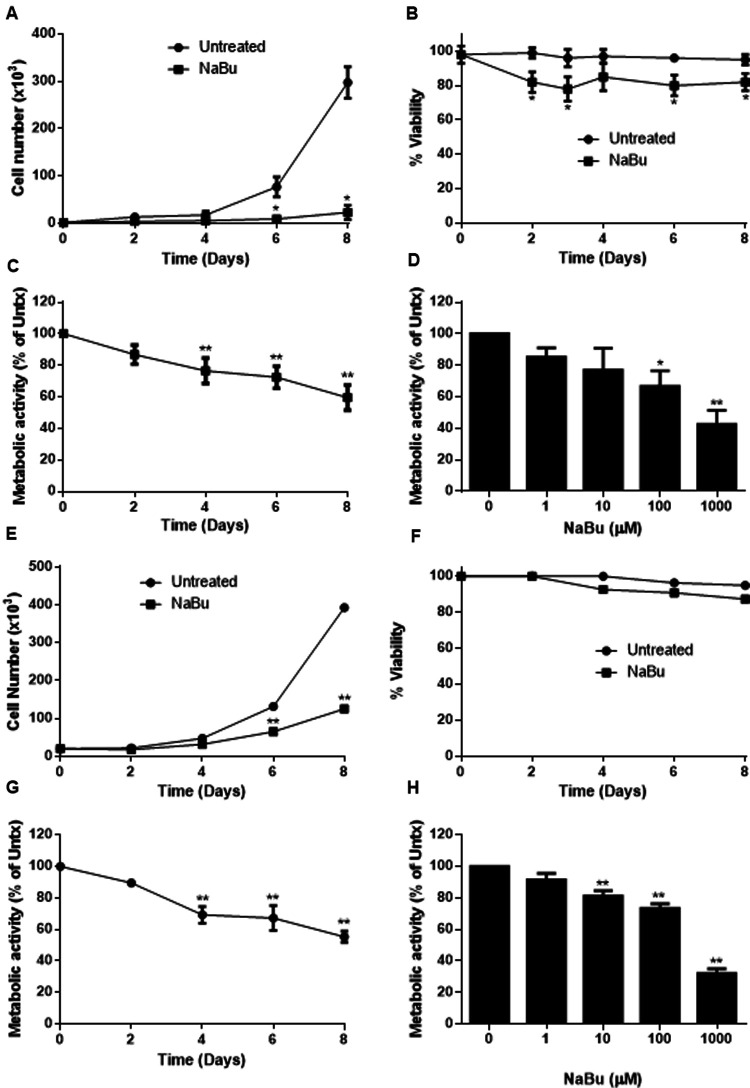
Sodium butyrate (NaBu) is a class I histone deacetylase inhibitor (HDACi) that can impede the proliferation of transformed cells. Although some HDACi downregulate the expression of the stem cell factor receptor (KIT/CD117), the effect of NaBu on KIT expression and human mast cell proliferation requires further elucidation. In this study, we examined the effects of NaBu on three transformed human mast cell lines, HMC-1.1, HMC-1.2 and LAD2. NaBu (100 µM) inhibited the proliferation and metabolic activity of all three cell lines without significantly affecting their viability, suggesting that although the cells had ceased to divide, they were not yet undergoing apoptosis. Cell cycle analysis using the cell-permeant dye, propidium iodide, indicated that NaBu significantly blocked the cell cycle progression of HMC-1.1 and HMC-1.2 from G1 to G2/M phases. Furthermore, NaBu downregulated the expression of C-KIT mRNA and KIT protein expression in all three cell lines, but this effect was most significant in the HMC-1.1 and HMC-1.2, both of which harbour activating mutations in KIT, which proliferate more rapidly than LAD2. These data support earlier observations showing that human mast cell lines are sensitive to histone deacetylase inhibition. However, our data presents the novel observation that inhibition of cell proliferation by NaBu was not associated with a loss in cell viability but rather an arrest of the cell cycle. Higher concentrations of NaBu led to modest increases in histamine content, tryptase expression, and granularity. In conclusion, NaBu treatment of human mast cell lines led to a modest enhancement of the hallmarks of mature mast cells.

Keywords: KIT; cell cycle; histone deacetylase inhibitors; proliferation; viability.


Conflict of interest statement

The authors declare that the research was conducted in the absence of any commercial or financial relationships that could be construed as a potential conflict of interest.

Figures

Figure 1
Figure 1
Sodium butyrate (NaBu) inhibits HMC-1.1 and HMC-1.2 cell proliferation and metabolic activity. HMC-1.1 cells were cultured with NaBu (100 µM) for an 8-day time course, and cell number (A) and cell viability (B) were measured (n = 3). HMC-1 cells were cultured with NaBu (100 µM) for up to 8 days, and a time course metabolic activity (C) and (D) a NaBu (0–1000 µM) dose-response experiment was performed using XTT assay (n = 5). HMC-1.2 cells were cultured with NaBu (100 µM) for an 8-day time course, and cell number (E) and cell viability (F) were measured (n = 3). (G) Cells were cultured with NaBu (100 µM) for 8 days, and a time course metabolic activity (n = 5) and (H) a NaBu (0–1000 µM) concentration course was measured using XTT assay (n = 5). *p < 0.05, **p < 0.01.
Figure 2
Figure 2
Sodium butyrate (NaBu) blocks the cell cycle in HMC-1.1 and HMC-1.2 cells. The cell cycle of untreated (A) and NaBu-treated (100 µM; B) HMC-1.1 cells were analyzed by flow cytometry for cell cycle progression. In this representative histogram, gate P2 represents cells in the G0 or G1 phase, P3 represents cells doubling their DNA content in the S phase and P4 represents cells in the G2 and M phases. HMC-1.1 (C) and HMC-1.2 (D) cells were cultured in NaBu (0–100 µM) for 24 h and the cell cycle was analyzed by propidium iodide (PI) staining of RNA and flow cytometry (n = 3). *p < 0.05, **p < 0.01.
Figure 3
Figure 3
Sodium butyrate (NaBu) inhibits KIT (gene) and KIT (protein) expression in HMC-1.1 and HMC-1.2 cells. In HMC-1.1 cells, C-KIT expression was measured using qPCR following culture in (A) NaBu (0–1000 µM) for three days or (B) NaBu (100 µM) for up to four days (n = 3). KIT protein expression was measured by flow cytometry in HMC-1 cells cultured with (C) NaBu (0–100 µM) for three days or (D) 100 µM of NaBu for up to three days (n = 3). HMC-1.2 cells were treated with NaBu (0–1000 µM) for three days (E) or NaBu (100 µM) for up to four days (F), and C-KIT expression was measured using qPCR (n = 3). KIT protein expression was measured by flow cytometry following treatment with (G) NaBu (0–100 µM) for three days or (H) NaBu (100 µM) for up to three days (n = 3). *p < 0.05, **p < 0.01. MFI = Mean Fluorescent Intensity.
Figure 4
Figure 4
Sodium butyrate (NaBu) inhibits proliferation, metabolic activity, and cell cycle in LAD2, as well as C-KIT mRNA and KIT protein expression. LAD2 cells were cultured in NaBu (100 µM) for eight days, during which (A) total cell number (n = 3) and (B) cell viability were measured (n = 3). (C) The effect of NaBu on metabolic activity was measured using XTT assay (100 µM over nine days; n = 5). (D) Cells were cultured in NaBu (0–100 µM) for 24 h, and the cell cycle was analyzed by propidium iodide staining and flow cytometry (n = 3). (E) Cells were cultured in NaBu (0–1000 µM) for three days and c-Kit expression was measured using qPCR (n = 3). (F) Cells were cultured in NaBu (100 µM) for up to four days. and C-KIT expression was measured by qPCR (n = 3). (G) Cells were cultured with NaBu (100 µM), and KIT protein expression was measured using flow cytometry (n = 3). (H) Cells were cultured with NaBu for three days, and KIT protein expression was measured using flow cytometry (n = 3). *p < 0.05, **p < 0.01.
Figure 5
Figure 5
Tryptase and histamine content of HMC-1.1 and HMC-1.2 cells treated with sodium butyrate (NaBu) and HDACi. Representative flow cytometry data from HMC-1.1 (A) or HMC-1.2 (B) cells untreated or treated with the indicated concentrations of NaBu for four days and stained with Alexa Fluor 488-conjugated secondary antibodies (2°Ab) ± anti-tryptase antibodies are shown. Number of events shown for HMC-1.1 in panel A: Unstained, 14,975; 2°Ab only, 46,482; 0 mM, 42,150; 0.1 mM, 41,745; 0.5 mM, 41,547; 1.0 mM, 39,822. Number of events shown for HMC-1.2 in panel B: Unstained, 47,209; 2°Ab only, 47,009; 0 mM, 45,657; 0.1 mM, 44,131; 0.5 mM, 43,093; 1.0 mM, 41,409. (C) Summary of the tryptase/Alexa Fluor 488 median fluorescence intensity (MFI) values obtained from untreated and NaBu-treated HMC-1.1 and HMC-1.2 cells (n = 5). (D) HMC-1.1 and HMC-1.2 cells were treated with the indicated concentrations of NaBu for four days and were assessed for histamine levels n = 7, except for 1 mM treatment where n = 3. (E) HMC-1.1 and HMC-1.2 cells were left untreated or treated with DMSO (vehicle) control, 0.5 mM NaBu, 100 nM trichostatin A (TSA), or 200 nM suberoylanilide hydroxamic acid (SAHA) for four days and were assessed for histamine levels **p < 0.01; ***p < 0.005.
Figure 6
Figure 6
Sodium butyrate (NaBu) treatment of HMC-1.1 and HMC-1.2 cells causes changes in granule phenotype. HMC-1.1 (A–F) or HMC-1.2 (G–L) cells were untreated (A and G) or treated with 0.5 mM (B and H) or 1 mM (C and I) NaBu for four days followed by fixation, sectioning, and imaging by transmission electron microscopy. (D–F) and (J–L) are corresponding enlarged images from the areas marked in red squares in (A–C) and (G–I). Five types of morphologically distinct granules in the cytoplasm are identified by white arrows: electron-dense core surrounding by sparse particulates (type I), less electron-dense and more electron-lucent (type II), uniform lumen/particulates (type III), mixture of electron-dense vesicles and particulates(type IV) and scroll-like or multi-lamellar vesicles (type V). Extracellular vesicles with electron-dense core are identified by blue arrows in F.

References

    1. Xu WS, Parmigiani RB, Marks PA. Histone deacetylase inhibitors: molecular mechanisms of action. Oncogene. (2007) 26(37):5541–52. 10.1038/sj.onc.1210620 - DOI - PubMed
    1. Milazzo G, Mercatelli D, Di Muzio G, Triboli L, De Rosa P, Perini G, et al. Histone deacetylases (HDACs): evolution, specificity, role in transcriptional complexes, and pharmacological actionability. Genes (Basel). (2020) 15;11(5):556. 10.3390/genes11050556 - DOI - PMC - PubMed
    1. Contreras-Sanzon E, Prado-Garcia H, Romero-Garcia S, Nunez-Corona D, Ortiz-Quintero B, Luna-Rivero C, et al. Histone deacetylases modulate resistance to the therapy in lung cancer. Front Genet. (2022) 13:960263. 10.3389/fgene.2022.960263 - DOI - PMC - PubMed
    1. Du G, Yang R, Qiu J, Xia J. Multifaceted influence of histone deacetylases on DNA damage repair: implications for hepatocellular carcinoma. J Clin Transl Hepatol. (2023) 11(1):231–43. - PMC - PubMed
    1. Pramanik SD, Kumar Halder A, Mukherjee U, Kumar D, Dey YN. Potential of histone deacetylase inhibitors in the control and regulation of prostate, breast and ovarian cancer. Front Chem. (2022) 10:948217. 10.3389/fchem.2022.948217 - DOI - PMC - PubMed

LinkOut - more resources