CD25bright NK cells display superior function and metabolic activity under regulatory T cell-mediated suppression
- PMID: 36970070
- PMCID: PMC10038043
- DOI: 10.1080/2162402X.2023.2175517
CD25bright NK cells display superior function and metabolic activity under regulatory T cell-mediated suppression
Abstract
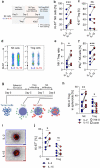
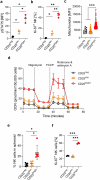
Infusion of natural killer (NK) cells is an attractive therapeutic modality in patients with cancer. However, the activity of NK cells is regulated by several mechanisms operating within solid tumors. Regulatory T (Treg) cells suppress NK cell activity through various mechanisms including deprivation of IL-2 via the IL-2 receptor alpha (CD25). Here, we investigate CD25 expression on NK cells to confer persistence in Treg cells containing solid tumor models of renal cell carcinoma (RCC). Compared with IL-2, stimulation with IL-15 increases the expression of CD25 resulting in enhanced response to IL-2 as evidenced by increased phosphorylation of STAT5. Compared with CD25dim NK cells, CD25bright NK cells isolated from IL-15 primed NK cells display increased proliferative and metabolic activity as well as increased ability to persist in Treg cells containing RCC tumor spheroids. These results support strategies to enrich for or selectively expand CD25bright NK cells for adoptive cellular therapy of NK cells.
Keywords: CD25; IL-15; Natural killer cells; regulatory T cells; tumor microenvironment.
© 2023 The Author(s). Published with license by Taylor & Francis Group, LLC.
Conflict of interest statement
The authors have no relevant competing interests to declare.
Figures


Similar articles
-
Regulatory T cells, interleukin (IL)-6, IL-8, vascular endothelial growth factor (VEGF), CXCL10, CXCL11, epidermal growth factor (EGF) and hepatocyte growth factor (HGF) as surrogate markers of host immunity in patients with renal cell carcinoma.BJU Int. 2013 Sep;112(5):686-96. doi: 10.1111/bju.12068. Epub 2013 Mar 15. BJU Int. 2013. PMID: 23495770
-
Differential effects of IL-2 and IL-21 on expansion of the CD4+ CD25+ Foxp3+ T regulatory cells with redundant roles in natural killer cell mediated antibody dependent cellular cytotoxicity in chronic lymphocytic leukemia.MAbs. 2010 Jan-Feb;2(1):35-41. doi: 10.4161/mabs.2.1.10561. Epub 2010 Jan 8. MAbs. 2010. PMID: 20081380 Free PMC article.
-
Natural killer cells prevent CD28-mediated Foxp3 transcription in CD4+CD25- T lymphocytes.Exp Hematol. 2007 Mar;35(3):416-25. doi: 10.1016/j.exphem.2006.12.004. Exp Hematol. 2007. PMID: 17309822
-
Increasing the biological activity of IL-2 and IL-15 through complexing with anti-IL-2 mAbs and IL-15Rα-Fc chimera.Immunol Lett. 2014 May-Jun;159(1-2):1-10. doi: 10.1016/j.imlet.2014.01.017. Epub 2014 Feb 7. Immunol Lett. 2014. PMID: 24512738 Review.
-
Immune modulation of T-cell and NK (natural killer) cell activities by TEXs (tumour-derived exosomes).Biochem Soc Trans. 2013 Feb 1;41(1):245-51. doi: 10.1042/BST20120265. Biochem Soc Trans. 2013. PMID: 23356291 Free PMC article. Review.
Cited by
-
A pan-cancer study of ADAM9's immunological function and prognostic value particularly in liver cancer.Sci Rep. 2024 Nov 6;14(1):26862. doi: 10.1038/s41598-024-76049-x. Sci Rep. 2024. PMID: 39505907 Free PMC article.
-
Microenvironment-based immunotherapy in oral cancer: a comprehensive review.Med Oncol. 2025 Mar 28;42(5):140. doi: 10.1007/s12032-025-02694-5. Med Oncol. 2025. PMID: 40153139 Review.
-
NK cells in renal cell carcinoma and its implications for CAR-NK therapy.Front Cell Dev Biol. 2025 Feb 20;13:1532491. doi: 10.3389/fcell.2025.1532491. eCollection 2025. Front Cell Dev Biol. 2025. PMID: 40052147 Free PMC article. Review.
-
Enhancing outcomes in medically inoperable early-stage NSCLC with gut-targeted antibiotics and stereotactic body radiotherapy: results from a randomized pilot study.J Immunother Cancer. 2025 Jul 10;13(7):e011356. doi: 10.1136/jitc-2024-011356. J Immunother Cancer. 2025. PMID: 40639850 Free PMC article. Clinical Trial.
-
Regulatory T cells in lung disease and transplantation.Biosci Rep. 2023 Oct 31;43(10):BSR20231331. doi: 10.1042/BSR20231331. Biosci Rep. 2023. PMID: 37795866 Free PMC article. Review.
References
-
- Cozar B, Greppi M, Carpentier S, Narni-Mancinelli E, Chiossone L, Vivier E. Tumor-Infiltrating natural killer cells. Cancer Discov. 2020. Dec 4;11(1):34–44. doi:10.1158/2159-8290.CD-20-0655. - DOI - PMC - PubMed
-
- Ghiringhelli F, Menard C, Terme M, Flament C, Taieb J, Chaput N, Puig PE, Novault S, Escudier B, Vivier E, et al. CD4+CD25+ regulatory T cells inhibit natural killer cell functions in a transforming growth factor-beta-dependent manner. J Experimental Med. 2005. Oct 17;202(8):1075–1085. doi:10.1084/jem.20051511. - DOI - PMC - PubMed
Publication types
MeSH terms
Substances
LinkOut - more resources
Full Text Sources
Other Literature Sources
Medical
Miscellaneous
