. 2023 Mar;13(3):1128-1144.
doi: 10.1016/j.apsb.2022.10.011. Epub 2022 Oct 13.

G protein-coupled receptor 35 attenuates nonalcoholic steatohepatitis by reprogramming cholesterol homeostasis in hepatocytes

Affiliations

G protein-coupled receptor 35 attenuates nonalcoholic steatohepatitis by reprogramming cholesterol homeostasis in hepatocytes

Xiaoli Wei et al. Acta Pharm Sin B. 2023 Mar.

Abstract

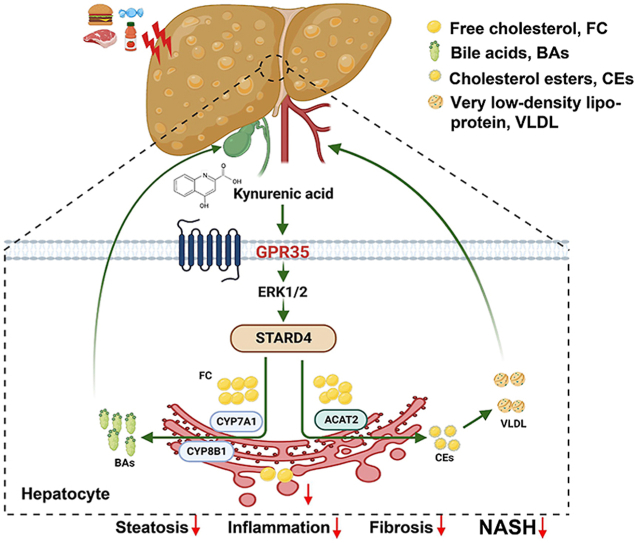
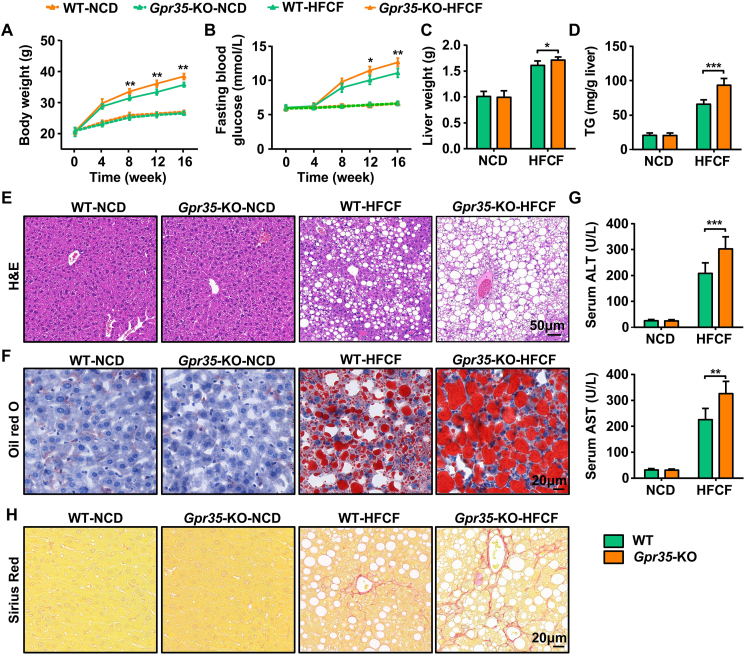
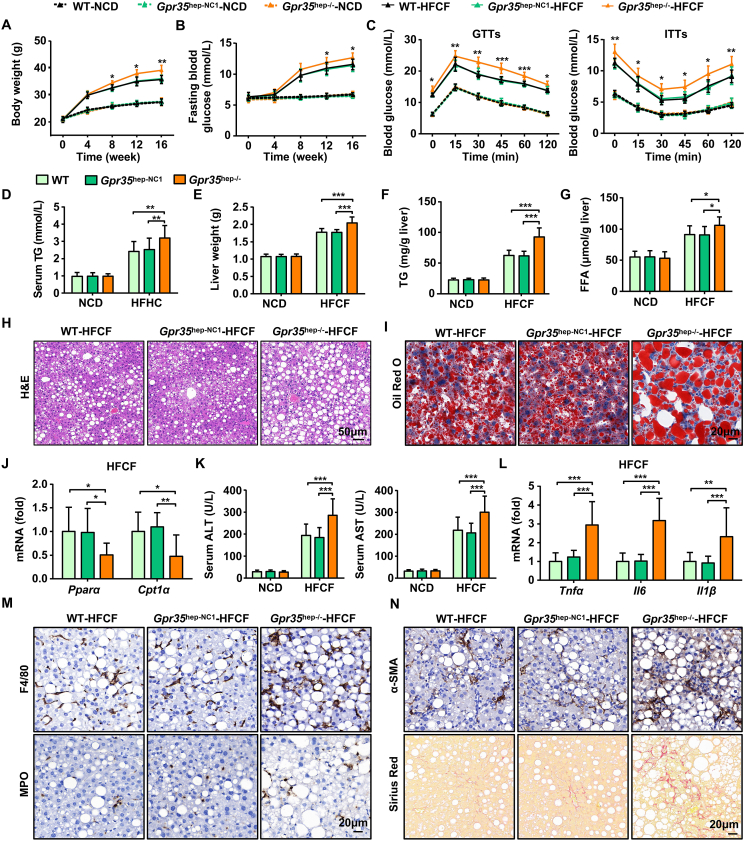
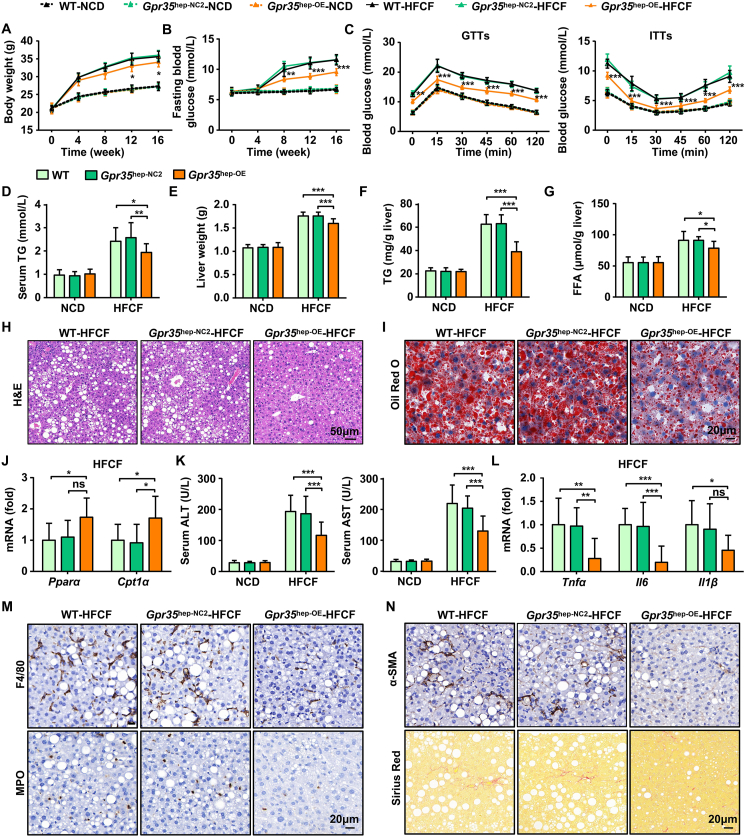
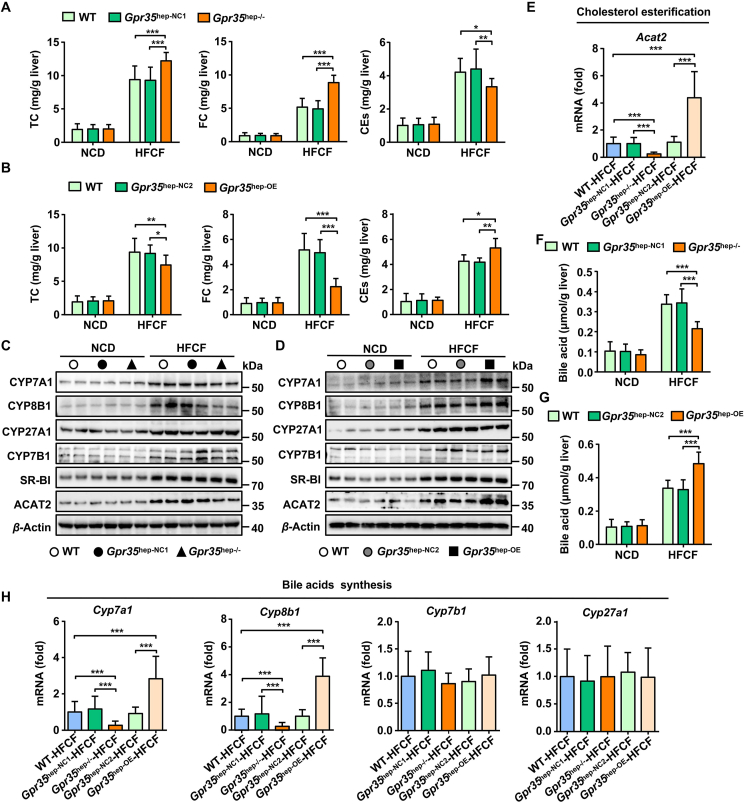
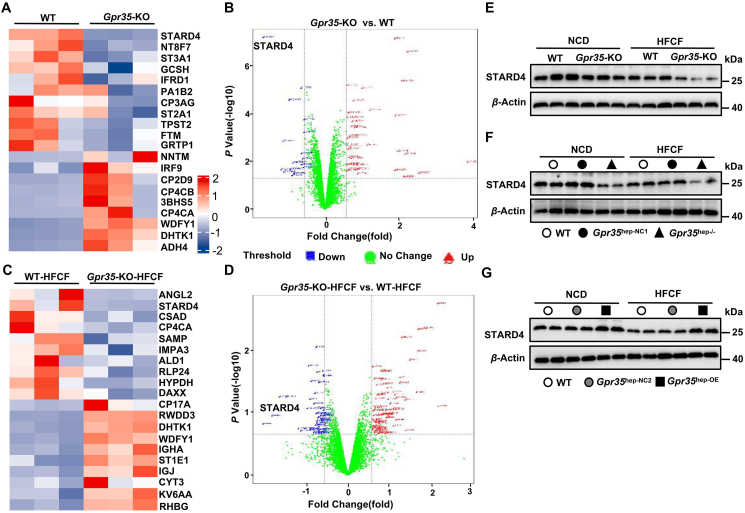
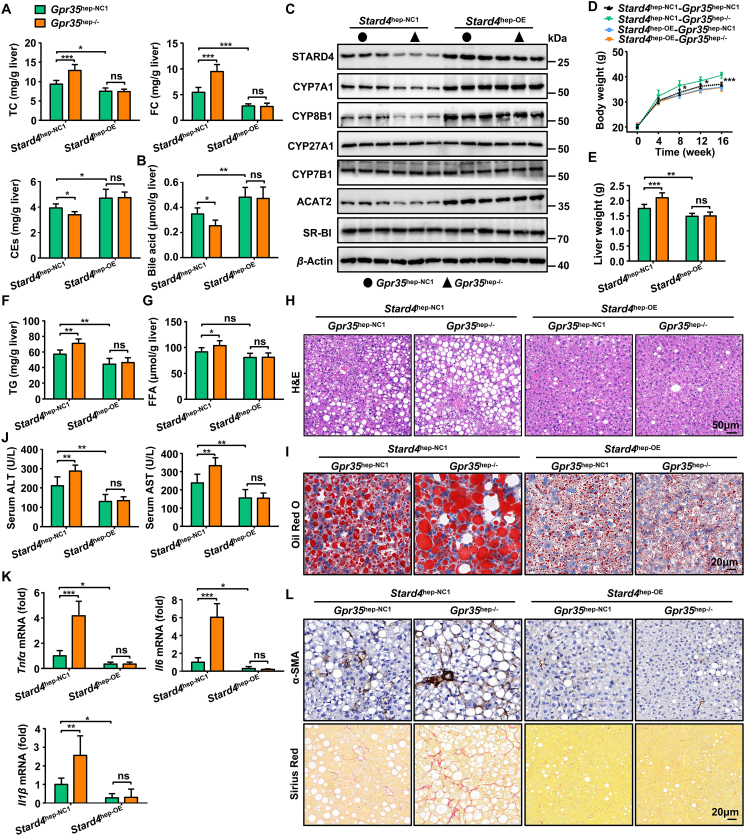
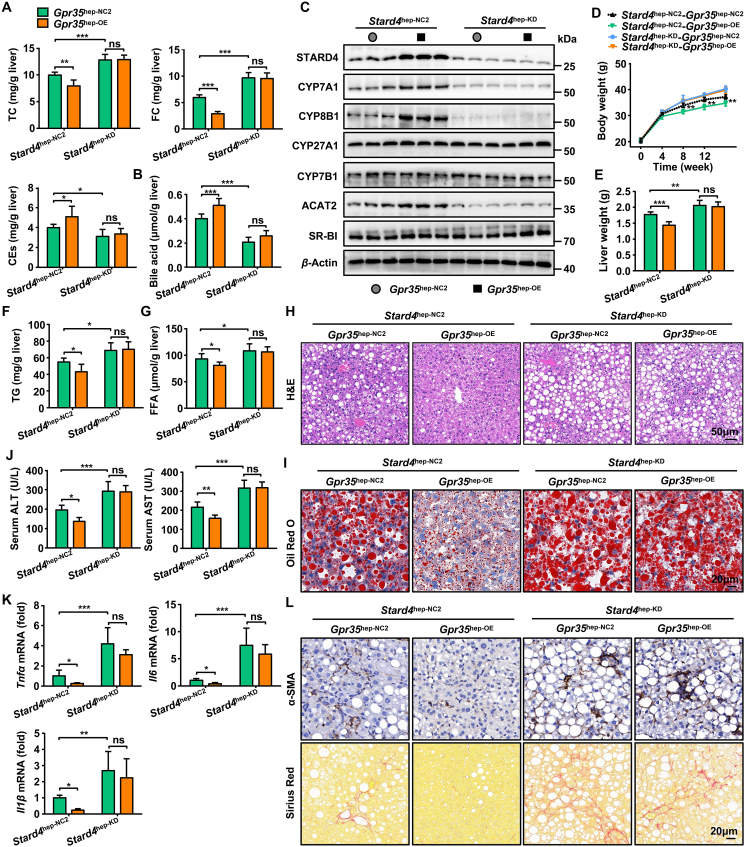
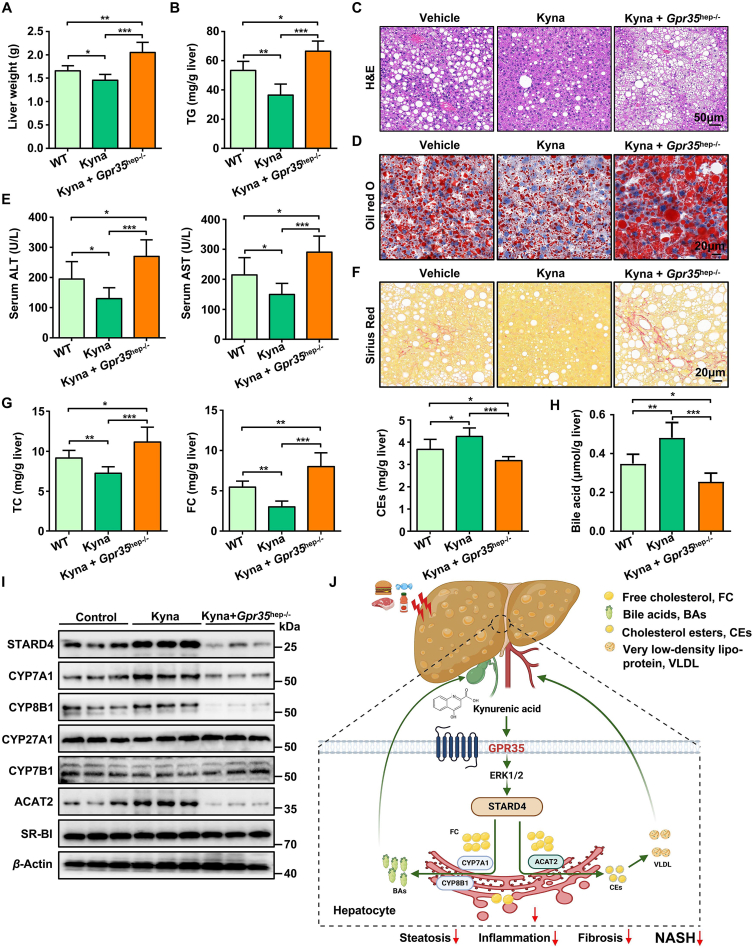
Nonalcoholic fatty liver disease (NAFLD) is the most common chronic liver disease worldwide. Fat accumulation "sensitizes" the liver to insult and leads to nonalcoholic steatohepatitis (NASH). G protein-coupled receptor 35 (GPR35) is involved in metabolic stresses, but its role in NAFLD is unknown. We report that hepatocyte GPR35 mitigates NASH by regulating hepatic cholesterol homeostasis. Specifically, we found that GPR35 overexpression in hepatocytes protected against high-fat/cholesterol/fructose (HFCF) diet-induced steatohepatitis, whereas loss of GPR35 had the opposite effect. Administration of the GPR35 agonist kynurenic acid (Kyna) suppressed HFCF diet-induced steatohepatitis in mice. Kyna/GPR35 induced expression of StAR-related lipid transfer protein 4 (STARD4) through the ERK1/2 signaling pathway, ultimately resulting in hepatic cholesterol esterification and bile acid synthesis (BAS). The overexpression of STARD4 increased the expression of the BAS rate-limiting enzymes cytochrome P450 family 7 subfamily A member 1 (CYP7A1) and CYP8B1, promoting the conversion of cholesterol to bile acid. The protective effect induced by GPR35 overexpression in hepatocytes disappeared in hepatocyte STARD4-knockdown mice. STARD4 overexpression in hepatocytes reversed the aggravation of HFCF diet-induced steatohepatitis caused by the loss of GPR35 expression in hepatocytes in mice. Our findings indicate that the GPR35-STARD4 axis is a promising therapeutic target for NAFLD.

Keywords: ACAT2; Bile acid; CYP7A1; Cholesterol; G protein-coupled receptor 35; Kynurenic acid; STARD4; Steatohepatitis.


Figures

Image 1
Graphical abstract
Figure 1
Figure 1
Global knockout of GPR35 exacerbates HFCF diet-induced steatohepatitis (n = 6). WT and global GPR35-knockout (Gpr35-KO) C57BL/6J mice were fed a NCD or HFCF diet for 16 weeks. (A) Body weight was measured every 4 weeks from 0 to 16 weeks. (B) Fasting blood glucose levels were measured every 4 weeks from 0 to 16 weeks. (C) Liver weight. (D) TG level in the liver. (E) H&E staining of liver tissue sections. Scale bar, 50 μm. (F) Oil Red O staining of liver tissue sections. Scale bar, 20 μm. (G) Serum levels of ALT and AST. (H) Representative images of Sirius Red staining of liver tissue sections. Scale bar, 20 μm. Data are the mean ± SD; ∗P < 0.05, ∗∗P < 0.01, ∗∗∗P < 0.001.
Figure 2
Figure 2
GPR35 deficiency in hepatocytes exacerbates HFCF diet-induced steatohepatitis and insulin resistance (n = 10). C57BL/6J mice were injected (i.v.) with AAV8-TBG-SaCas9-2A-EGFP-U6-sgRNA (NC) or AAV8-TBG-SaCas9-2A-EGFP-U6-sgRNA (Gpr35) to generate control (Gpr35hep-NC1) mice and hepatocyte GPR35-knockout (Gpr35hep−/−) mice, which were then fed a NCD or HFCF for 16 weeks. (A) Body weight was measured every 4 weeks from 0 to 16 weeks. (B) Fasting blood glucose levels were measured every 4 weeks from 0 to 16 weeks. (C) GTTs and ITTs were carried out on WT, Gpr35hep-NC1, and Gpr35hep−/− mice after NCD or HFCF diet feeding for 16 weeks. (D–N) WT, Gpr35hep-NC1, and Gpr35hep−/− mice at the end of 16 weeks of HFCF-diet feeding. (D) Serum TG levels. (E) Liver weight. (F) TG and (G) FFA levels in the liver. (H) H&E staining of liver tissue sections. Scale bar, 50 μm. (I) Oil Red O staining of liver tissue sections. Scale bar, 20 μm. (J) Relative mRNA expression of Pparα and Cpt1α in the liver. (K) Serum levels of ALT and AST. (L) Relative mRNA expression of cytokines (Tnfα, Il6, Il1β) in the liver. (M) Representative images of F4/80 and MPO immunostaining of liver tissue sections. Scale bar, 20 μm. (N) Representative images of Sirius Red staining and α-SMA immunostaining of liver tissue sections. Scale bar, 20 μm. The mRNA expression of the genes was normalized to that of β-actin. Data are the mean ± SD; ∗P < 0.05, ∗∗P < 0.01, ∗∗∗P < 0.001.
Figure 3
Figure 3
Mice with overexpressed GPR35 in hepatocytes are resistant to HFCF diet-induced steatohepatitis and IR (n = 10). C57BL/6J mice were injected (i.v.) with AAV8-TBGp-MCS-EGFP-3Flag-SV40 PolyA or AAV8-TBG-MCS-Gpr35-EGFP-3Flag-SV40 PolyA to generate control (Gpr35hep-NC2) mice and hepatocyte GPR35-overexpressing (Gpr35hep-OE) mice, which were then fed a NCD or HFCF diet for 16 weeks. (A) Body weight was measured every 4 weeks from 0 to 16 weeks. (B) Fasting blood glucose levels were measured every 4 weeks from 0 to 16 weeks. (C) GTTs and ITTs were undertaken on WT, Gpr35hep-NC2, and Gpr35hep-OE mice after NCD or HFCF-diet feeding for 16 weeks. (D–N) WT, Gpr35hep-NC2, and Gpr35hep-OE mice at the end of 16 weeks of HFCF-diet feeding. (D) Serum TG levels. (E) Liver weight. (F) TG and (G) FFA levels in the liver. (H) H&E staining of liver tissue sections. Scale bar, 50 μm. (I) Oil Red O staining of liver tissue sections. Scale bar, 20 μm. (J) Relative mRNA expression of Pparα and Cpt1α in the liver. (K) Serum levels of ALT and AST. (L) Relative mRNA expression of cytokines (Tnfα, Il6, Il1β) in the liver. (M) Representative images of F4/80 and MPO immunostaining of liver tissue sections. Scale bar, 20 μm. (N) Representative images of Sirius Red staining and α-SMA immunostaining of liver tissue sections. Scale bar, 50 μm. mRNA expression of genes was normalized to that of β-actin. The data are the mean ± SD. ns, not significant; ∗P < 0.05, ∗∗P < 0.01, ∗∗∗P < 0.001.
Figure 4
Figure 4
GPR35 regulates hepatic bile acid synthesis and cholesterol esterification (n = 10). (A–D) WT, Gpr35hep-NC1, Gpr35hep−/−, Gpr35hep-NC2, and Gpr35hep-OE mice were fed a NCD or HFCF diet for 16 weeks. (A) and (B) Levels of TC, FC and CEs in the liver. (C) Representative Western blot of CYP7A1, CYP8B1, CYP27A1, CYP7B1, SR-BI, and ACAT2 proteins in the livers of WT, Gpr35hep-NC1, and Gpr35hep−/− mice. (D) Representative Western blot of CYP7A1, CYP8B1, CYP27A1, CYP7B1, SR-BI, and ACAT2 proteins in the livers of WT, Gpr35hep-NC2, and Gpr35hep-OE mice. (E) Relative mRNA expression of a cholesterol esterification gene (Acat2) in the livers of WT, Gpr35hep-NC1, Gpr35hep−/−, Gpr35hep-NC2, and Gpr35hep-OE mice fed the HFCF diet for 16 weeks. (F) Levels of bile acids in the livers of WT, Gpr35hep-NC1, and Gpr35hep−/− mice fed the NCD or HFCF diet for 16 weeks. (G) Levels of bile acids in the livers of WT, Gpr35hep-NC2, and Gpr35hep-OE mice fed the NCD or HFCF diet for 16 weeks. (H) Relative mRNA expression of bile acids synthesis genes (Cyp7a1, Cyp8b1, Cpy27a1 and Cyp7b1) in the livers of WT, Gpr35hep-NC1, Gpr35hep−/−, Gpr35hep-NC2, and Gpr35hep-OE mice fed the HFCF diet for 16 weeks. The mRNA expression of genes was normalized to that of β-actin. Data are the mean ± SD; ∗P < 0.05, ∗∗P < 0.01, ∗∗∗P < 0.001.
Figure 5
Figure 5
GPR35 promotes hepatic expression of STARD4. (A–D) In-depth quantitative proteomic analysis of the liver. A multiple sample test controlled by an FDR threshold of 0.05 was applied to identify significant differences in protein abundance (≥1.5-fold change). (A) Hierarchical clustering map of total proteins in the livers from WT and Gpr35-KO mice, where the top 10 proteins with the most significant upregulation (red) or downregulation (blue) are shown. (B) Volcano plot of total proteins in the livers from WT and Gpr35-KO mice. (C) Hierarchical clustering map of total proteins in the livers from WT and Gpr35-KO mice fed a HFCF diet for 16 weeks, where the top 10 proteins with the most significant upregulation (red) or downregulation (blue) are shown. (D) Volcano plot of total proteins in the livers from WT and Gpr35-KO mice fed the HFCF diet for 16 weeks. (E) Representative Western blot of STARD4 proteins in the livers of WT and Gpr35-KO mice fed the NCD or HFCF diet for 16 weeks. (F) Representative Western blot of STARD4 proteins in the livers of WT, Gpr35hep-NC1, and Gpr35hep−/− mice fed the NCD or HFCF diet for 16 weeks. (G) Representative Western blot of STARD4 proteins in the livers of WT, Gpr35hep-NC2, and Gpr35hep-OE mice fed the NCD or HFCF for 16 weeks.
Figure 6
Figure 6
A gain in function of STARD4 can reverse the exacerbation of steatohepatitis caused by GPR35 deletion (n = 6). Gpr35hep-NC1 and Gpr35hep−/− mice were injected (i.v.) with AAV8-TBG-m-NC-3xFlag-mCherry or AAV8-TBG-m-Stard4-3xFlag-mCherry to generate control (Stard4hep-NC1-Gpr35hep-NC1 and Stard4hep-NC1-Gpr35hep−/−) mice and hepatocyte STARD4-overexpressing (Stard4hep-OE-Gpr35hep-NC1 and Stard4hep-OE-Gpr35hep−/−) mice, which were then fed a HFCF diet for 16 weeks. (A) TC, FC, CE and (B) bile acid levels in the liver. (C) Representative Western blot of CYP7A1, CYP8B1, CYP27A1, CYP7B1, SR-BI, and ACAT2 proteins in the liver. (D) Body weight was measured every 4 weeks from 0 to 16 weeks. (E) Liver weight. (F) TG and (G) FFA levels in the liver. (H) H&E staining of liver tissue sections. Scale bar, 50 μm. (I) Oil Red O staining of liver tissue sections. Scale bar, 20 μm. (J) Serum levels of ALT and AST. (K) Relative mRNA expression of cytokines in the liver. (L) Representative images of Sirius Red staining and α-SMA immunostaining of liver-tissue sections. Scale bar, 20 μm. The mRNA expression of genes was normalized to that of β-actin. Data are the mean ± SD; ns, not significant; ∗P < 0.05, ∗∗P < 0.01, ∗∗∗P < 0.001.
Figure 7
Figure 7
Loss of STARD4 can eliminate the protective effect of GPR35 against steatohepatitis (n = 6). Gpr35hep-NC2 and Gpr35hep-OE mice were injected (i.v.) with AAV8-TBG-Mir30-m-shRNA(NC)-mCherry or AAV8-TBG-Mir30-m-shRNA(Stard4)-mCherry to generate control (Stard4hep-NC2-Gpr35hep-NC2 and Stard4hep-NC2-Gpr35hep-OE) mice and hepatocyte STARD4-knockout (Stard4hep-KD-Gpr35hep-NC2 and Stard4hep-KD-Gpr35hep-OE) mice, which were then fed a HFCF diet for 16 weeks. (A) TC, FC, CE and (B) bile acid levels in the liver. (C) Representative Western blot of CYP7A1, CYP8B1, CYP27A1, CYP7B1, SR-BI, and ACAT2 proteins in the liver. (D) Body weight was measured every 4 weeks from 0 to 16 weeks. (E) Liver weight. (F) TG and (G) FFA levels in the liver. (H) H&E staining of liver tissue sections. Scale bar, 50 μm. (I) Oil Red O staining of liver tissue sections. Scale bar, 20 μm. (J) Serum levels of ALT and AST. (K) Relative mRNA expression of cytokines in the liver. (L) Representative images of Sirius Red staining and α-SMA immunostaining of liver tissue sections. Scale bar, 20 μm. The mRNA expression of genes was normalized to that of β-actin. Data are the mean ± SD; ns, not significant; ∗P < 0.05, ∗∗P < 0.01, ∗∗∗P < 0.001.
Figure 8
Figure 8
The GPR35 agonist Kyna prevents HFCF diet-induced steatohepatitis in mice (n = 6). After HFCF-diet feeding for 8 weeks, WT and Gpr35hep−/− mice were injected with Kyna (5 mg/kg body weight, i.p.) daily and continued to be fed the HFCF diet for 8 weeks. (A) Liver weight. (B) TG level in the liver. (C) H&E staining of liver tissue sections. Scale bar, 50 μm. (D) Oil Red O staining of liver tissue sections. Scale bar, 20 μm. (E) Serum levels of ALT and AST. (F) Sirius Red staining of liver-tissue sections. Scale bar, 20 μm. (G) TC, FC, CEs, and (H) bile acid levels in the liver. (I) Representative Western blot of STARD4, CYP7A1, CYP8B1, CYP27A1, CYP7B1, SR-BI, and ACAT2 proteins in the liver. (J) Model depicting the critical role GPR35 signaling plays in controlling NASH by reprogramming cholesterol homeostasis in hepatocytes, thereby attenuating NASH. The picture was created by BioRender.com. Data are the mean ± SD; ∗P < 0.05, ∗∗P < 0.01, ∗∗∗P < 0.001.

References

    1. Younossi Z. Non-alcoholic fatty liver disease—a global public health perspective. J Hepatol. 2019;70:531–544. - PubMed
    1. Oduro P., Zheng X., Wei J., Yang Y., Wang Y., Zhang H., et al. The cGAS–STING signaling in cardiovascular and metabolic diseases: future novel target option for pharmacotherapy. Acta Pharm Sin B. 2022;12:50–75. - PMC - PubMed
    1. Tilg H., Moschen A., Roden M. NAFLD and diabetes mellitus. Nat Rev Gastroenterol Hepatol. 2017;14:32–42. - PubMed
    1. Neuschwander-Tetri B. Hepatic lipotoxicity and the pathogenesis of nonalcoholic steatohepatitis: the central role of nontriglyceride fatty acid metabolites. Hepatology. 2010;52:774–788. - PubMed
    1. Dong J., Viswanathan S., Adami E., Singh B., Chothani S., Ng B., et al. Hepatocyte-specific IL11 cis-signaling drives lipotoxicity and underlies the transition from NAFLD to NASH. Nat Commun. 2021;12:66. - PMC - PubMed