. 2023 Mar;13(3):1246-1261.
doi: 10.1016/j.apsb.2022.09.019. Epub 2022 Sep 30.

ROS-removing nano-medicine for navigating inflammatory microenvironment to enhance anti-epileptic therapy

Affiliations

ROS-removing nano-medicine for navigating inflammatory microenvironment to enhance anti-epileptic therapy

Zheng Zhou et al. Acta Pharm Sin B. 2023 Mar.

Abstract

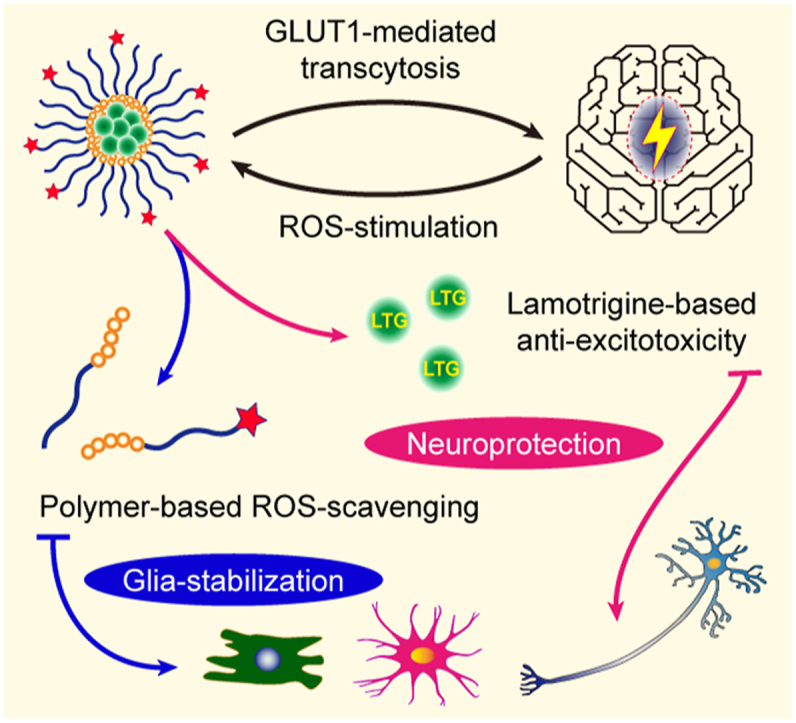
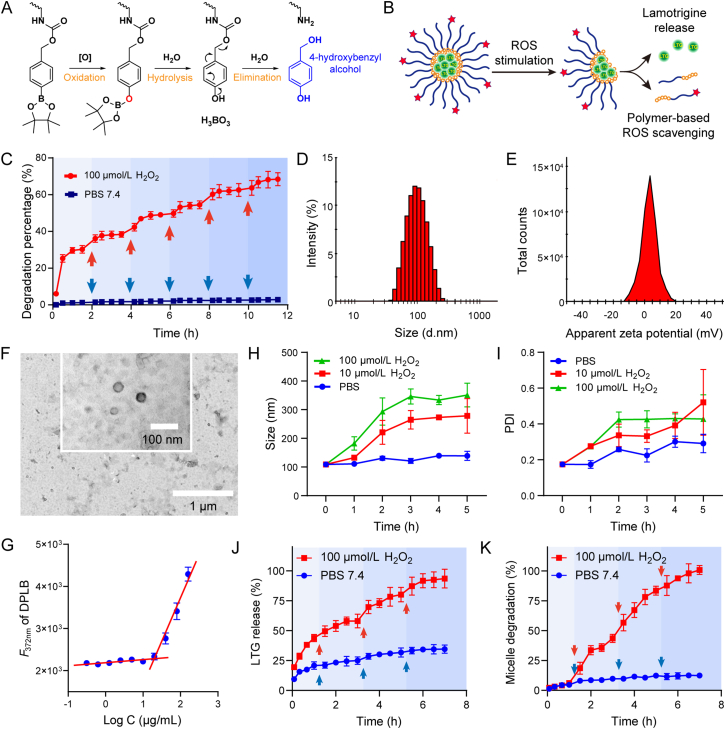
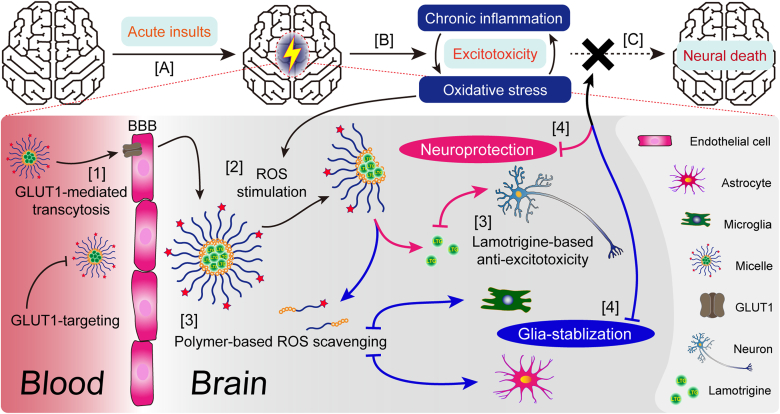
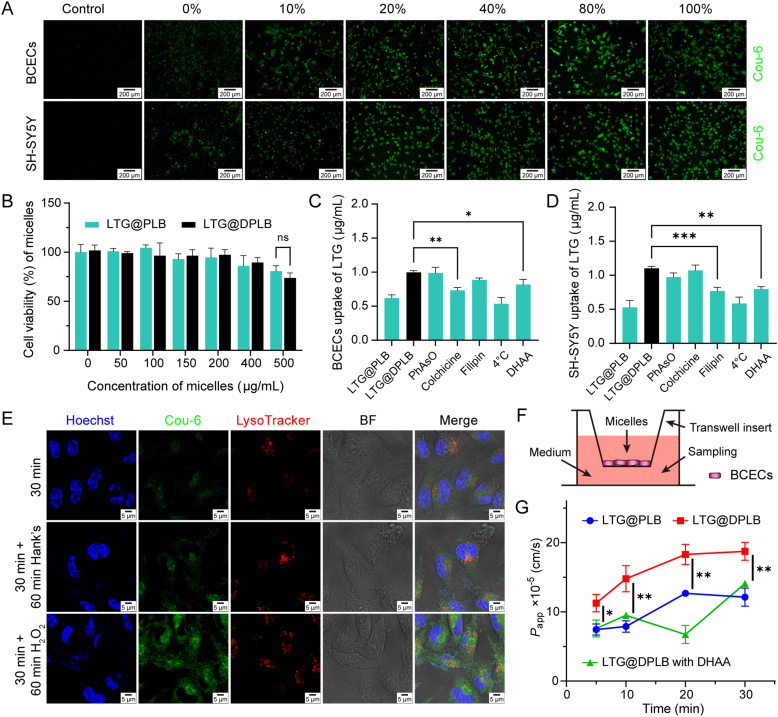
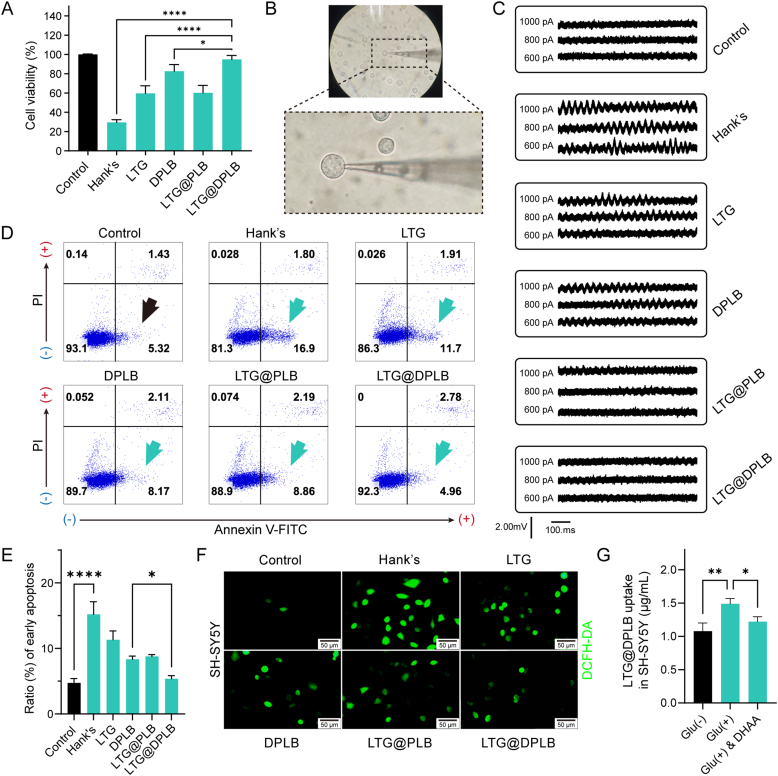
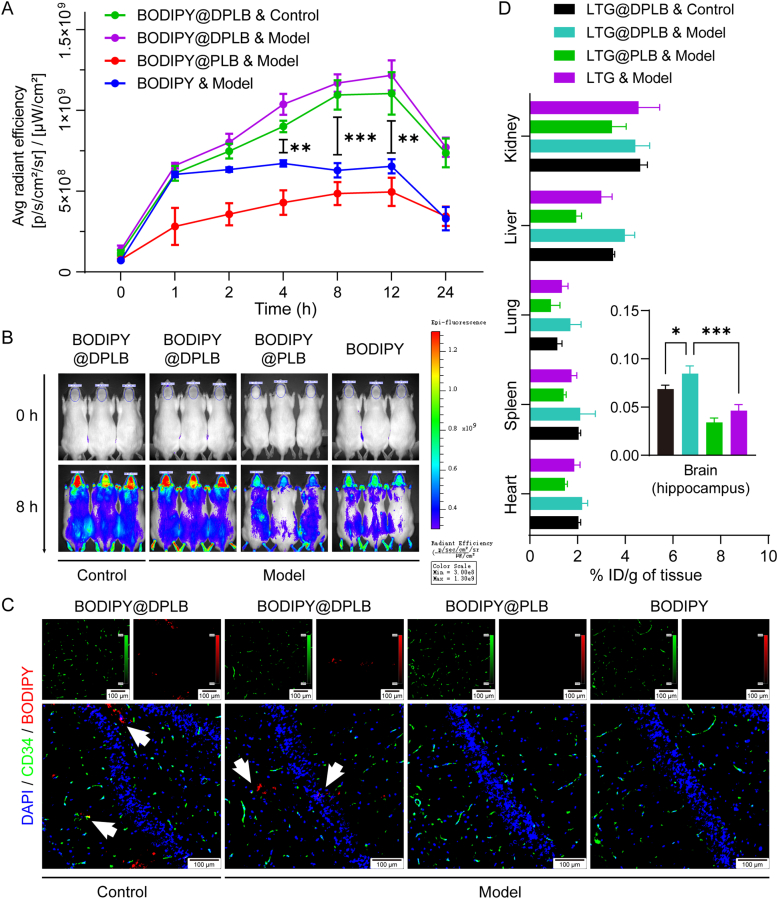
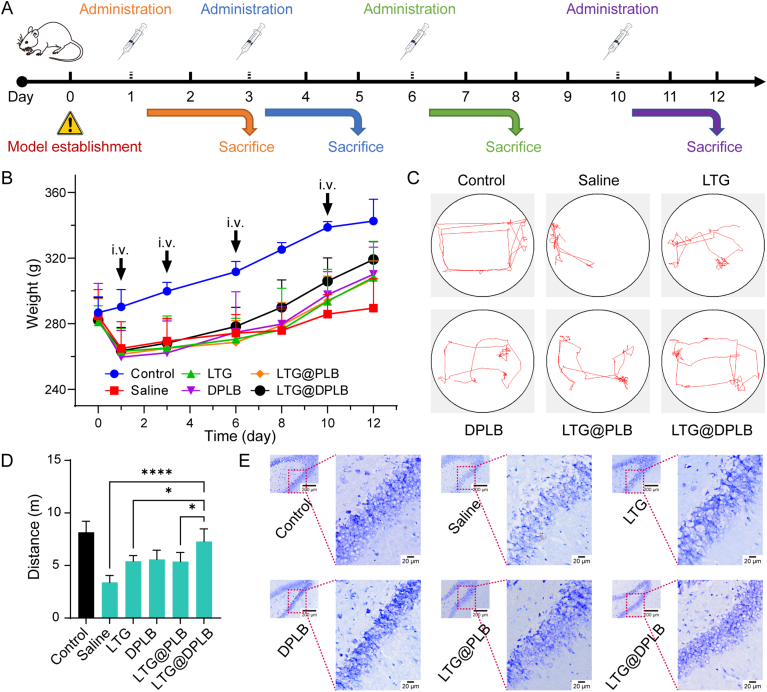
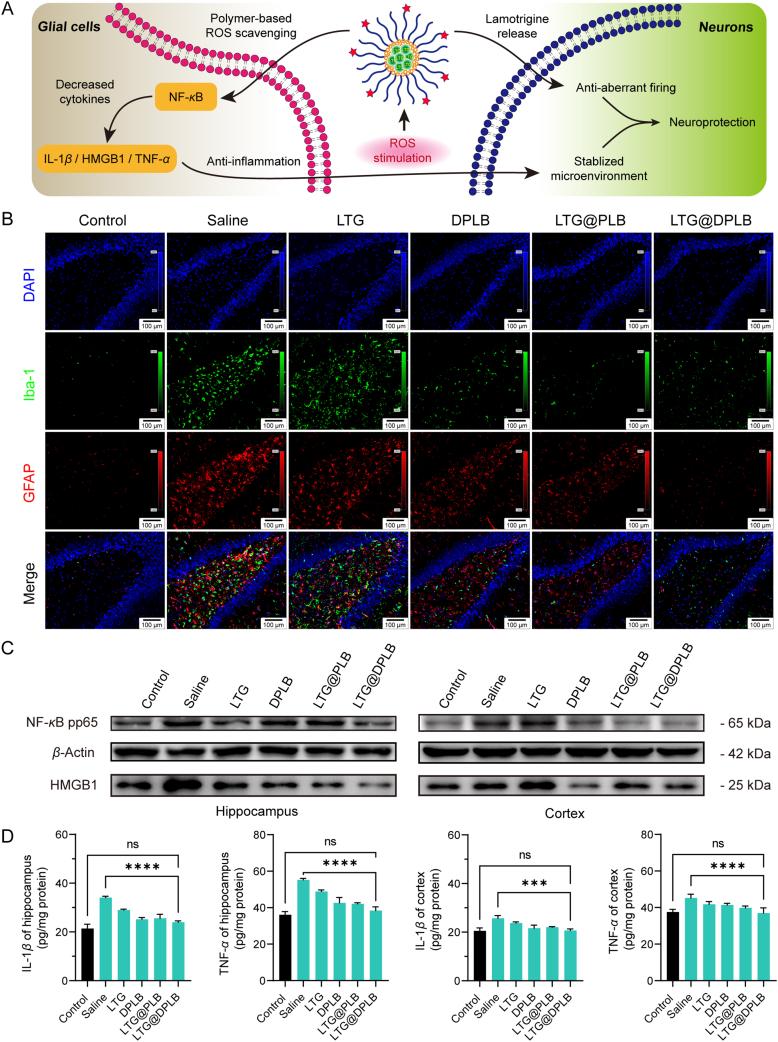
As a neurological disorder in the brain, epilepsy is not only associated with abnormal synchronized discharging of neurons, but also inseparable from non-neuronal elements in the altered microenvironment. Anti-epileptic drugs (AEDs) merely focusing on neuronal circuits frequently turn out deficient, which is necessitating comprehensive strategies of medications to cover over-exciting neurons, activated glial cells, oxidative stress and chronic inflammation synchronously. Therefore, we would report the design of a polymeric micelle drug delivery system that was functioned with brain targeting and cerebral microenvironment modulation. In brief, reactive oxygen species (ROS)-sensitive phenylboronic ester was conjugated with poly-ethylene glycol (PEG) to form amphiphilic copolymers. Additionally, dehydroascorbic acid (DHAA), an analogue of glucose, was applied to target glucose transporter 1 (GLUT1) and facilitate micelle penetration across the blood‒brain barrier (BBB). A classic hydrophobic AED, lamotrigine (LTG), was encapsulated in the micelles via self-assembly. When administrated and transferred across the BBB, ROS-scavenging polymers were expected to integrate anti-oxidation, anti-inflammation and neuro-electric modulation into one strategy. Moreover, micelles would alter LTG distribution in vivo with improved efficacy. Overall, the combined anti-epileptic therapy might provide effective opinions on how to maximize neuroprotection during early epileptogenesis.

Keywords: Epilepsy; Gliosis; Inflammation; Neuroprotection; Polymeric micelle; Reactive oxygen species.


Conflict of interest statement

The authors declare no conflicts of interest.

Figures

Image 1
Graphical abstract
Figure 1
Figure 1
Preparation and characterization of micelles. (A) Degradative mechanism of the polymeric monomer (PLB or DPLB) under oxidative environment; (B) Illustration of LTG@DPLB micelle formation, degradation and drug release triggered by ROS; (C) Kinetics of polymer degradation in PBS 7.4 with or without 100 μmol/L H2O2. Red arrows indicate supplemental H2O2 to sustain the reaction and blue arrows indicate supplemental PBS. Results are presented as mean ± SD (n = 3); (D,E) Size distribution, PDI and ζ-potential of micelles measured by DLS machine; (F) Morphology of LTG@DPLB micelles measured by transmission electron microscope (TEM, scale bar: 1.0 μm; inset scale bar: 100 nm); (G) Critical micelle concentration (CMC) measurement of DPLB materials. Data are reported as mean ± SD (n = 3); (H,I) Size distribution and PDI of LTG@DPLB micelles after incubation with different concentrations of H2O2. Results are reported as mean ± SD (n = 3); (J,K) Dynamics of LTG release and micelle degradation of LTG@DPLB micelles in PBS 7.4 with or without 100 μmol/L H2O2. Red and blue arrows indicate supplemental H2O2 and PBS to compensate the sampling volume. Results are presented as mean ± SD (n = 3).
Scheme 1
Scheme 1
Illustration of epileptogenesis, LTG-loaded micelle formation and regulation of pathological microenvironment in epileptic foci. The gradual transformation from a formerly healthy brain into one suffering from autonomous seizures, named epileptogenesis, can be divided into three phases: (A) First, a serious insult, for example, stroke or head trauma, initiates molecular and cellular changes in the affected brain regions. (B) Second, within those foci, glial cells are pathologically activated (i.e., gliosis) to establish inflammatory microenvironment and release cytokines, chemokines, growth factors and other molecules to reduce or repair brain damages. However, unrestrained reactive gliosis may cause excessive inflammation, neuronal death and tissue damage and last until acute, unprovoked seizures occur. (C) Third, after continuous inflammation and recurring seizures, molecular and cellular changes can hardly be reversed and give rise to neural death. Our nano-medicine will (1) penetrate the BBB with the help of GLUT1-targeting ligand DHAA and then (2) release lamotrigine under the stimulation from high concentration of ROS in epileptic lesions. (3) Lamotrigine is delivered to prevent aberrant firing while ROS-scavenger phenylboronic ester can reduce oxidative stress to alleviate chronic inflammation. (4) Finally, epileptogenesis will hopefully be terminated due to our nano-medicine's protection to neurons and stabilizing effect on glia.
Figure 2
Figure 2
Cellular biocompatibility and uptake of micelles in vitro. (A) Cellular uptake of Cou-6-loaded micelles with different DHAA-modification ratios of 0%, 10%, 20%, 40%, 80% and 100% in BCECs and SH-SY5Y cells (scale bar: 200 μm; green signal: Cou-6); (B) Viability of SH-SY5Y cells incubated with different concentrations of non-targeted micelles (LTG@PLB) and targeted micelles (LTG@DPLB, composed of 80% PLB and 20% DPLB). Results are presented as mean ± SD (n = 3); (C,D) Quantitative cellular uptake of micelles in BCECs and SH-SY5Y cells treated with six different inhibitive conditions. Results are presented as mean ± SD (n = 3, ∗P < 0.05, ∗∗P < 0.01, ∗∗∗P < 0.001); (E) Lysosomal escape and cellular drug release of micelles induced by 100 μmol/L H2O2 in SH-SY5Y cells (scale bar: 5 μm; blue signal: Hoechst; green signal: Cou-6; red signal: LysoTracker); (F) Illustration of the BCEC monolayer transwell system; (G) Quantitative transcytosis of LTG encapsulated in micelles across the BBB model in vitro (calculated as apparent permeability coefficients, or Papp). Data are presented as mean ± SD (n = 3, ∗P < 0.05, ∗∗P < 0.01).
Figure 3
Figure 3
Neuroprotective effects of micelles on SH-SY5Y cells incubated with different neurotoxic conditions. (A) Viability of SH-SY5Y cells after incubation with 100 μmol/L H2O2. The cells were pre-treated with different preparations. Results are presented as mean ± SD (n = 3, ∗P < 0.05, ∗∗∗∗P < 0.0001); (B) The operation field and glass micropipette under arthroscopy of the whole-cell patch-clamp technique; in the center of the field, the glass microelectrode had sealed one cell. (C) Electrical activities of SH-SY5Y cells recorded by whole-cell patch-clamp with different compliance currents (600, 800 and 1000 pA); SH-SY5Y cells were cultured in 50 mmol/L glutamine to induce excitotoxicity and then treated with different preparations; (D) Flow cytometry analysis of excitotoxic cell apoptosis after treatment with different preparations; Positive signals of Annexin V-FITC with negative signals of propidium iodide (PI) (the fourth quadrant) directed the early apoptosis of SH-SY5Y cells; (E) Quantification of the cellular early apoptosis of SH-SY5Y cells analyzed by flow cytometry. Data are presented as mean ± SD (n = 3, ∗P < 0.05, ∗∗∗∗P < 0.0001); (F) ROS-staining of SH-SY5Y cells treated with different preparations against 50 mmol/L glutamine-induced excitotoxic injury (scale bar: 50 μm; green signal: DCFH-DA activated by ROS) (G) Quantitative cellular uptake of the targeted micelle (DPLB@LTG) in SH-SY5Y cells treated with glutamate (Glu)-stimulated [marked as Glu (+)] and even DHAA-inhibitive conditions. Results are calculated according to intracellular LTG and presented as mean ± SD (n = 3, ∗P < 0.05, ∗∗P < 0.01).
Figure 4
Figure 4
In vivo distribution study of micelles. (A) Semi-quantification of BODIPY fluorescent signals in the head analyzed by the IVIS software. Data are presented as mean ± SD (n = 3, ∗∗P < 0.01, ∗∗∗P < 0.001); (B) The IVIS Spectrum in vivo imaging of rats before and 8 h after injection with BODIPY or BODIPY-loaded micelles; (C) Distribution of BODIPY around vascular endothelial cells (stained with anti-CD34) in rat hippocampus 8 h after injection. White arrows indicate BODIPY-loaded micelles diffused away from blood vessels (scale bar: 100 μm; blue signal: DAPI; green signal: CD34; red signal: BODIPY); (D) Quantification of LTG distribution in different organs of different groups. The percentage of the injected dose per gram of tissue (% ID/g of tissue) was calculated according to HPLC results. Data are presented as mean ± SD (n = 3, ∗P < 0.05, ∗∗∗P < 0.001).
Figure 5
Figure 5
Rudimentary anti-epileptic efficacy study of micelles in vivo. (A) Treatment schedule; Epileptic rats were administered with different preparations on Days 1, 3, 6 and 10 after modeling; One day after each administration, rats were sacrificed to prepare samples for further analysis; (B) Weight of rats was recorded synchronously during the medication (before modeling and on Days 1,3, 6, 8, 10 and 12). Data are presented as mean ± SD (n = 20, 15, 10 or five at different time points); (C) The movement track of rats captured by Morris water maze camera for 1 min per group in open-field tests (Day 10); (D) Quantification of motion distance automatically calculated by Morris water maze software in open-field tests (Day 10). Results are presented as mean ± SD (n = 3, ∗P < 0.05, ∗∗∗∗P < 0.0001); (E) Nissl's staining of neurons' morphologic changes in rat hippocampus (scale bar: 200 μm for thumbnails and 20 μm for large images; mottled blue signal: Nissl's bodies; Day 10).
Figure 6
Figure 6
Advanced anti-epileptic efficacy study of micelles in vivo. (A) Illustration of epileptic inflammatory microenvironment and the therapeutic mechanism of the nano-medicine; (B) Immunofluorescence staining of reactive gliosis in rat hippocampus (scale bar: 100 μm; blue signal: DAPI; green signal: Iba-1; red signal: GFAP; Day 10); (C) Measurement of pro-inflammatory cytokines (NF-κB pp65 and HMGB1) in rat hippocampus and cortex (Day 10) by western blot (β-actin served as the inner parameter); (D) Measurement of pro-inflammatory cytokines (IL-1β and TNF-α) in rat hippocampus and cortex (Day 10) by enzyme-linked immunosorbent assay (ELISA). Results are presented as mean ± SD (n = 3, ∗∗∗P < 0.001, ∗∗∗∗P < 0.0001).

References

    1. Patel D.C., Tewari B.P., Chaunsali L., Sontheimer H. Neuron-glia interactions in the pathophysiology of epilepsy. Nat Rev Neurosci. 2019;20:282–297. - PMC - PubMed
    1. Diaz Verdugo C., Myren-Svelstad S., Aydin E., Van Hoeymissen E., Deneubourg C., Vanderhaeghe S., et al. Glia-neuron interactions underlie state transitions to generalized seizures. Nat Commun. 2019;10:3830. - PMC - PubMed
    1. Vezzani A., Balosso S., Ravizza T. Neuroinflammatory pathways as treatment targets and biomarkers in epilepsy. Nat Rev Neurol. 2019;15:459–472. - PubMed
    1. McElroy P.B., Liang L.P., Day B.J., Patel M. Scavenging reactive oxygen species inhibits status epilepticus-induced neuroinflammation. Exp Neurol. 2017;298:13–22. - PMC - PubMed
    1. Drion C.M., van Scheppingen J., Arena A., Geijtenbeek K.W., Kooijman L., van Vliet E.A., et al. Effects of rapamycin and curcumin on inflammation and oxidative stress in vitro and in vivo—in search of potential anti-epileptogenic strategies for temporal lobe epilepsy. J Neuroinflammation. 2018;15:212. - PMC - PubMed