. 2023 Oct 3;25(10):1828-1841.
doi: 10.1093/neuonc/noad064.

ATM inhibition enhances the efficacy of radiation across distinct molecular subgroups of pediatric high-grade glioma

Affiliations

ATM inhibition enhances the efficacy of radiation across distinct molecular subgroups of pediatric high-grade glioma

Jia Xie et al. Neuro Oncol. .

Abstract

Background: Pediatric high-grade glioma (pHGG) is largely incurable and accounts for most brain tumor-related deaths in children. Radiation is a standard therapy, yet the benefit from this treatment modality is transient, and most children succumb to disease within 2 years. Recent large-scale genomic studies suggest that pHGG has alterations in DNA damage response (DDR) pathways that induce resistance to DNA damaging agents. The aim of this study was to evaluate the therapeutic potential and molecular consequences of combining radiation with selective DDR inhibition in pHGG.

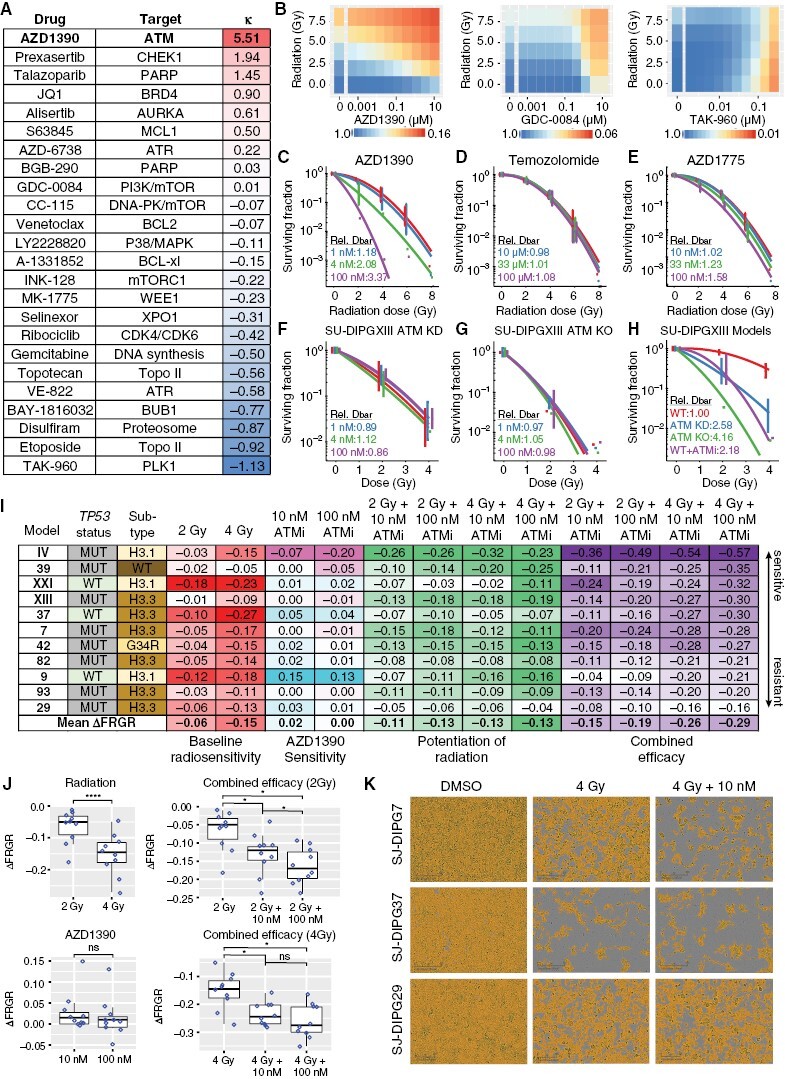
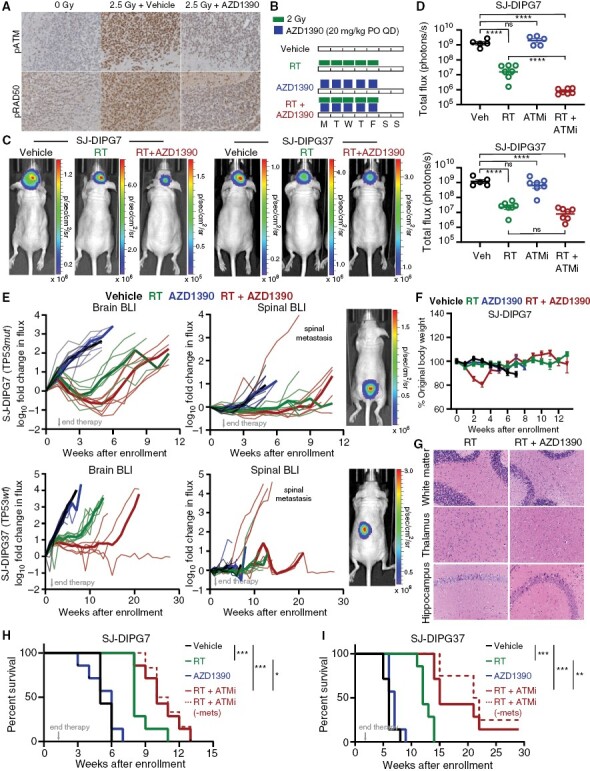
Methods: We conducted an unbiased screen in pHGG cells that combined radiation with clinical candidates targeting the DDR and identified the ATM inhibitor AZD1390. Subsequently, we profiled AZD1390 + radiation in an extensive panel of early passage pHGG cell lines, mechanistically characterized response to the combination in vitro in sensitive and resistant cells and evaluated the combination in vivo using TP53 wild-type and TP53 mutant orthotopic xenografts.

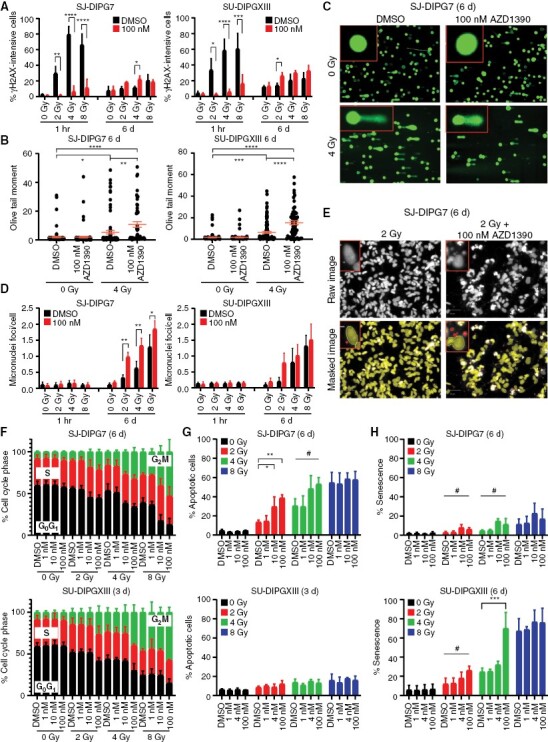
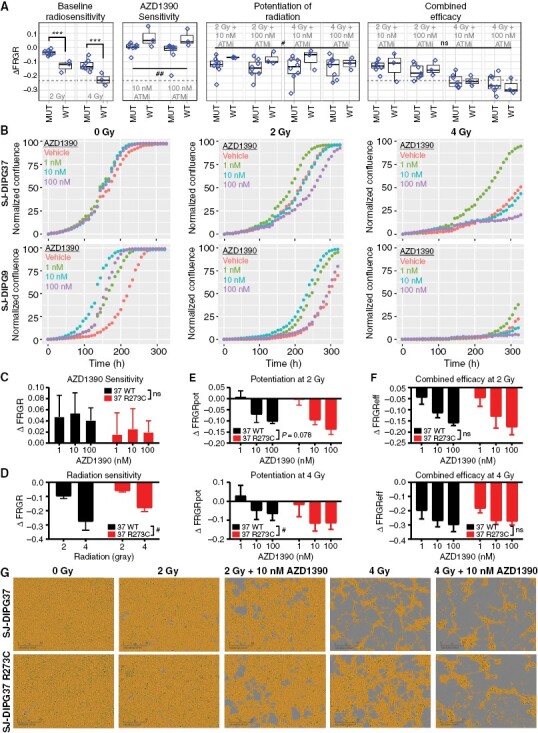
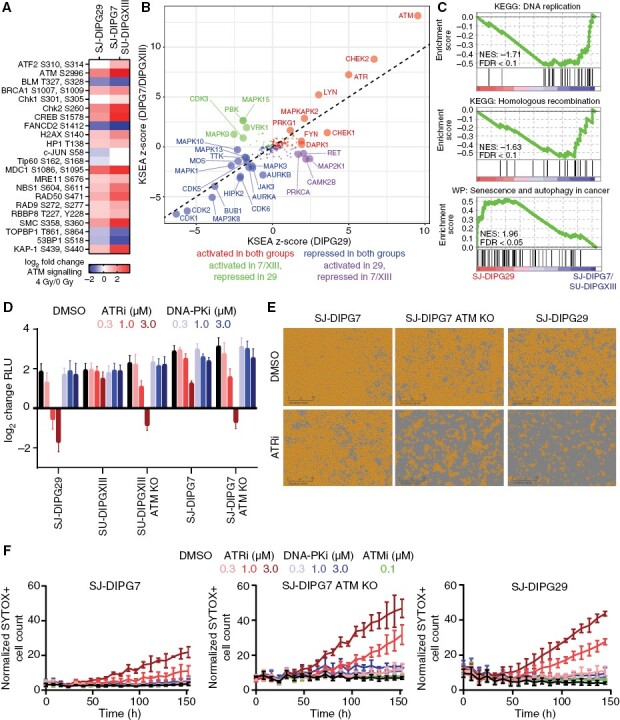
Results: AZD1390 significantly potentiated radiation across molecular subgroups of pHGG by increasing mutagenic nonhomologous end joining and augmenting genomic instability. In contrast to previous reports, ATM inhibition significantly improved the efficacy of radiation in both TP53 wild-type and TP53 mutant isogenic cell lines and distinct orthotopic xenograft models. Furthermore, we identified a novel mechanism of resistance to AZD1390 + radiation that was marked by an attenuated ATM pathway response which dampened sensitivity to ATM inhibition and induced synthetic lethality with ATR inhibition.

Conclusions: Our study supports the clinical evaluation of AZD1390 in combination with radiation in pediatric patients with HGG.

Keywords: ATM; DNA damage response; pediatric brain tumors; radiation therapy.


Conflict of interest statement

Suzanne J. Baker owns stock in Astra Zeneca. The other authors declare no potential conflicts of interest.

Figures

Fig. 1.
Fig. 1.
AZD1390 radiosensitized cells representing distinct molecular subgroups of pHGG. (A) BRAID response surface model analysis of 24 CNS-penetrant FDA-approved drugs or clinical candidates targeting the DDR in combination with radiation in SU-DIPGXIII cells (n = 3). (B) Exemplar BRAID response surface models from (A). (C-E) Linear quadratic (LQ) fits of colony-forming assays (CFAs) testing the combination of radiation with AZD1390 (C) or with 2 drugs (D-E) currently used or in clinical development for pHGG (n = 3). Dbar, the mean inactivation dose, was averaged over biological replicates and divided by the Dbar for the vehicle (red). (F-G) LQ fits from CFA experiments in SU-DIPGXIII ATM kinase dead (KD) or knockout (KO) cells treated with increasing doses of AZD1390 (n = 3). No further radiosensitization was observed in ATM KD and KO cells after treatment with up to 100 nM AZD1390, confirming that the drug potentiates radiation solely through ATM inhibition within this concentration range. (H) Overlay of the LQ fits from CFA experiments in SU-DIPGXIII WT cells (± 100 nM AZD1390), SU-DIPGXIII ATM KD cells, or SU-DIPGXIII ATM KO cells (n = 3). Wild-type SU-DIPGXIII cells treated with 100 nM AZD1390 showed radiation sensitivity comparable to that of ATM KD cells (Dbar relative to vehicle = 2.18 vs. 2.58, respectively) but less than that of ATM KO cells (Dbar relative to vehicle = 4.16). (I) Summary of the average change in FRGR calculated from the confluence assays of 11 pHGG cell lines for 14 days (n ≥ 3). (J) Statistical analysis of the distributions of ΔFRGR values reported in (I). Data are presented as Tukey box-and-whisker plots and were analyzed by paired Student’s t-test (when comparing 2 groups) or one-way within-subjects ANOVA modeling the effect of drug treatment on ΔFRGR (when comparing >2 groups). (K) Representative microscopy images from the confluence assay of SJ-DIPG7, SJ-DIPGXIII, and SJ-DIPG37 cells. Scale bar: 300 µm.
Fig. 2.
Fig. 2.
AZD1390 increased radiation-induced genomic instability, cell cycle arrest, and apoptosis or senescence. (A) Percentage of γH2A.X-intense SJ-DIPG7 or SU-DIPGXIII cells 1 h and 6 days after treatment with 100 nM AZD1390 + radiation (n = 3). Data are presented as the mean ± SD. Two-way ANOVA was performed to analyze the effect of radiation dose and drug treatment on the percentage of γH2A.X-intense cells. (B) Olive tail moment from comet assay of SJ-DIPG7 or SU-DIPGXIII cells 6 days after treatment with 100 nM AZD1390 + 4 Gy (n = 3, ≥50 cells/replicate). Data are presented as the mean ± SEM. One-way ANOVA was performed to analyze the effect of treatment (radiation + drug) on the Olive tail moment. (C) Exemplar comet assay images of SU-DIPG7 cells from (B). (D) Quantification of micronuclei in SJ-DIPG7 and SU-DIPGXIII cells after treatment with radiation and AZD1390 (n = 3). Data are presented as the mean ± SD. Two-way ANOVA was performed to analyze the effect of radiation dose and drug treatment on micronuclei foci count. (E) Illustration of the quantification of micronuclei in SJ-DIPG7 cells after treatment with radiation and AZD1390. Microcopy images were masked to isolate the nuclei (yellow) from the micronuclei (red) present within each cell. Scale bar: 50 µm. (F-H) Cell cycle distribution (F), percentage of apoptotic cells (G), and percentage of senescent cells (H) as assessed by assays in SJ-DIPG7 or SU-DIPGXIII cells after treatment with radiation and AZD1390 (n ≥ 2). Data are presented as the mean ± SD. One-way ANOVA was performed at each radiation dose to analyze the effect of drug treatment on cell fate outcome.
Fig. 3.
Fig. 3.
In vitro, TP53 alteration did not change the combined efficacy of AZD1390 + radiation. (A) Statistical analysis of the distributions of ΔFRGR values reported in Figure 1I as a function of TP53 status. Data are presented as Tukey box-and-whisker plots and were analyzed by two-way ANOVA modeling the effect of treatment (radiation, drug, or radiation + drug) and TP53 status on ΔFRGR. The dotted line equals the median ΔFRGR of TP53wt pHGG cell lines treated with 4 Gy of radiation. (B) Representative confluence assay curves for SJ-DIPG37 and SJ-DIPG9 cells, both TP53wt, treated with radiation and AZD1390 (n = 3). (C) ΔFRGR calculated from the confluence assay of SJ-DIPG37 TP53wt cells and isogenic SJ-DIPG37 TP53 R273C mutant cells treated with AZD1390 alone (n = 3). Data are presented as the mean ± SD. Two-way ANOVA was performed to analyze the effect of drug treatment and TP53 status on ΔFRGR. (D) ΔFRGR calculated from the confluence assay of SJ-DIPG37 TP53wt cells and SJ-DIPG37 TP53 R273C mutant cells treated with radiation alone (n = 3). Data are presented as the mean ± SD. Two-way ANOVA was performed to analyze the effect of radiation and TP53 status on ΔFRGR. (E) Potentiation of radiation, ΔFRGRpot, calculated from the confluence assay of SJ-DIPG37 TP53wt cells and SJ-DIPG37 TP53 R273C mutant cells treated with radiation and AZD1390 (n = 3). Data are presented as the mean ± SD. Two-way ANOVA was performed at each radiation dose to analyze the effect of drug and TP53 status on ΔFRGRpot. (F) Reanalysis of the experiment in (E) using combined efficacy, ΔFRGReff, as the dependent variable. (G) Representative microscopy images from week 2 of the confluence assay from (C-F) of SJ-DIPG37 TP53wt and SJ-DIPG37 TP53 R273C mutant cells. Scale bar: 300 µm.
Fig. 4.
Fig. 4.
AZD1390 + radiation prolonged survival in both TP53wt and TP53mut OXs. (A) Immunohistochemical staining for p-ATM and pRAD50 in mice bearing SJ-DIPG7 OXs treated as indicated. (B) Dose and schedule for in vivo efficacy studies. (C) Representative bioluminescence images of mice bearing SJ-DIPG7 or SJ-DIPG37 OXs 3 weeks after treatment completion. (D) BLI intensity in SJ-DIPG7 OXs or SJ-DIPG37 OXs 3 weeks after treatment completion. Data are presented as the mean ± SEM. One-way ANOVA was performed to analyze the effect of treatment on total flux. (E) In vivo growth of SJ-DIPG7 OXs (top) and SJ-DIPG37 OXs (bottom) in the brain (left) after enrollment. BLI intensities at each timepoint were normalized to the BLI intensity at enrollment for each animal. Pre-euthanasia bioluminescence images of spinal metastases are shown at right. (F) Body weight as a percentage of weight at enrollment for SJ-DIPG7 study animals. Data are presented as the mean ± SEM. (G) H&E staining of the brain regions of mice after treatment with radiation and/or AZD1390. (H-I). Survival analysis of mice harboring SJ-DIPG7 OXs (H) or SJ-DIPG37 OXs (I) treated as indicated (n = 7 per treatment arm). Data were analyzed using the log-rank test. The dotted line represents survival after excluding mice euthanized because of hind-quarter paralysis.
Fig. 5.
Fig. 5.
SJ-DIPG29 showed attenuated ATM pathway activation and concomitant synthetic lethality with ATR inhibition. (A) Log2 change in phosphoprotein abundance in SU-DIPGXIII/SJ-DIPG7 and SJ-DIPG29 ATM signaling pathways after irradiation. (B) KSEA z-scores from postirradiation phosphoproteome change in SJ-DIPG7/SU-DIPGXIII vs. SJ-DIPG29. Kinases are color-coded by response in SJ-DIPG7/SU-DIPGXIII vs. SJ-DIPG29 and enlarged if P < 0.05 (FDR-adjusted). (C) Differentially regulated pathways in the baseline proteomes of SJ-DIPG7/SU-DIPGXIII vs. SJ-DIPG29 identified by GSEA. (D) Log2 change (CTG RLU) in DIPG cells treated with the ATR inhibitor AZD6738 or the DNA-PK inhibitor AZD7648 (n = 3). Data are presented as the mean ± SD. (E) Representative microscopy images from week 2 of the confluence assay of SJ-DIPG7, SJ-DIPG7 ATM KO, and SJ-DIPG29 cells treated with 1 µM AZD6738. Scale bar: 300 µm. (F) Results of SYTOX Green cell death assay of SJ-DIPG7, SJ-DIPG7 ATM KO, and SJ-DIPG29 cells treated with the ATR inhibitor AZD6738 or the DNA-PK inhibitor AZD7648 (n = 3). The y-axis reflects the number of SYTOX Green-positive cells divided by the percent confluence. Data are presented as the mean ± SD.

References

    1. Juratli TA, Qin N, Cahill DP, Filbin MG.. Molecular pathogenesis and therapeutic implications in pediatric high-grade gliomas. Pharmacol Ther. 2018;182:70–79. - PubMed
    1. Mandell LR, Kadota R, Freeman C, et al. . There is no role for hyperfractionated radiotherapy in the management of children with newly diagnosed diffuse intrinsic brainstem tumors: results of a Pediatric Oncology Group phase III trial comparing conventional vs. hyperfractionated radiotherapy. Int J Radiat Oncol Biol Phys. 1999;43(5):959–964. - PubMed
    1. MacDonald TJ, Aguilera D, Kramm CM.. Treatment of high-grade glioma in children and adolescents. Neuro Oncol. 2011;13(10):1049–1058. - PMC - PubMed
    1. Vanan MI, Eisenstat DD.. Management of high-grade gliomas in the pediatric patient: Past, present, and future. Neurooncol Pract. 2014;1(4):145–157. - PMC - PubMed
    1. Mackay A, Burford A, Carvalho D, et al. . Integrated molecular meta-analysis of 1,000 pediatric high-grade and diffuse intrinsic pontine glioma. Cancer Cell. 2017;32(4):520–537.e5. - PMC - PubMed

Publication types

MeSH terms

Substances