

A Scholte wave approach for ultrasonic surface acoustic wave elastography
- PMID: 36971512
- PMCID: PMC11504899
- DOI: 10.1002/mp.16394
A Scholte wave approach for ultrasonic surface acoustic wave elastography
Abstract
Background: Pathological changes in tissues are often related to changes in tissue mechanical properties, making elastography an important tool for medical applications. Among the existing elastography methods, ultrasound elastography is of great interest due to the inherent advantages of ultrasound imaging technology, such as low cost, portability, safety, and wide availability. Although ultrasonic shear wave elastography, as a platform technology, can potentially quantify the elasticity of tissue at any depth, its current implementation cannot assess superficial tissue but can only image deep tissue.
Purpose: To address this challenge, we proposed an ultrasonic Scholte-wave-based approach for imaging the elasticity of superficial tissue.
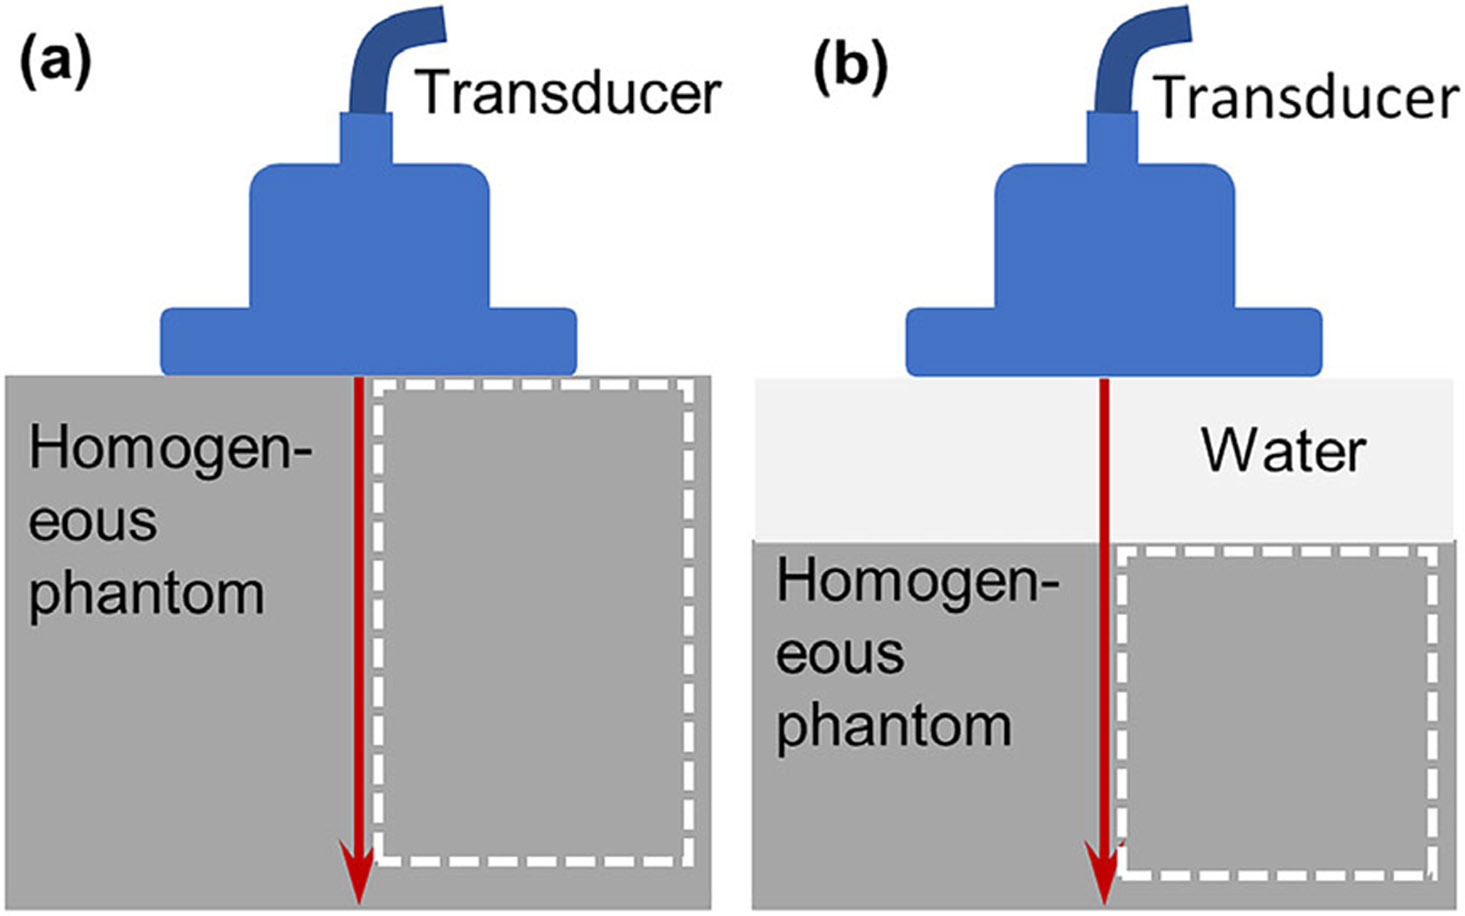
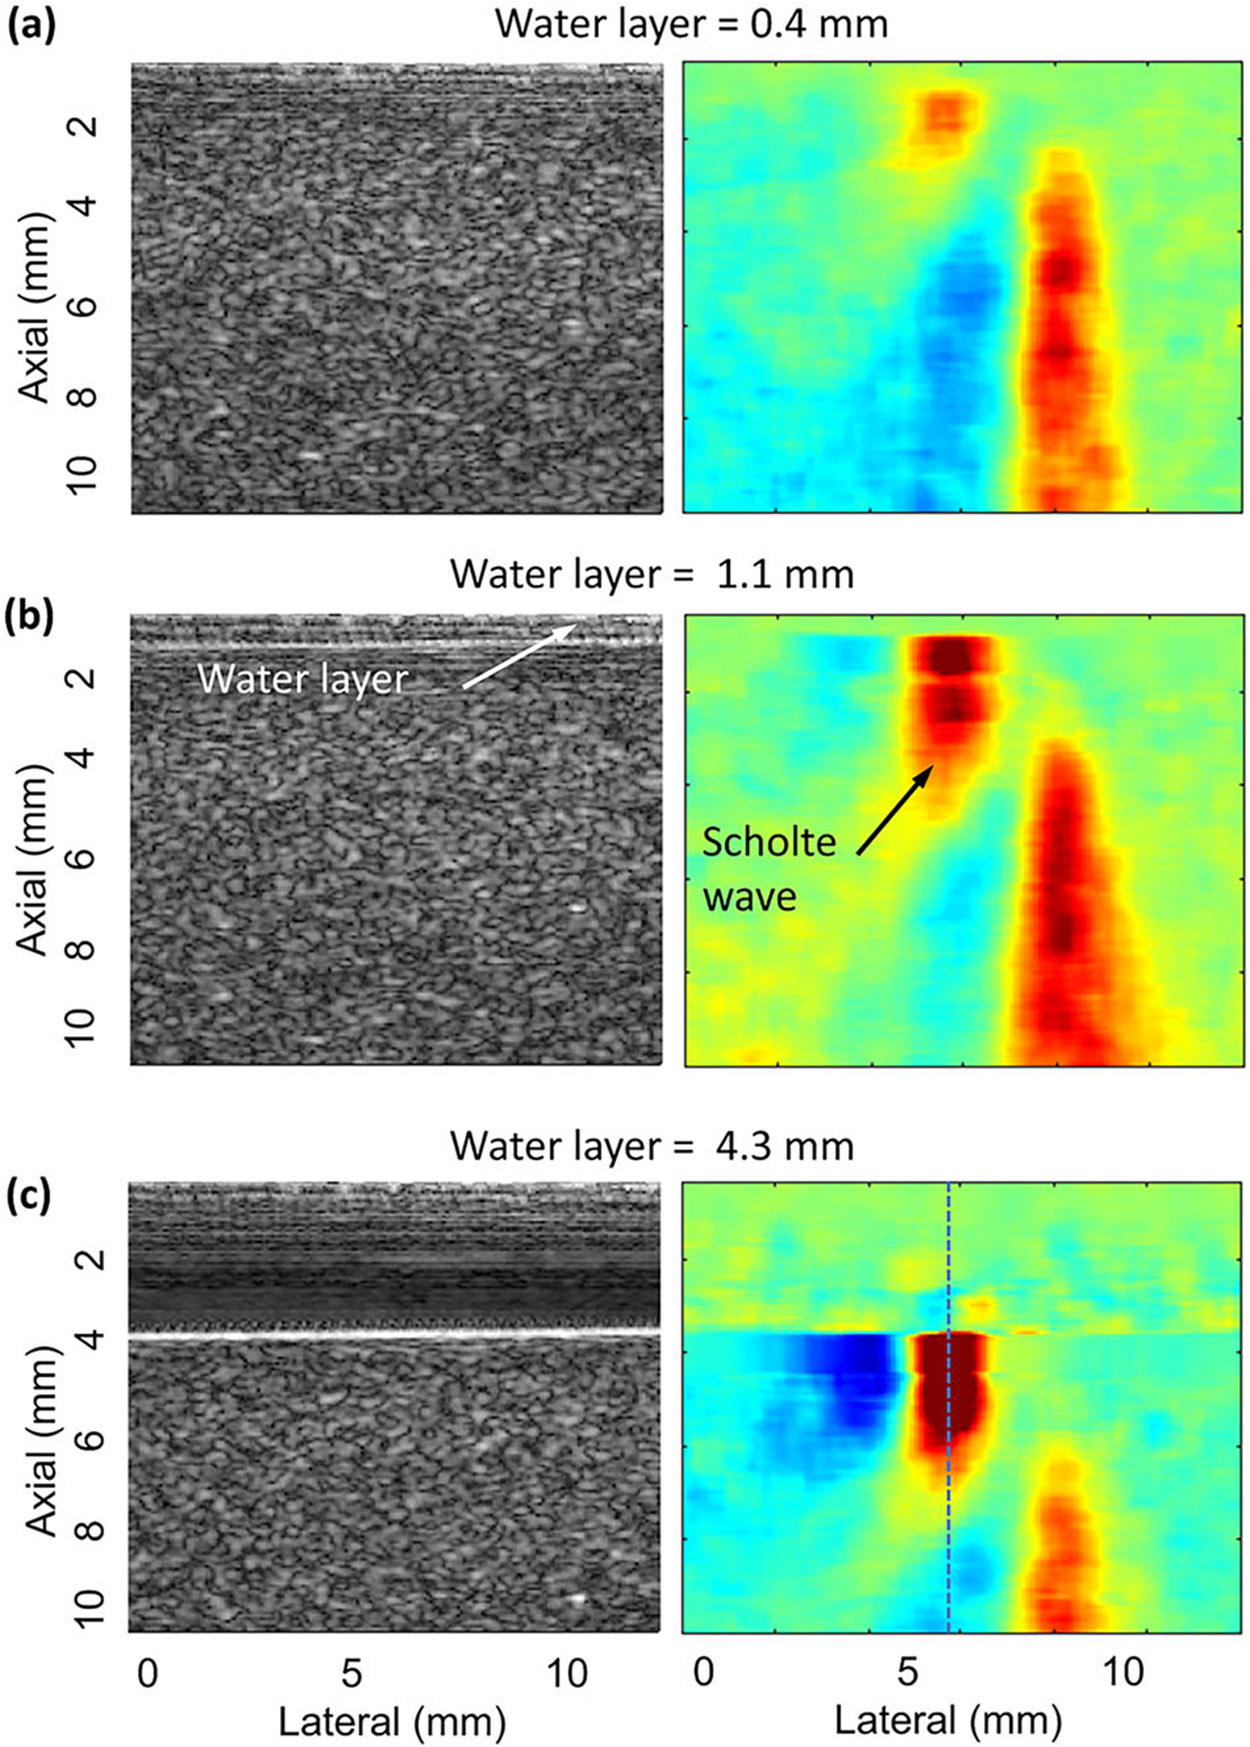
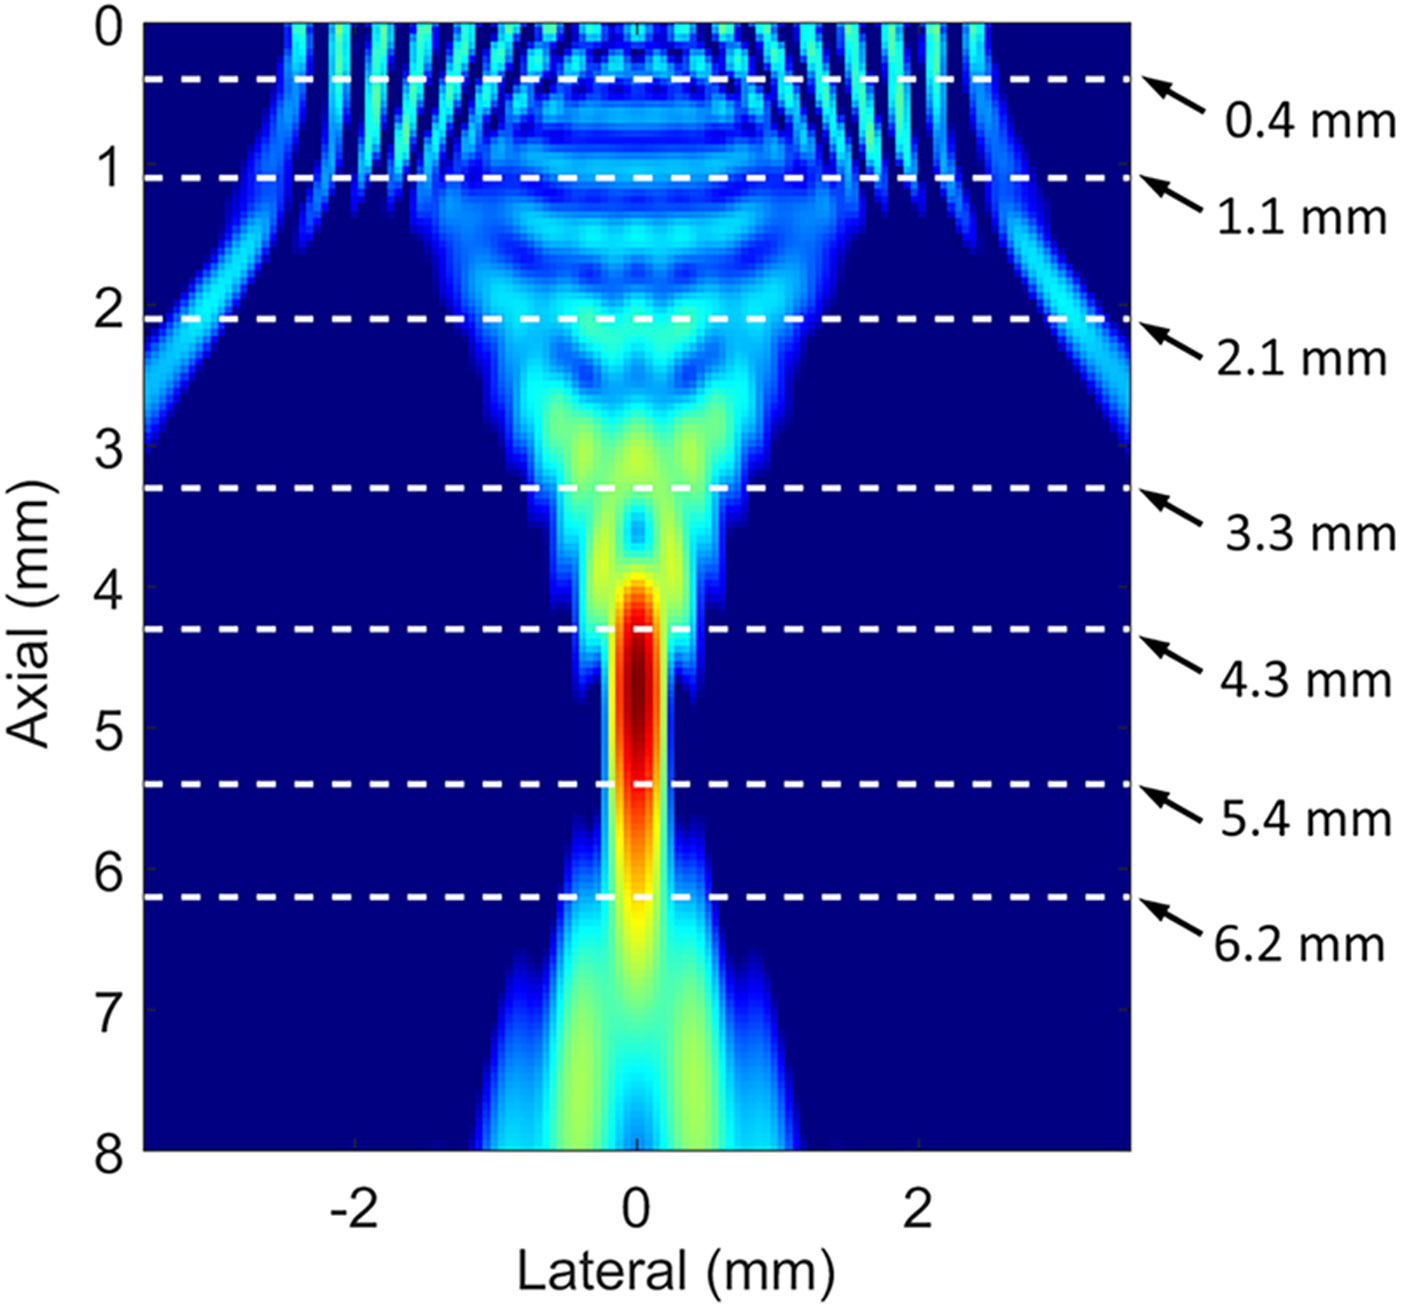
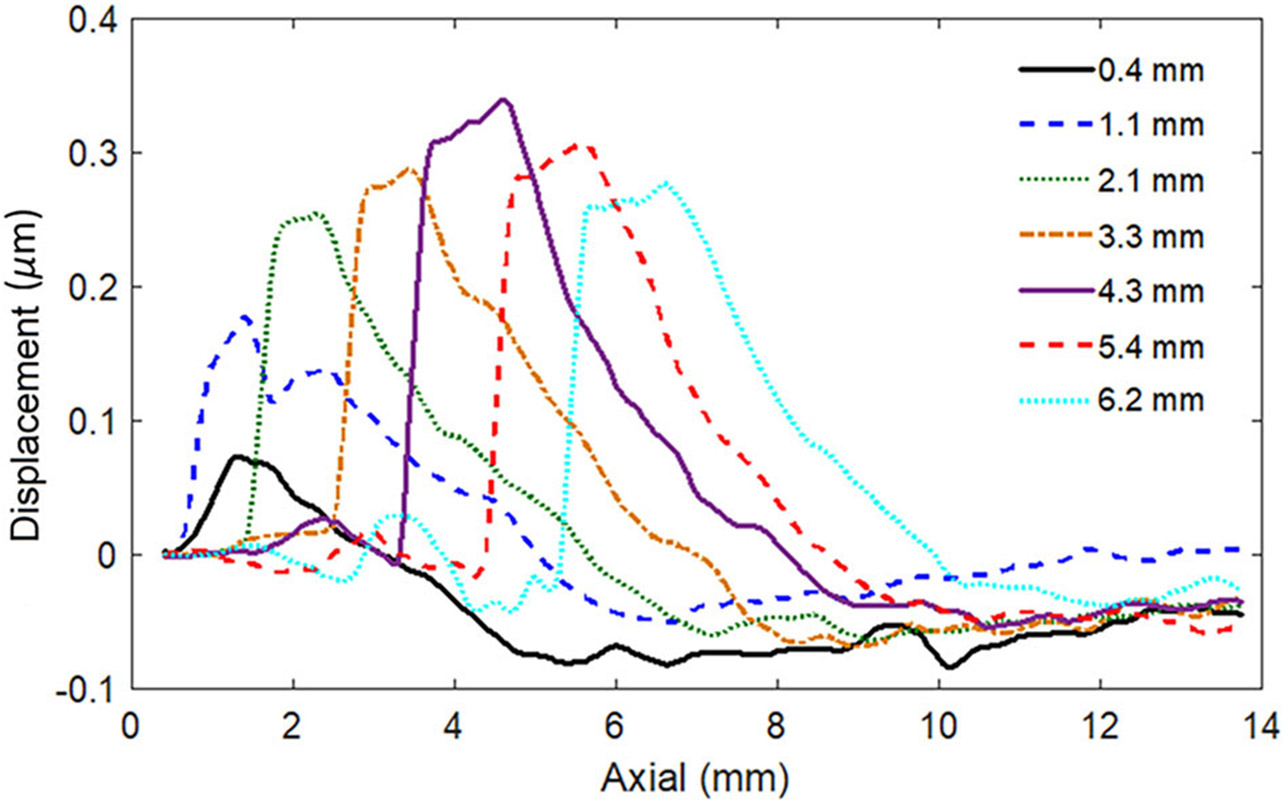
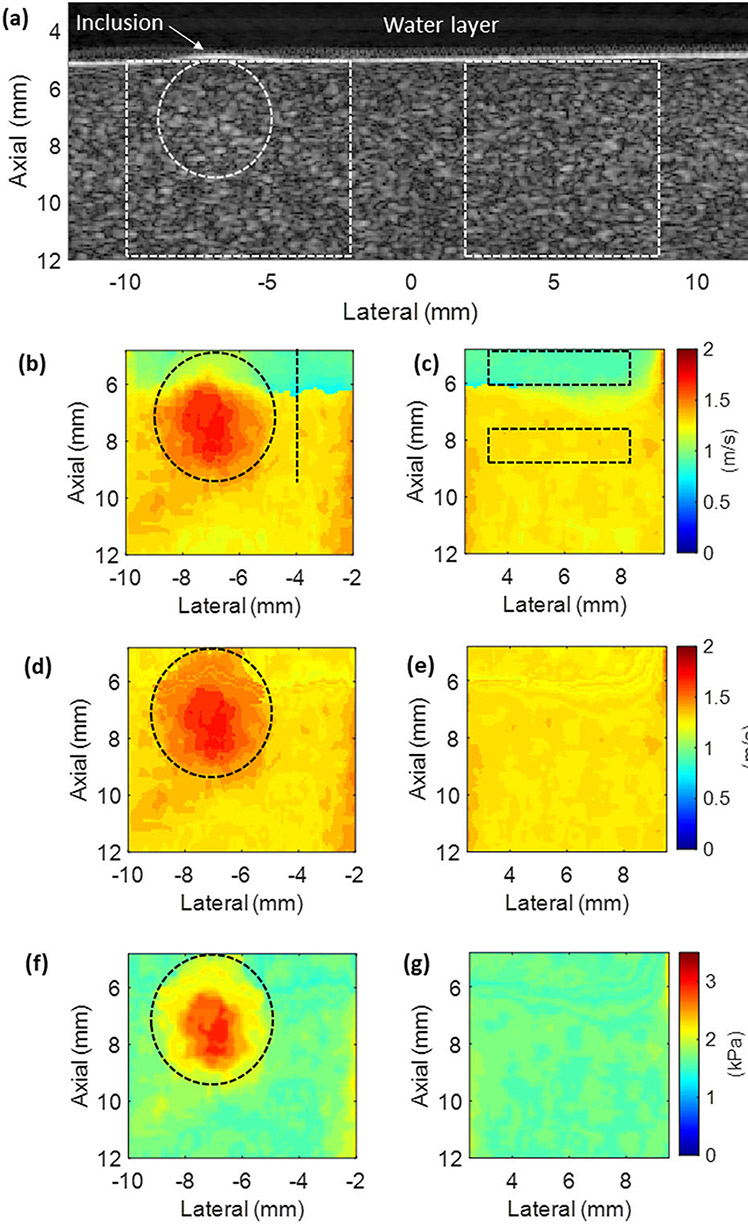
Methods: The feasibility of the proposed technique was tested using a gelatin phantom with a cylindrical inclusion. To generate Scholte wave in the superficial region of the phantom, we proposed a new experimental configuration in which a liquid layer was introduced between an ultrasound imaging transducer and the tissue-mimicking phantom. We utilized an acoustic radiation force impulse to excite the tissue-mimicking phantom, analyzed the properties of the generated Scholte waves, and applied the waves for elasticity imaging.
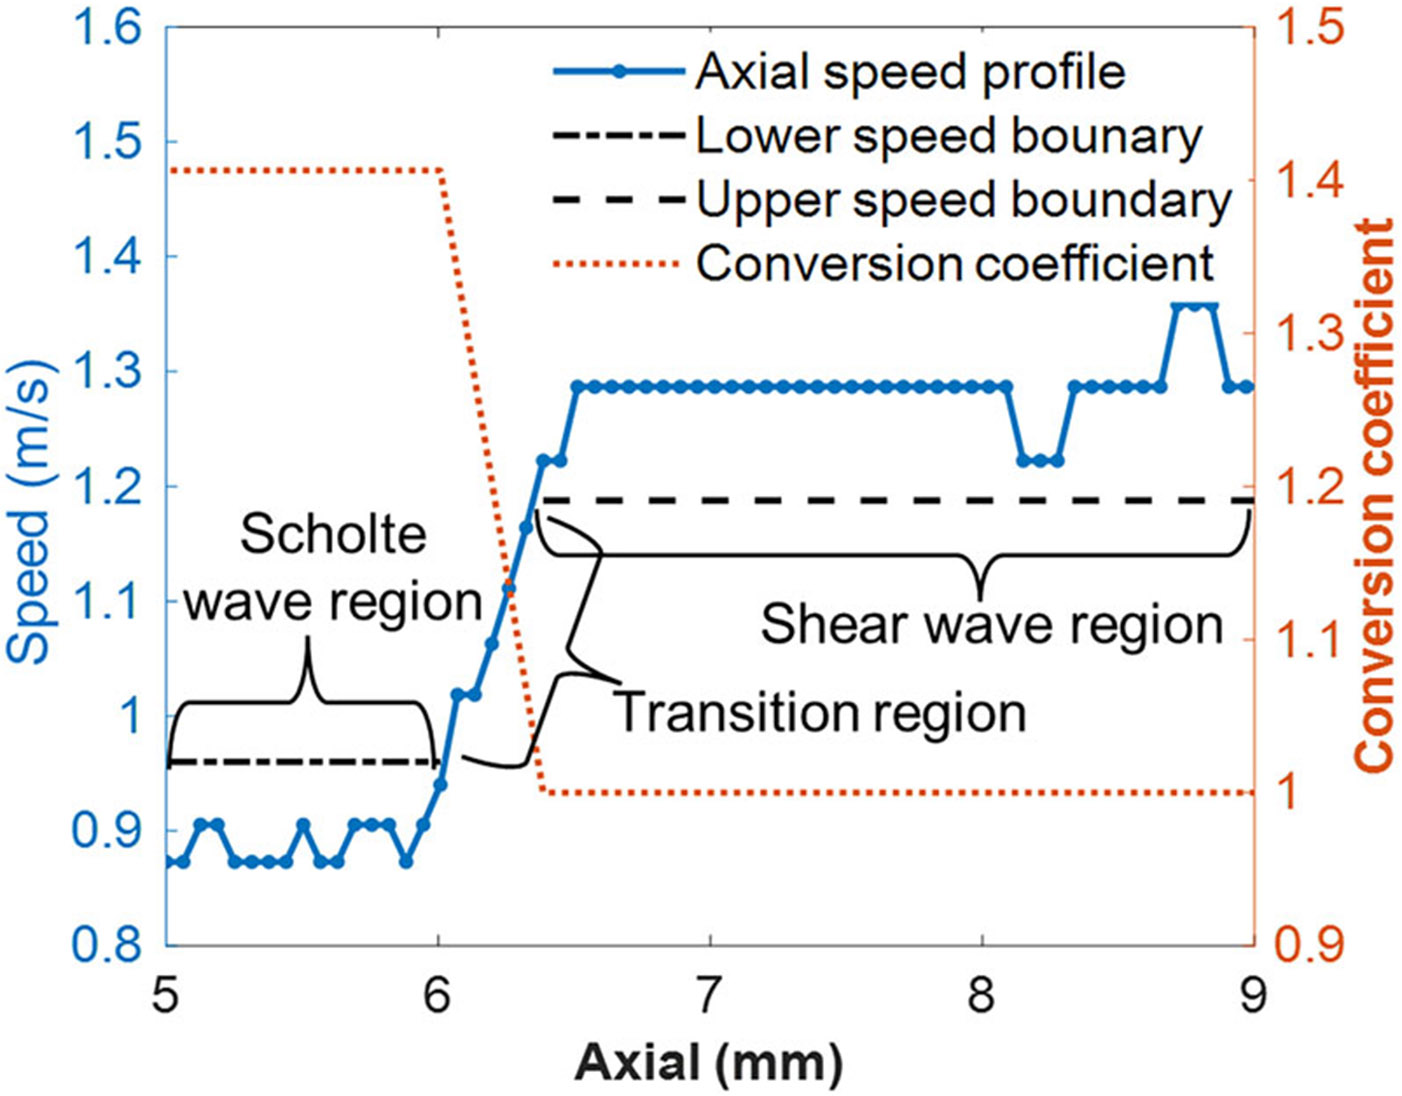
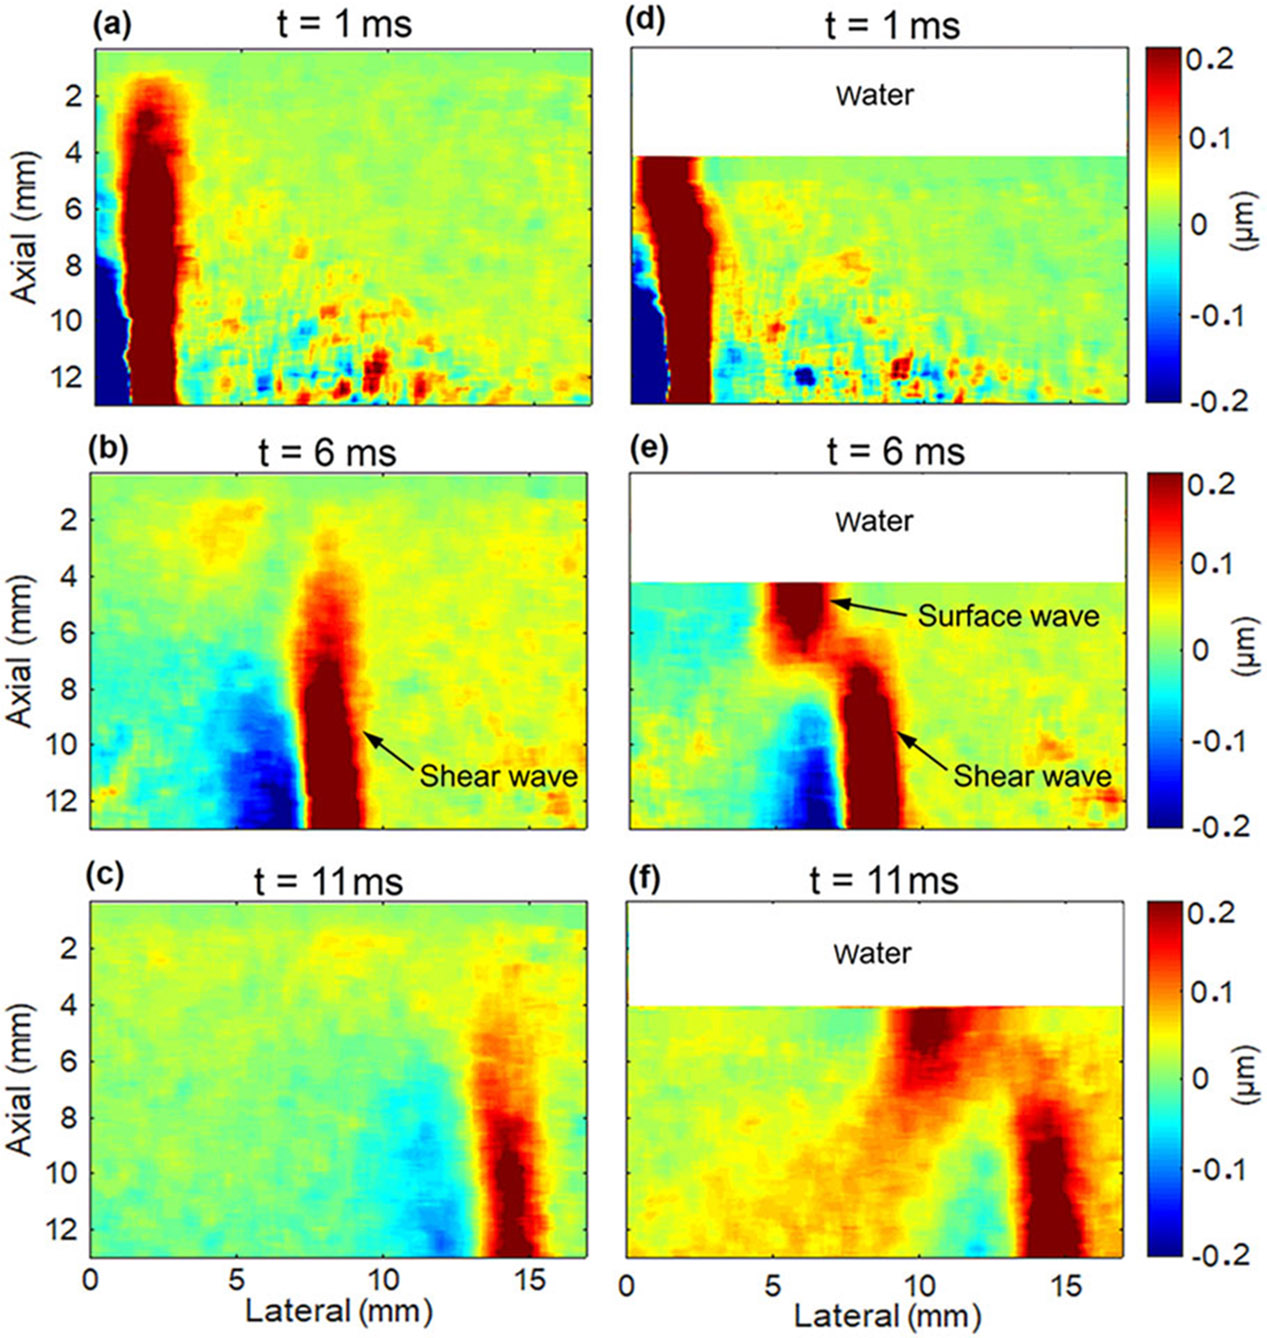
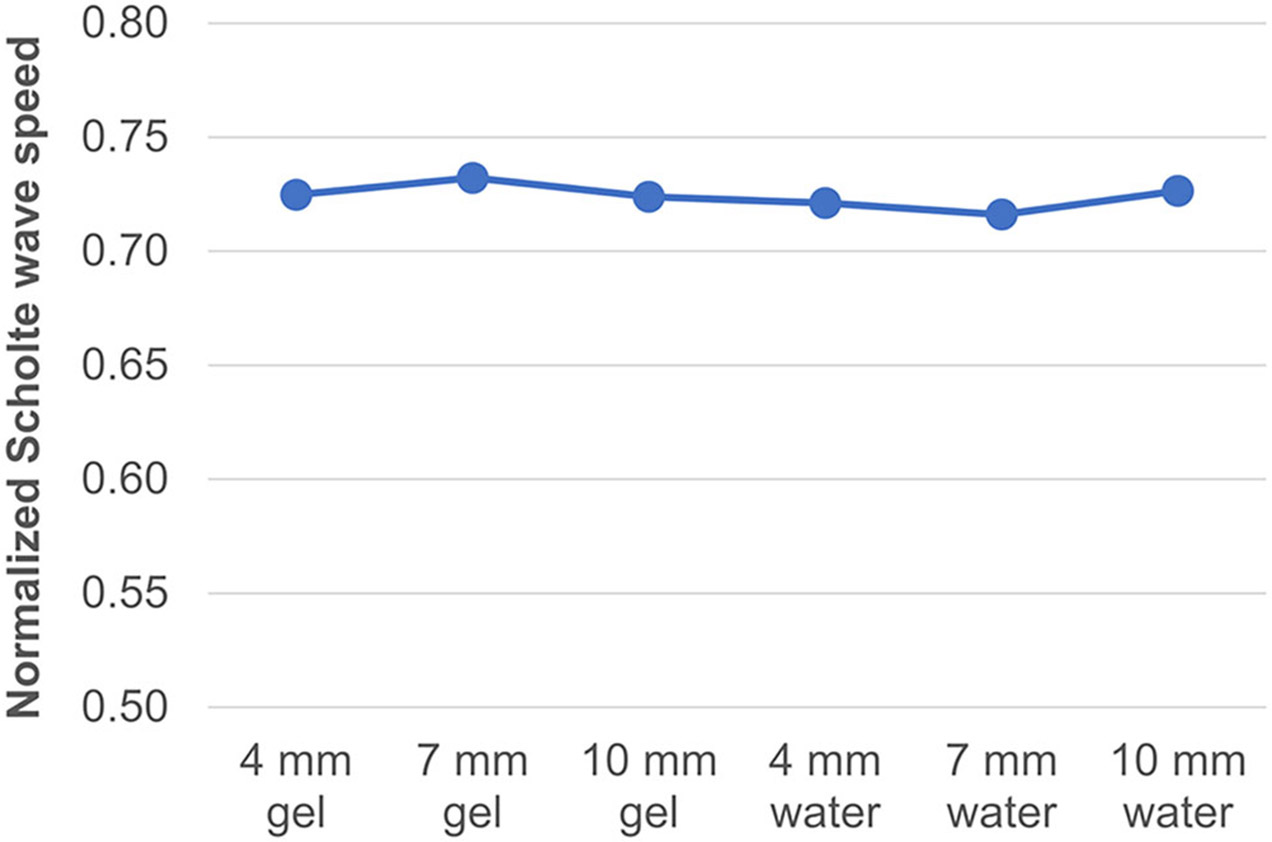
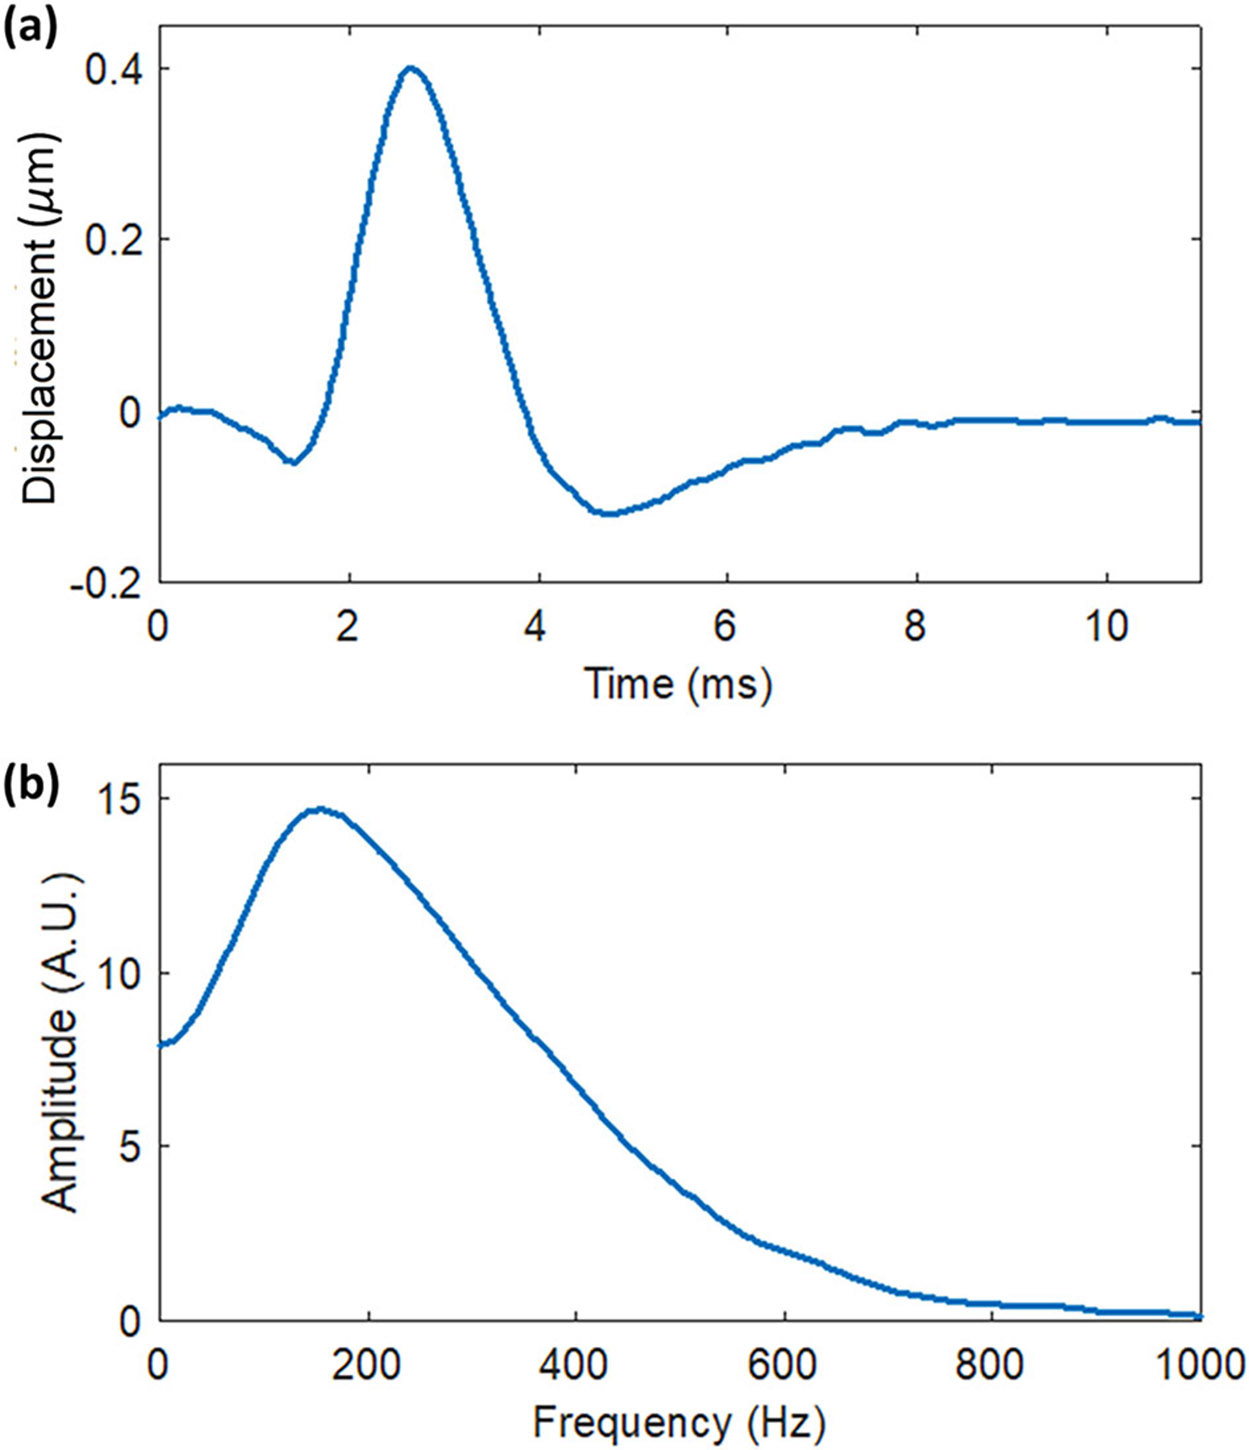
Results: In this study, we first reported the observation that Scholte (surface) waves and shear (bulk) waves were simultaneously generated, and they propagated in the superficial and deeper regions of the phantom, respectively. Then, we presented some important properties of the generated Scholte waves. For a 5w/v% gelatin phantom, the generated Scholte waves have a speed of around 0.9 m/s, a frequency of about 186 Hz, and thus a wavelength of about 4.8 mm. The speed ratio between the simultaneously generated Scholte wave and shear wave is about 0.717, which is 15% lower than the theoretical expectation. And we further demonstrated the feasibility of Scholte wave as a mechanism for imaging superficial tissue elasticity. Together with the simultaneously generated shear wave, the Scholte wave was shown to be able to quantitatively image both the background and the cylindrical inclusion (4 mm in diameter) of the tissue-mimicking gelatin phantom.
Conclusions: This work shows that the elasticity of superficial tissue can be evaluated by utilizing the generated Scholte wave alone, and it also shows that a comprehensive elasticity imaging of the tissue extending from the superficial to deep regions can be achieved by combining the proposed Scholte wave technique and the conventional shear wave technique.
Keywords: Scholte wave; acoustic radiation force impulse; elastography; shear wave; shear wave elasticity imaging; surface acoustic wave.
© 2023 American Association of Physicists in Medicine.
Conflict of interest statement
CONFLICT OF INTEREST
The authors have no relevant conflicts of interest to disclose.
Figures

Similar articles
-
Ultrasonic surface acoustic wave elastography: A review of basic theories, technical developments, and medical applications.Med Phys. 2024 May;51(5):3220-3244. doi: 10.1002/mp.17063. Epub 2024 Apr 10. Med Phys. 2024. PMID: 38597908 Review.
-
The role of viscosity estimation for oil-in-gelatin phantom in shear wave based ultrasound elastography.Ultrasound Med Biol. 2015 Feb;41(2):601-9. doi: 10.1016/j.ultrasmedbio.2014.09.028. Epub 2014 Dec 23. Ultrasound Med Biol. 2015. PMID: 25542484
-
Ultrasound Shear Wave Elastography for Liver Disease. A Critical Appraisal of the Many Actors on the Stage.Ultraschall Med. 2016 Feb;37(1):1-5. doi: 10.1055/s-0035-1567037. Epub 2016 Feb 12. Ultraschall Med. 2016. PMID: 26871407
-
Multi-source and multi-directional shear wave generation with intersecting steered ultrasound push beams.IEEE Trans Ultrason Ferroelectr Freq Control. 2015 Apr;62(4):647-62. doi: 10.1109/TUFFC.2014.006805. IEEE Trans Ultrason Ferroelectr Freq Control. 2015. PMID: 25881343 Free PMC article.
-
WFUMB guidelines and recommendations for clinical use of ultrasound elastography: Part 1: basic principles and terminology.Ultrasound Med Biol. 2015 May;41(5):1126-47. doi: 10.1016/j.ultrasmedbio.2015.03.009. Epub 2015 Mar 21. Ultrasound Med Biol. 2015. PMID: 25805059 Review.
Cited by
-
Mathematical Models for Ultrasound Elastography: Recent Advances to Improve Accuracy and Clinical Utility.Bioengineering (Basel). 2024 Sep 30;11(10):991. doi: 10.3390/bioengineering11100991. Bioengineering (Basel). 2024. PMID: 39451367 Free PMC article. Review.
-
A pilot study of cardiac guided wave elastography: An ex vivo testing in a rodent model with mechanical testing validation.Front Acoust. 2024;2:1485055. doi: 10.3389/facou.2024.1485055. Epub 2024 Oct 9. Front Acoust. 2024. PMID: 39463463 Free PMC article.
References
-
- Ilyas A, Asghar W, Ahmed S, et al. Electrophysiological analysis of biopsy samples using elasticity as an inherent cell marker for cancer detection. Anal Methods. 2014;6(18)7166–7174. doi:10.1039/c4ay00781f - DOI
-
- Vlachopoulos C, Aznaouridis K, Terentes-Printzios D, Ioakeimidis N, Stefanadis C. Prediction of Cardiovascular Events and All-Cause Mortality With Brachial-Ankle Elasticity Index A Systematic Review and Meta-Analysis. Hypertension. 2012;60(2):556–562. doi:10.1161/Hypertensionaha.112.194779 - DOI - PubMed
-
- Juonala M, Jarvisalo MJ, Maki-Torkko N, Kahonen M, Viikari JSA, Raitakari OT. Risk factors identified in childhood and decreased carotid artery elasticity in adulthood - The cardiovascular risk in Young Finns Study. Circulation. 2005;112(10):1486–1493. doi:10.1161/Circulationaha.104.502161 - DOI - PubMed
MeSH terms
Substances
Grants and funding
LinkOut - more resources
Full Text Sources
